 🏗️ New Construction
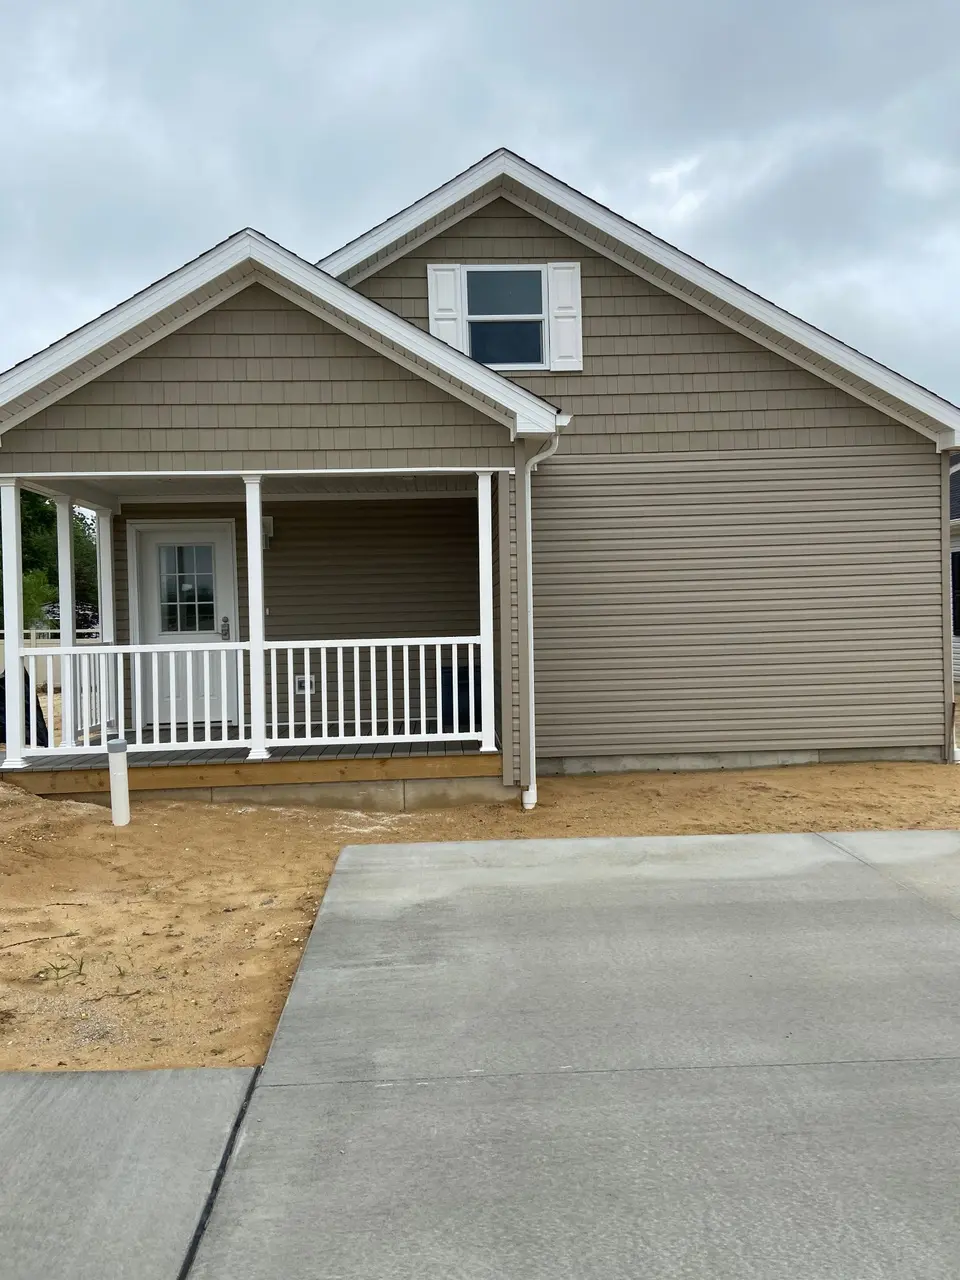
The Minotola Plan · Buena, NJ
Flood risk No data
- FEMA flood zone
- —
- Chance of flooding over 30 yrs
- —
- Est. flood insurance / yr
- —
Fire risk No data
- Est. fire insurance / yr
- —
Heat risk No data
- Hot days now (above threshold)
- —
- Hot days in 30 yrs
- —
Wind risk No data
- Chance of severe wind over 30 yrs
- —
Air-quality risk No data
- Unhealthy air days now
- —
- Unhealthy air days in 30 yrs
- —
Risk factors via First Street. Map © Google.
Why this score? — see what drove the F grade
The composite is a weighted blend of 9 inputs, each scored 0–100. Each bar is that input's sub-score; the figure is the points it added to the 100-point composite (weight × sub-score).
- Cash flow +7.6/30.0
- ARV discount +7.5/15.0
- Appreciation +5.1/10.0
- Livability +2.9/5.0
- Rent growth +2.5/5.0
- Condition / age +2.5/5.0
- 1% rule +2.2/10.0
- Schools +1.9/10.0
- DSCR +1.7/10.0
$267,000
🖨 Deal sheet (PDF) 📄 Offer letter ✓ Due diligence
Listing remarks MLS
1500 square foot home which has 3 bedrooms, two full baths (one off master), open floor plan connecting living room, kitchen, and dining area leading to your patio thru the slider out back
Key facts
- Listed 947 days
Neighborhood map
What this means for you Summary
Snapshot
- This is a 3-bed/2.0-bath single-family listed at $267k.
Deal economics
- At list price, monthly cash flow is $-356 ($-4k/yr) — negative.
- To cash-flow at today's rent, offer at most $240k (10.1% below list).
- To meet the 1% rule (rent ≥ 1% of price), the offer needs to be $210k (21.3% below list).
- Recommended offer: $210k (21.3% below list) — sets the bar for 1% rule.
- Cap rate 4.8% vs local median 3.7% in Buena — meaningfully above typical; check what's discounted (condition, days-on-market, listing class) to confirm the premium yield is real.
Location & tenants
- Location reads 58/100 on livability (#501 in NJ) — a working-class tenant base; expect higher turnover. Strengths: housing A+, crime A-; Watch: schools F, amenities F, commute F.
- Buena Regional School District (rural): math 11% / reading 30% proficiency, ranked #425 of 472 in NJ (top 90%) — low school quality limits family demand, transient renter base, plan for 1-2y turnover.
- Market conditions: 15 active listings in the ZIP; 1 comparable units currently listed for rent nearby; 672 units permitted in Atlantic County in 2024 (258 in 5+ unit buildings).
Forward outlook
- In year one you build about $3k of equity ($2k loan paydown + $536 appreciation (0.2% local appreciation)).
- Atlantic County population projected at -12% by 2050 — secular population decline; favor cash flow + early exit over multi-decade hold.
- By year 10, paydown + projected appreciation supports a ~$33k cash-out refi (75% LTV) — recoverable capital for the next deal without selling this one.
Negotiation context
- It's been on market 948 days — a 12% lower offer ($235k) is reasonable based on typical stale-listing flexibility.
Questions for the listing agent
- What do current leases actually rent for vs. the listed asking? Can we see a recent rent roll and the last 12 months of T-12 income?
- It's been on market 948 days. Have you received any prior offers? Is the seller open to a 21% concession, seller financing, or rate buy-down credit?
- Why hasn't it sold? Are there any deal-killer items the seller is aware of (foundation, flood, title, zoning, code violations)?
- Is there a deadline driving the sale (1031 exchange, divorce, estate, relocation)? That informs how much negotiation room exists.
- Schools are F-rated, which usually means shorter tenancies and higher turnover. Who's the typical renter profile here, and what's been the actual vacancy rate?
- The area grade is low — what's the realistic commute time and amenity access for the typical tenant pool here? Any planned neighborhood developments (good or bad) we should know about?
- What's the average days-on-market for RENTAL listings here right now (not sales)? A rising rental-DOM trend means longer vacancies and softer asking-rent achievability than the comps imply.
- What's the recent tenant-quality profile in this submarket — average credit score on applications, eviction rate, late-payment / NSF rate, and stable-employment percentage? A property-management company in the area should have these aggregated.
- How much new for-sale + rental construction is in the pipeline within 1–3 miles? Heavy new supply typically softens prices + rents 12–24 months out; constrained supply supports both.
Investment metrics
- 1% rule
- 0.72% ✗
- Cap rate
- 4.83%
- Cash-on-cash
- -5.23%
- DSCR
- 0.77
- GRM
- 11.6
CMA / ARV
- ARV (median comp)
- $291,508
- List price
- $267,000
- Delta
- -8.41%
- Verdict
- FAIR
- Comps
- 20 within 1.0 mi
Show comp detail 12 sales within ~0.75 mi
| Address | Dist | Beds/Ba | Sqft | Sold | Price | $/sf | Match |
|---|---|---|---|---|---|---|---|
| 104 Fiocchi St | 0.03mi | 3/2.5 | 1,392 (-7%) | 2mo | $360,000 | $259 | 82 |
| 104 N West Ave | 0.41mi | 3/2.0 | 1,480 (-1%) | 1mo | $345,000 | $233 | 78 |
| 108 N Franklin St | 0.25mi | 3/2.5 | 1,428 (-5%) | 3mo | $402,000 | $282 | 76 |
| 605 W Summer Ave | 0.24mi | 3/1.0 | 1,512 (+1%) | 18mo | $325,000 | $215 | 68 |
| 112 W Pacific Ave | 0.43mi | 3/1.0 | 1,596 (+6%) | 0mo | $304,900 | $191 | 65 |
| 302 W Arbor Ave | 0.30mi | 3/1.0 | 1,381 (-8%) | 8mo | $309,000 | $224 | 62 |
| 1404 S Central | 0.65mi | 3/2.5 | 1,427 (-5%) | 2mo | $383,000 | $268 | 58 |
| 208 W Arctic Ave | 0.56mi | 3/2.0 | 1,593 (+6%) | 10mo | $374,000 | $235 | 55 |
| 109 Melini Ave | 0.48mi | 3/2.0 | 1,600 (+7%) | 14mo | $365,000 | $228 | 55 |
| 105 S East Boulevard Ext | 0.70mi | 3/1.0 | 1,504 (+0%) | 10mo | $280,000 | $186 | 54 |
| 543 Forest Grove Rd | 0.67mi | 4/2.0 (+1) | 1,488 (-1%) | 19mo | $355,000 | $239 | 46 |
| 201 W Arctic Ave | 0.54mi | 2/1.5 (-1) | 1,316 (-12%) | 13mo | $320,000 | $243 | 36 |
Match score weights: distance 35% · size 25% · config 20% · recency 20%. Top-matched comps best support the ARV.
Projected returns pro-forma
0.18% appreciation · 3.0% rent growth · sell at horizon
- IRR
- -7.4%
- Equity multiple
- 0.65×
- Total profit
- $-28,609
- Equity at exit
- $87,338
- IRR
- -1.4%
- Equity multiple
- 0.84×
- Total profit
- $-12,817
- Equity at exit
- $107,158
Cash invested: $81,622 (down + closing). Projections, not guarantees.
Landlord ↔ Tenant lean methodology
- Overall (STATE)
- 21 Tenant-Leaning
- State New Jersey
- 21 Tenant-Leaning · D+6
- County
- — inherits STATE
- City
- — inherits STATE
ZIP-level market 08326
- Home prices YoY
- 0.1%
- Active inventory
- 15
- Price-to-rent
- 10.6×
Monthly cashflow live
- Estimated rent
- $2,100 medium interval (Pro) →
- Mortgage (P&I)
- −$1,529
- Tax est. 1.5%
- −$364 /mo · $4,373/yr
- Insurance
- −$121
- HOA
- −$0
- Vacancy / Maint / Mgmt
- −$441
- Net cashflow
- $-356
Break-even live
Sensitivity live
| Price | -10% $-154 | -5% $-255 | +0% $-356 | +5% $-456 | +10% $-557 |
|---|---|---|---|---|---|
| Rent | -10% $-521 | -5% $-438 | +0% $-356 | +5% $-273 | +10% $-190 |
| Rate | -1.0pp $-209 | -0.5pp $-281 | base $-356 | +0.5pp $-431 | +1.0pp $-508 |
UW: 25.0% down · 7.5% · 30yr · 1.5% tax · 5.0% vac · 8.0% maint · 8.0% mgmt
Financing live
Cash to close
- Down payment
- $72,877
- Closing costs
- $8,745
- Reserves months
- —
- Total cash needed
- —
Loan-product check · same deal, 3 products live
Conventional
25% down · 7.5% · 30yr
- Down + closing
- —
- Monthly P&I
- —
- Monthly cashflow
- —
- DSCR
- —
- Eligible?
- —
Personal DTI + credit; lowest rate.
DSCR
20% down · 8.5% · 30yr
- Down + closing
- —
- Monthly P&I
- —
- Monthly cashflow
- —
- DSCR
- —
- Eligible?
- —
No personal income docs; deal must DSCR.
Hard money
10% down · 12.0% · 12mo
- Down + closing
- —
- Monthly P&I
- —
- Monthly cashflow
- —
- DSCR
- —
- Eligible?
- —
Short-term bridge; refi at stabilization.
Rent comps 1 comps
| Address | Beds | Baths | Sqft | Rent | $/sqft | DOM | Units | Dist |
|---|---|---|---|---|---|---|---|---|
| 108 E Pacific Ave Unit 1 Minotola, NJ | 3.0 | 1.0 | 2114 | $2,100 | $0.99 | 19d | 1 | 0.32mi |
Listing history 19 events
-
2026-06-19days on market $267,000 Active 948 DOM
-
2026-06-18days on market $267,000 Active 947 DOM
-
2026-06-17days on market $267,000 Active 946 DOM
-
2026-06-16days on market $267,000 Active 945 DOM
-
2026-06-15days on market $267,000 Active 944 DOM
-
2026-06-14days on market $267,000 Active 942 DOM
-
2026-06-13days on market $267,000 Active 941 DOM
-
2026-06-10days on market $267,000 Active 939 DOM
-
2026-06-09days on market $267,000 Active 938 DOM
-
2026-06-08days on market $267,000 Active 937 DOM
-
2026-06-07days on market $267,000 Active 936 DOM
-
2026-06-05days on market $267,000 Active 933 DOM
-
2026-06-03days on market $267,000 Active 932 DOM
-
2026-06-02days on market $267,000 Active 931 DOM
-
2026-06-01days on market $267,000 Active 930 DOM
-
2026-05-31days on market $267,000 Active 929 DOM
-
2026-05-30days on market $267,000 Active 928 DOM
-
2026-05-06price $267,000 188-char remark
Show marketing remark (188 chars)
1500 square foot home which has 3 bedrooms, two full baths (one off master), open floor plan connecting living room, kitchen, and dining area leading to your patio thru the slider out back
-
2023-11-14$1 Active 188-char remark
Show marketing remark (188 chars)
1500 square foot home which has 3 bedrooms, two full baths (one off master), open floor plan connecting living room, kitchen, and dining area leading to your patio thru the slider out back
ⓘ Source: listings_history table (triggers on properties + properties_extension) + one-shot
backfill from property_details.listing_events for pre-trigger history.
Nearby sold comps map
Loading sold comps map…
Walkable amenities ~0.75 mi
Loading nearby amenities…
Taxation est. · year 1
- Rental income
- $25,200
- − Mortgage interest
- −$16,329
- − Property taxes
- −$4,373
- − Insurance
- −$1,458
- − Repairs & maintenance
- −$2,016
- − Management
- −$2,016
- − Depreciation
- −$8,480
- Taxable loss
- −$9,471
- Est. tax savings @ 24.0%
- +$2,273
- After-tax cash flow
- $-1,993/yr
For passive investors: Depreciation is non-cash, so a rental often shows a tax loss while cash-flowing — sheltering income. Rental losses are passive: they offset passive income freely, and up to $25,000/yr can offset ordinary (W-2) income if you actively participate and your MAGI is under $100k (phasing out to $0 by $150k); unused losses carry forward. On sale, claimed depreciation is recaptured at up to 25%, and gains may owe capital-gains tax (a 1031 exchange can defer both). Figures are a year-1 estimate at your 24.0% rate — not tax advice; consult a CPA.
Schools (NCES district)
- District
- Buena Regional School District
- NCES district ID
- 3402400
- Math proficiency
- 11% ▼ -12.00%
- Reading proficiency
- 30% ▼ -3.00%
- Median HH income
- $52,887
- Composite
- 18.53/100
- National rank
- #8915
- State rank
- #425 of 472 in NJ
Livability — Buena
- Score
- 58/100
- State rank
- #501
- US rank
- #20678
Category grades
Schools grade is shown separately in the Schools card above.
Census & demographics
- Census place
- Buena, NJ
- City population
- 3,432
- Population (ZIP)
- 1,430
Population outlook (Atlantic County) Hauer SSP2
- Today (2025)
- 268,948 people
- By 2030
- 264,497 · -1.7%
- By 2040
- 252,261 · -6.2%
- By 2050
- 237,846 · -11.6%
- By 2075
- 210,650 · -21.7%
- By 2100
- 180,234 · -33.0%
Race, ethnicity, and origin ACS 2023
- Neighborhood character
- Predominantly White (74%)
- Race & ethnicity
- White 74% Hispanic / Latino 24% Two or more races 6%
- Hispanic origin (detail)
- Mexican 12% Puerto Rican 8%
- Common ancestry
- Romanian 2% Scotch-Irish 2% Portuguese 1%
- Foreign-born
- 11% · Canada, South Korea
- Languages at home
- 73% English-only · Spanish 22% Other Indo-European 3% Russian/Polish/Slavic 1%
Political lean MEDSL · Atlantic
- 2024 margin
- Toss-up / Even · D 47.7% · R 50.7% · Other 1.6%
- 2008→2024 swing
- -18.1pp toward R · 2008: 15.1pp · 2024: -3.0pp
- All cycles
- 2024: R+3.0 2020: D+6.7 2016: D+6.2 2012: D+17.2 2008: D+15.1
Not yet ingested
- Civics
- —
Market trends
- HPI YoY
- ▲ 0.18%
- Current HPI
- 313.1679
- Rent YoY
- —
- Metro
- —
- State GDP YoY
- ▲ 2.05%
- F500 in state
- 34
Industry mix (Fortune 500 HQ in NJ)
| Industry | F500 HQs | Revenue |
|---|---|---|
| Consumer Goods | 3 | $31B |
|
||
| Pharmaceuticals | 2 | $153B |
|
||
| Technology | 2 | $21B |
|
||
| Insurance | 2 | $20B |
|
||
| Healthcare | 2 | $19B |
|
||
| Financial Services | 1 | $70B |
|
||
Price history
2 events — show timeline
- 2026-05-06 Price Changed $267,000 Zillow
- 2023-11-14 Listed $1 Zillow
Cash-flow waterfall
monthlySold comps — $/sqft
last 12 mo · ≤1 miLoading sold comps…