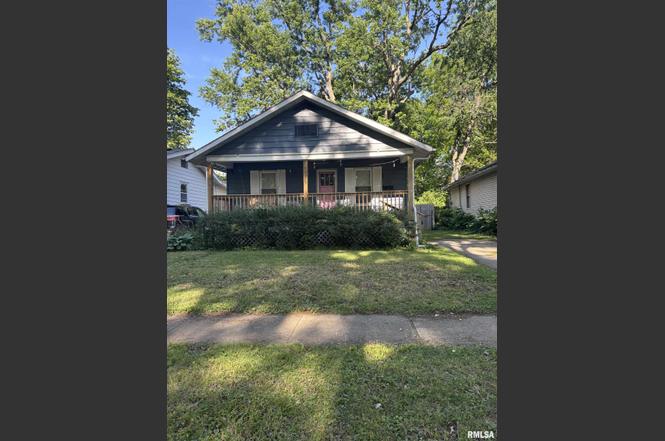
2216 S Lowell Ave · Springfield, IL
Flood risk 4/10 · Minor
- FEMA flood zone
- X (unshaded)
- Chance of flooding over 30 yrs
- 0.21%
- Est. flood insurance / yr
- $473 – $860
Fire risk 1/10 · Minimal
- Est. fire insurance / yr
- $804 – $1,492
Heat risk 4/10 · Minor
- Hot days now (above 105°F)
- 7 days/yr
- Hot days in 30 yrs
- 20 days/yr
Wind risk 2/10 · Minimal
- Chance of severe wind over 30 yrs
- 1.0%
Air-quality risk 2/10 · Minimal
- Unhealthy air days now
- 1 days/yr
- Unhealthy air days in 30 yrs
- 2 days/yr
Risk factors via First Street. Map © Google.
Why this score? — see what drove the D+ grade
The composite is a weighted blend of 9 inputs, each scored 0–100. Each bar is that input's sub-score; the figure is the points it added to the 100-point composite (weight × sub-score).
- Cash flow +20.2/30.0
- DSCR +6.4/10.0
- 1% rule +5.9/10.0
- ARV discount +4.1/15.0
- Rent growth +4.1/5.0
- Livability +4.0/5.0
- Condition / age +2.5/5.0
- Schools +1.7/10.0
- Appreciation +0.0/10.0
$93,500
🖨 Deal sheet (PDF) 📄 Offer letter ✓ Due diligence
Listing remarks MLS
This cute little bungalow, built in 1922, is located in a wonderful neighborhood with brick streets and a boulevard in the middle. Great centralized location in Springfield, close to downtown and west end shopping. Beautiful hardwood floor and plantation blinds. Recent updates include fresh paint, updated tile in kitchen & bath, newer roof and newer privacy fence. Property being sold as-is, inspections are welcome.
Key facts
- 6,640 sq ft lot
- Parking
- Built 1922
Neighborhood map
What this means for you Summary
Snapshot
- This is a 2-bed/1.0-bath single-family listed at $94k.
Deal economics
- At list price, monthly cash flow is $118 ($1k/yr) — positive.
- The deal already cash-flows at list — no discount required.
- Meets the 1% rule at list price ($1k rent vs $94k).
- Cap rate 7.8% vs local median 4.9% in Springfield — top-decile yield for the area; either an underpriced asset or a hidden risk that comps aren't pricing in. Stress-test before assuming the spread holds.
Location & tenants
- Location reads 79/100 on livability (#122 in IL, #2,138 nationally) — a middle-class / working-renter tenant base. Strengths: amenities A+, commute A+, cost of living A+; Watch: crime F.
- Springfield SD 186 (urban): math 17% / reading 22% proficiency, ranked #438 of 620 in IL (top 71%) — low school quality limits family demand, transient renter base, plan for 1-2y turnover; 64% free/reduced lunch — lower-income household profile, screen leases tightly.
- Zoned schools: Black Hawk Elem School (math 5% / reading 15%, grade F, #1,477 of 2,056 statewide, top 74%, 246 students, 0% FRL); Jefferson Middle School (math 3% / reading 8%, grade F, #635 of 665 statewide, top 95%, 539 students, 0% FRL); Springfield Southeast High Sch (math 17% / reading 22%, grade F, #397 of 693 statewide, top 61%, 1,261 students, 0% FRL) — zoned schools average 0% FRL vs 64% district-wide (64 pts lower); this property's tenant base skews higher-income than the district average.
- Market conditions: Rents rising fast (+6.3%/yr); 183 active listings in the ZIP; 17 comparable units currently listed for rent nearby; rentals at typical pace (median 23d on market — plan ~3-4 weeks tenant-placement turnaround); 47% of comp listings sitting > 30 days — soft ceiling on asking rent; 225 units permitted in Sangamon County in 2024 (48 in 5+ unit buildings).
- This rent is only 17% of the median local income ($70k/yr) — well below the 30% rent-burden line; pricing power to push rent on renewal without tenant pushback.
Forward outlook
- Local home prices are declining (-3.0%/yr); year-one equity from $646 of loan paydown is wiped out by about $3k of value loss. Plan a longer hold.
- Sangamon County population projected to shrink 9% by 2050 — rents likely to lag national; underwrite the cash flow, not the appreciation.
- At projected returns (-3.0% appreciation + 6.3% rent growth), your $26k cash investment doubles in ~10 years — after that, you're playing with house money.
Negotiation context
- Only 0 days on market — expect competitive offers; lowballing is unlikely to land.
- 5 sale attempts since 21y ago with the ask held roughly flat each time — persistent listings suggest the price (not the market) is what's stuck; bring a comps-based counter.
- Current owner paid $70k; 34% above their basis — modest negotiation headroom, anchor on the comps not their cost.
Risks & watch-outs
- Watch-outs: built in 1922 — expect roof / HVAC / electrical / plumbing capex.
Questions for the listing agent
- Built in 1922 — when were the roof, HVAC, electrical panel, plumbing, and water heater last replaced?
- Is there a deadline driving the sale (1031 exchange, divorce, estate, relocation)? That informs how much negotiation room exists.
- Schools are D-rated, which usually means shorter tenancies and higher turnover. Who's the typical renter profile here, and what's been the actual vacancy rate?
- Crime grade is F in this area — have there been break-ins, vandalism, or insurance claims at this property in the last 3 years? What carrier currently insures it and at what premium?
- The area grade is low — what's the realistic commute time and amenity access for the typical tenant pool here? Any planned neighborhood developments (good or bad) we should know about?
- What's the average days-on-market for RENTAL listings here right now (not sales)? A rising rental-DOM trend means longer vacancies and softer asking-rent achievability than the comps imply.
- What's the recent tenant-quality profile in this submarket — average credit score on applications, eviction rate, late-payment / NSF rate, and stable-employment percentage? A property-management company in the area should have these aggregated.
- How much new for-sale + rental construction is in the pipeline within 1–3 miles? Heavy new supply typically softens prices + rents 12–24 months out; constrained supply supports both.
Investment metrics
- 1% rule
- 1.09% ✓
- Cap rate
- 7.81%
- Cash-on-cash
- 5.43%
- DSCR
- 1.24
- GRM
- 7.7
CMA / ARV
- ARV (on-the-fly)
- $87,010
- Comps found
- 12
Show comp detail 12 sales within ~0.75 mi
| Address | Dist | Beds/Ba | Sqft | Sold | Price | $/sf | Match |
|---|---|---|---|---|---|---|---|
| 2409 S Lowell Ave | 0.17mi | 2/1.0 | 725 (-6%) | 4mo | $120,000 | $166 | 79 |
| 300 W Lenox Ave | 0.38mi | 2/1.0 | 790 (+3%) | 2mo | $67,500 | $85 | 77 |
| 2404 S Whittier Ave | 0.19mi | 2/1.0 | 848 (+10%) | 2mo | $96,000 | $113 | 72 |
| 37 Belle Pl | 0.43mi | 2/1.0 | 808 (+5%) | 2mo | $59,900 | $74 | 70 |
| 70 Bonnie Ct | 0.40mi | 2/1.0 | 720 (-6%) | 10mo | $80,000 | $111 | 62 |
| 1724 S Spring St | 0.48mi | 1/1.0 (-1) | 826 (+7%) | 0mo | $62,000 | $75 | 60 |
| 2605 S College St | 0.39mi | 2/1.0 | 700 (-9%) | 9mo | $80,000 | $114 | 59 |
| 2233 S Spring St | 0.26mi | 2/1.0 | 876 (+14%) | 7mo | $130,000 | $148 | 59 |
| 1637 S Glenwood Ave | 0.52mi | 1/1.0 (-1) | 822 (+7%) | 4mo | $90,000 | $109 | 56 |
| 1512 S State St | 0.64mi | 2/1.0 | 814 (+6%) | 7mo | $95,000 | $117 | 55 |
| 618 W Laurel St | 0.44mi | 2/1.0 | 864 (+12%) | 6mo | $99,500 | $115 | 54 |
| 1812 S 1st St | 0.49mi | 2/1.0 | 672 (-13%) | 10mo | $70,000 | $104 | 48 |
Match score weights: distance 35% · size 25% · config 20% · recency 20%. Top-matched comps best support the ARV.
Projected returns pro-forma
-3.0% appreciation · 6.32% rent growth · sell at horizon
- IRR
- -4.0%
- Equity multiple
- 0.85×
- Total profit
- $-4,050
- Equity at exit
- $13,941
- IRR
- 9.3%
- Equity multiple
- 1.83×
- Total profit
- $21,795
- Equity at exit
- $8,084
Cash invested: $26,180 (down + closing). Projections, not guarantees.
Landlord ↔ Tenant lean methodology
- Overall (STATE)
- 43 Moderately Tenant-Leaning
- State Illinois
- 43 Moderately Tenant-Leaning · D+7
- County
- — inherits STATE
- City
- — inherits STATE
ZIP-level market 62704
- Home prices YoY
- -31.1%
- Rents YoY
- 6.3%
- Active inventory
- 183
- Price-to-rent
- 7.7×
Monthly cashflow live
- Estimated rent
- $1,018 high interval (Pro) →
- Mortgage (P&I)
- −$490
- Tax from tax record
- −$157 /mo · $1,880/yr
- Insurance
- −$39
- HOA
- −$0
- Vacancy / Maint / Mgmt
- −$214
- Net cashflow
- $118
Break-even live
Sensitivity live
| Price | -10% $171 | -5% $145 | +0% $118 | +5% $92 | +10% $66 |
|---|---|---|---|---|---|
| Rent | -10% $38 | -5% $78 | +0% $118 | +5% $159 | +10% $199 |
| Rate | -1.0pp $166 | -0.5pp $142 | base $118 | +0.5pp $94 | +1.0pp $70 |
UW: 25.0% down · 7.5% · 30yr · 1.5% tax · 5.0% vac · 8.0% maint · 8.0% mgmt
Financing live
Cash to close
- Down payment
- $23,375
- Closing costs
- $2,805
- Reserves months
- —
- Total cash needed
- —
Loan-product check · same deal, 3 products live
Conventional
25% down · 7.5% · 30yr
- Down + closing
- —
- Monthly P&I
- —
- Monthly cashflow
- —
- DSCR
- —
- Eligible?
- —
Personal DTI + credit; lowest rate.
DSCR
20% down · 8.5% · 30yr
- Down + closing
- —
- Monthly P&I
- —
- Monthly cashflow
- —
- DSCR
- —
- Eligible?
- —
No personal income docs; deal must DSCR.
Hard money
10% down · 12.0% · 12mo
- Down + closing
- —
- Monthly P&I
- —
- Monthly cashflow
- —
- DSCR
- —
- Eligible?
- —
Short-term bridge; refi at stabilization.
Rent comps 17 comps
| Address | Beds | Baths | Sqft | Rent | $/sqft | DOM | Units | Dist |
|---|---|---|---|---|---|---|---|---|
| 1500 S Lowell Ave Springfield, IL | 1.0 | 1.0 | 590 | $775 | $1.31 | 45d | 1 | 0.60mi |
| 1908 S 4th St Springfield, IL | 1.0 | 1.0 | 800 | $850 | $1.06 | 23d | 1 | 0.60mi |
| 1501 S Spring St Springfield, IL | 2.0 | 1.0 | 1000 | $1,000 | $1.00 | 23d | 1 | 0.65mi |
| 2715 S MacArthur Blvd Unit 01 Springfield, IL | 2.0 | 1.5 | 935 | $975 | $1.04 | 45d | 1 | 0.68mi |
| 604 Bryn Mawr Blvd Springfield, IL | 2.0 | 1.0 | 850 | $1,100 | $1.29 | 45d | 1 | 0.86mi |
| 2257 S 10th St Springfield, IL | 2.0 | 1.0 | 1100 | $1,150 | $1.05 | 45d | 1 | 0.92mi |
| 1600 S 6th St Unit 1 Springfield, IL | 3.0 | 2.0 | 1100 | $1,250 | $1.14 | 23d | 1 | 0.92mi |
| 2328 S 10th St Springfield, IL | 3.0 | 1.0 | 1100 | $1,200 | $1.09 | 45d | 1 | 0.96mi |
| 229 W Allen St Springfield, IL | 3.0 | 1.5 | 1050 | $1,305 | $1.24 | 23d | 1 | 0.96mi |
| 1004 S College St Springfield, IL | 1.0 | 1.0 | 700 | $800 | $1.14 | 23d | 1 | 1.04mi |
| 12 Douglas Ct Springfield, IL | 3.0 | 1.0 | 1000 | $1,300 | $1.30 | 23d | 1 | 1.20mi |
| 423 W Lawrence Ave Unit 2 Springfield, IL | 2.0 | 1.0 | 900 | $1,050 | $1.17 | 23d | 1 | 1.28mi |
| 616 New St Springfield, IL | 1.0 | 1.0 | 550 | $850 | $1.55 | 45d | 1 | 1.35mi |
| 909 S 8th St Unit 4 Springfield, IL | 1.0 | 1.0 | 550 | $800 | $1.45 | 23d | 1 | 1.39mi |
| 417 E Cook St Springfield, IL | 1.0 | 1.0 | 700 | $875 | $1.25 | 45d | 1 | 1.44mi |
| 417 E Cook St Unit A Springfield, IL | 1.0 | 1.0 | 550 | $850 | $1.55 | 23d | 1 | 1.44mi |
| 619 S 5th St Springfield, IL | 1.0 | 1.0 | 750 | $900 | $1.20 | 45d | 1 | 1.46mi |
Listing history 1 events
-
2026-06-17$93,500 Pending
ⓘ Source: listings_history table (triggers on properties + properties_extension) + one-shot
backfill from property_details.listing_events for pre-trigger history.
Tax reassessment forecast IL · Partial reset (capped growth)
- Current annual tax
- $1,880 · $157/mo
- Projected year-2 tax
- $2,001 · $167/mo
- Expected delta
- +$121/yr (+$10/mo · 6.5%)
ⓘ Screening estimate from a state-policy table — verify with the county assessor before closing.
Climate risk First Street
- Flood 4/10 Moderate FEMA zone X (unshaded) · 21% chance over 30 yrs
- Wildfire 1/10 Low
- Heat 4/10 Moderate 7 d/yr ≥105°F today · 20 d/yr by 30 yrs out
- Wind 2/10 Low 100% chance of damaging wind over 30 yrs
- Air quality 2/10 Low 1 unhealthy d/yr today · 2 by 30 yrs out
Nearby sold comps map
Loading sold comps map…
Walkable amenities ~0.75 mi
Loading nearby amenities…
Taxation est. · year 1
- Rental income
- $12,219
- − Mortgage interest
- −$5,237
- − Property taxes
- −$1,880
- − Insurance
- −$468
- − Repairs & maintenance
- −$978
- − Management
- −$978
- − Depreciation
- −$2,720
- Taxable loss
- −$41
- Est. tax savings @ 24.0%
- +$10
- After-tax cash flow
- $1,432/yr
For passive investors: Depreciation is non-cash, so a rental often shows a tax loss while cash-flowing — sheltering income. Rental losses are passive: they offset passive income freely, and up to $25,000/yr can offset ordinary (W-2) income if you actively participate and your MAGI is under $100k (phasing out to $0 by $150k); unused losses carry forward. On sale, claimed depreciation is recaptured at up to 25%, and gains may owe capital-gains tax (a 1031 exchange can defer both). Figures are a year-1 estimate at your 24.0% rate — not tax advice; consult a CPA.
Schools (NCES district)
- District
- Springfield SD 186
- NCES district ID
- 1737080
- Math proficiency
- 17% ▼ -7.00%
- Reading proficiency
- 22% ▼ -5.00%
- Median HH income
- $43,744
- Composite
- 16.89/100
- National rank
- #9142
- State rank
- #438 of 620 in IL
Livability — Springfield
- Score
- 79/100
- State rank
- #122
- US rank
- #2138
Category grades
Schools grade is shown separately in the Schools card above.
Census & demographics
- Census place
- Springfield, IL
- County
- Sangamon County · 115,414 people
- City population
- 59,955
- Metro
- Springfield, IL
- Population (ZIP)
- 40,046
- Household income
- $69,976
- Rent vs Own
- Severe rent burden
- 1529.0
Population outlook (Sangamon County) Hauer SSP2
- Today (2025)
- 198,317 people
- By 2030
- 196,127 · -1.1%
- By 2040
- 188,664 · -4.9%
- By 2050
- 179,624 · -9.4%
- By 2075
- 155,027 · -21.8%
- By 2100
- 122,588 · -38.2%
Race, ethnicity, and origin ACS 2023
- Neighborhood character
- Predominantly White (74%)
- Race & ethnicity
- White 74% Black 15% Two or more races 5% Hispanic / Latino 4% Asian 4%
- Common ancestry
- Lithuanian 2% Romanian 2% Slovak 2%
- Foreign-born
- 6% · Canada, China, Vietnam
- Languages at home
- 92% English-only · Spanish 2% Other Indo-European 1% Tagalog/Filipino 1%
Political lean MEDSL · Sangamon
- 2024 margin
- Toss-up / Even · D 46.6% · R 51.6% · Other 1.8%
- 2008→2024 swing
- -9.3pp toward R · 2008: 4.4pp · 2024: -5.0pp
- All cycles
- 2024: R+5.0 2020: R+4.4 2016: R+9.4 2012: R+8.7 2008: D+4.4
Not yet ingested
- Civics
- —
Market trends
- HPI YoY
- ▼ -70.79%
- Current HPI
- 156.7086
- Rent YoY
- ▲ 6.32%
- Metro
- Springfield, IL
- State GDP YoY
- ▲ 1.59%
- F500 in state
- 60
Industry mix (Fortune 500 HQ in IL)
| Industry | F500 HQs | Revenue |
|---|---|---|
| Insurance | 4 | $201B |
|
||
| Consumer Goods | 4 | $87B |
|
||
| Industrial Machinery | 3 | $64B |
|
||
| Healthcare | 2 | $55B |
|
||
| Retail / Pharmacy | 1 | $148B |
|
||
| Agriculture / Food | 1 | $86B |
|
||
Price history
+10.0% since first listed17 events — show timeline
- 2026-06-16 Listed $93,500 RMLSA as Distributed by MLS Grid
- 2026-06-16 Listing Removed — RMLSA as Distributed by MLS Grid
- 2023-08-22 Sold (Public Records) $70,000 Public Records
- 2023-08-21 Sold (MLS) $70,000 RMLSA as Distributed by MLS Grid
- 2023-07-10 Pending — RMLSA as Distributed by MLS Grid
- 2023-07-05 Relisted — RMLSA as Distributed by MLS Grid
- 2023-05-31 Contingent — RMLSA as Distributed by MLS Grid
- 2023-05-01 Listed $74,950 RMLSA as Distributed by MLS Grid
- 2021-08-06 Listing Removed — RMLSA as Distributed by MLS Grid
- 2021-08-06 Listing Removed — RMLSA as Distributed by MLS Grid
- 2008-06-30 Sold (Public Records) $72,500 Public Records
- 2008-06-05 Sold (MLS) $72,500 RMLSA as Distributed by MLS Grid
- 2008-04-09 Listed $72,900 RMLSA as Distributed by MLS Grid
- 2005-10-05 Sold (Public Records) $68,000 Public Records
- 2005-09-30 Sold (MLS) $67,800 RMLSA as Distributed by MLS Grid
- 2005-08-23 Listed $69,900 RMLSA as Distributed by MLS Grid
- 1998-12-15 Sold (Public Records) $85,000 Public Records
Property tax history
+1.7%/yrLatest (2025): $1,880 · +5.3% YoY. Source: county tax records.
Cash-flow waterfall
monthlySold comps — $/sqft
last 12 mo · ≤1 miLoading sold comps…