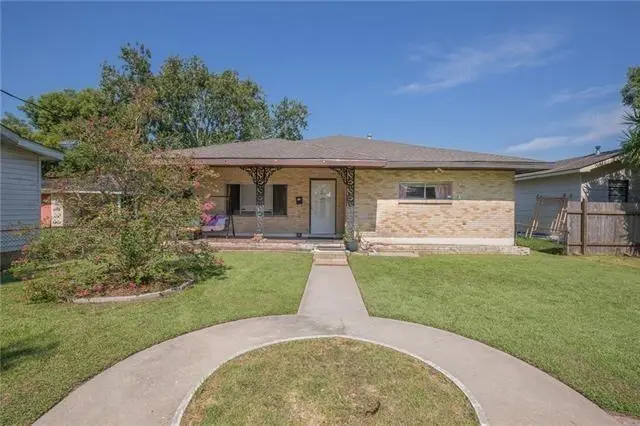
618 Avenue H Ave · Westwego, LA
Flood risk No data
- FEMA flood zone
- —
- Chance of flooding over 30 yrs
- —
- Est. flood insurance / yr
- —
Fire risk No data
- Est. fire insurance / yr
- —
Heat risk No data
- Hot days now (above threshold)
- —
- Hot days in 30 yrs
- —
Wind risk No data
- Chance of severe wind over 30 yrs
- —
Air-quality risk No data
- Unhealthy air days now
- —
- Unhealthy air days in 30 yrs
- —
Risk factors via First Street. Map © Google.
Why this score? — see what drove the B grade
The composite is a weighted blend of 9 inputs, each scored 0–100. Each bar is that input's sub-score; the figure is the points it added to the 100-point composite (weight × sub-score).
- Cash flow +28.6/30.0
- ARV discount +15.0/15.0
- DSCR +10.0/10.0
- 1% rule +7.1/10.0
- Livability +3.4/5.0
- Schools +2.5/10.0
- Condition / age +2.5/5.0
- Rent growth +2.3/5.0
- Appreciation +0.0/10.0
$150,000
🖨 Deal sheet 📄 Offer letter ✓ Due diligence
Listing remarks MLS
Welcome to this inviting 3bd/2ba home in the heart of Westwego. This home features a large open floor concept with tons of natural light. The living area flows seamlessly into the kitchen, making it great for entertaining or simply enjoying day-to-day living. The roof is just 2 years old and the HVAC system is only 1 year old, ensuring comfort and efficiency throughout the seasons. This home is a blank canvas, waiting for you to add your cosmetic touches and make it uniquely yours. Schedule your appointment today.
Key facts
- Open floor concept
- Natural light
- Large kitchen
Tags
Neighborhood map
What this means for you Summary
Snapshot
- This is a 3-bed/2.0-bath single-family listed at $150k.
Deal economics
- At list price, monthly cash flow is $497 ($6k/yr) — positive.
- The deal already cash-flows at list — no discount required.
- Meets the 1% rule at list price ($2k rent vs $150k).
- Recommended offer: $132k (12.0% below list) — sets the bar for market timing.
- Cap rate 10.3% vs local median 6.5% in Westwego — top-decile yield for the area; either an underpriced asset or a hidden risk that comps aren't pricing in. Stress-test before assuming the spread holds.
Location & tenants
- Location reads 68/100 on livability (#97 in LA) — a middle-class / working-renter tenant base. Strengths: cost of living A+, health & safety A+; Watch: schools C-, crime D, amenities D-.
- Jefferson Parish (suburban): math 24% / reading 34% proficiency, ranked #44 of 98 in LA (top 45%) — low school quality limits family demand, transient renter base, plan for 1-2y turnover; 70% free/reduced lunch — lower-income household profile, screen leases tightly.
- Market conditions: Rents soft (-0.8%/yr); 186 active listings in the ZIP; 9 comparable units currently listed for rent nearby; rentals at typical pace (median 24d on market — plan ~3-4 weeks tenant-placement turnaround); 518 units permitted in Jefferson Parish in 2024 (43 in 5+ unit buildings).
- This rent runs 41% of the median local income ($54k/yr) — at the standard rent-burdened threshold; future hikes will face affordability resistance.
Forward outlook
- Local home prices are declining (-3.0%/yr); year-one equity from $1k of loan paydown is wiped out by about $4k of value loss. Plan a longer hold.
Negotiation context
- It's been on market 137 days — a 12% lower offer ($132k) is reasonable based on typical stale-listing flexibility.
- 12 sale attempts since 16y ago with the ask held roughly flat each time — persistent listings suggest the price (not the market) is what's stuck; bring a comps-based counter.
- Current owner paid $78k; list at $150k implies a 92% gain — meaningful room to come down on a strong offer.
Questions for the listing agent
- It's been on market 137 days. Have you received any prior offers? Is the seller open to a 12% concession, seller financing, or rate buy-down credit?
- Built in 1960 — when were the roof, HVAC, electrical panel, plumbing, and water heater last replaced?
- Why hasn't it sold? Are there any deal-killer items the seller is aware of (foundation, flood, title, zoning, code violations)?
- Is there a deadline driving the sale (1031 exchange, divorce, estate, relocation)? That informs how much negotiation room exists.
- Crime grade is D in this area — have there been break-ins, vandalism, or insurance claims at this property in the last 3 years? What carrier currently insures it and at what premium?
- What's the average days-on-market for RENTAL listings here right now (not sales)? A rising rental-DOM trend means longer vacancies and softer asking-rent achievability than the comps imply.
- What's the recent tenant-quality profile in this submarket — average credit score on applications, eviction rate, late-payment / NSF rate, and stable-employment percentage? A property-management company in the area should have these aggregated.
- How much new for-sale + rental construction is in the pipeline within 1–3 miles? Heavy new supply typically softens prices + rents 12–24 months out; constrained supply supports both.
Investment metrics
- 1% rule
- 1.21% ✓
- Cap rate
- 10.27%
- Cash-on-cash
- 14.20%
- DSCR
- 1.63
- GRM
- 6.9
CMA / ARV
- ARV (median comp)
- $217,554
- List price
- $150,000
- Delta
- -31.05%
- Verdict
- UNDERPRICED
- Comps
- 20 within 1.0 mi
Show comp detail 11 sales within ~0.75 mi
| Address | Dist | Beds/Ba | Sqft | Sold | Price | $/sf | Match |
|---|---|---|---|---|---|---|---|
| 927 Cedre Dr | 0.24mi | 3/2.0 | 1,801 (+1%) | 18mo | $187,000 | $104 | 72 |
| 718 West Dr | 0.25mi | 4/2.0 (+1) | 1,827 (+3%) | 10mo | $275,000 | $151 | 71 |
| 714 West Dr | 0.25mi | 3/1.0 | 1,600 (-10%) | 3mo | $55,000 | $34 | 65 |
| 1175 Avenue C | 0.72mi | 3/2.0 | 1,800 (+1%) | 2mo | $180,000 | $100 | 63 |
| 855 1/2 Avenue D Ave | 0.24mi | 3/2.0 | 1,947 (+9%) | 18mo | $145,000 | $74 | 58 |
| 628 Keller Ave | 0.35mi | 3/2.0 | 1,700 (-4%) | 22mo | $235,000 | $138 | 58 |
| 801 Central Ave | 0.36mi | 4/2.0 (+1) | 1,741 (-2%) | 21mo | $233,000 | $134 | 57 |
| 802 Avenue B Ave | 0.38mi | 4/2.0 (+1) | 1,700 (-4%) | 22mo | $175,000 | $103 | 51 |
| 440 Klein St | 0.52mi | 4/2.0 (+1) | 1,835 (+3%) | 21mo | $220,000 | $120 | 49 |
| 533 Chipley St | 0.43mi | 3/2.5 | 2,020 (+13%) | 15mo | $240,000 | $119 | 43 |
| 7817 Alma St | 0.74mi | 4/2.0 (+1) | 1,584 (-11%) | 12mo | $205,000 | $129 | 32 |
Match score weights: distance 35% · size 25% · config 20% · recency 20%. Top-matched comps best support the ARV.
Projected returns pro-forma
-3.0% appreciation · 0.0% rent growth · sell at horizon
- IRR
- 1.3%
- Equity multiple
- 1.05×
- Total profit
- $1,983
- Equity at exit
- $22,365
- IRR
- 7.8%
- Equity multiple
- 1.52×
- Total profit
- $21,767
- Equity at exit
- $12,969
Cash invested: $42,000 (down + closing). Projections, not guarantees.
Landlord ↔ Tenant lean methodology
- Overall (STATE)
- 90 Strongly Landlord-Friendly
- State Louisiana
- 90 Strongly Landlord-Friendly · R+12
- County
- — inherits STATE
- City
- — inherits STATE
ZIP-level market 70094
- Rents YoY
- -0.8%
- Active inventory
- 186
- Price-to-rent
- 6.9×
Monthly cashflow live
- Estimated rent
- $1,817 high interval (Pro) →
- Mortgage (P&I)
- −$787
- Tax from tax record
- −$89 /mo · $1,072/yr
- Insurance
- −$62
- HOA
- −$0
- Vacancy / Maint / Mgmt
- −$382
- Net cashflow
- $497
Break-even live
UW: 25.0% down · 7.5% · 30yr · 1.5% tax · 5.0% vac · 8.0% maint · 8.0% mgmt
Financing live
Cash to close
- Down payment
- $37,500
- Closing costs
- $4,500
- Reserves months
- —
- Total cash needed
- —
Loan-product check · same deal, 3 products live
Conventional
25% down · 7.5% · 30yr
- Down + closing
- —
- Monthly P&I
- —
- Monthly cashflow
- —
- DSCR
- —
- Eligible?
- —
Personal DTI + credit; lowest rate.
DSCR
20% down · 8.5% · 30yr
- Down + closing
- —
- Monthly P&I
- —
- Monthly cashflow
- —
- DSCR
- —
- Eligible?
- —
No personal income docs; deal must DSCR.
Hard money
10% down · 12.0% · 12mo
- Down + closing
- —
- Monthly P&I
- —
- Monthly cashflow
- —
- DSCR
- —
- Eligible?
- —
Short-term bridge; refi at stabilization.
Rent comps 9 comps
| Address | Beds | Baths | Sqft | Rent | $/sqft | DOM | Units | Dist |
|---|---|---|---|---|---|---|---|---|
| 181 Louisiana St Westwego, LA | 4.0 | 2.0 | 1500 | $1,550 | $1.03 | 44d | 1 | 0.51mi |
| 525 Emile Ave Westwego, LA | 3.0 | 2.0 | 1329 | $800 | $0.60 | 23d | 1 | 0.68mi |
| 653 Vic a Pitre Dr Westwego, LA | 3.0 | 2.0 | 1491 | $2,200 | $1.48 | 4d | 1 | 0.71mi |
| 1233 Central Ave Westwego, LA | 3.0 | 1.5 | 1357 | $1,500 | $1.11 | 23d | 1 | 0.74mi |
| 1226 Kenny Dr Westwego, LA | 4.0 | 2.0 | 1300 | $1,650 | $1.27 | 23d | 1 | 0.91mi |
| 1029 Joyce St Marrero, LA | 3.0 | 2.0 | 1300 | $1,650 | $1.27 | 14d | 1 | 0.97mi |
| 569 Magnolia Dr Marrero, LA | 2.0 | 1.5 | 1450 | $1,500 | $1.03 | 44d | 1 | 1.08mi |
| 22 Gladiola Ct Marrero, LA | 3.0 | 2.0 | 1933 | $2,200 | $1.14 | 44d | 1 | 1.35mi |
| 6035 Tchoupitoulas St New Orleans, LA | 3.0 | 2.0 | 2592 | $3,750 | $1.45 | 23d | 1 | 1.40mi |
Listing history 39 events
-
2026-06-18days on market $150,000 Active 137 DOM
-
2026-06-17days on market $150,000 Active 136 DOM
-
2026-06-16days on market $150,000 Active 135 DOM
-
2026-06-15days on market $150,000 Active 134 DOM
-
2026-06-13days on market $150,000 Active 132 DOM
-
2026-06-10days on market $150,000 Active 129 DOM
-
2026-06-09days on market $150,000 Active 128 DOM
-
2026-06-08days on market $150,000 Active 127 DOM
-
2026-06-07days on market $150,000 Active 126 DOM
-
2026-06-03days on market $150,000 Active 122 DOM
-
2026-06-02days on market $150,000 Active 121 DOM
-
2026-06-01days on market $150,000 Active 120 DOM
-
2026-05-31days on market $150,000 Active 119 DOM
-
2026-02-01$150,000 Active 519-char remark
Show marketing remark (519 chars)
Welcome to this inviting 3bd/2ba home in the heart of Westwego. This home features a large open floor concept with tons of natural light. The living area flows seamlessly into the kitchen, making it great for entertaining or simply enjoying day-to-day living. The roof is just 2 years old and the HVAC system is only 1 year old, ensuring comfort and efficiency throughout the seasons. This home is a blank canvas, waiting for you to add your cosmetic touches and make it uniquely yours. Schedule your appointment today.
-
2025-08-01$155,000 Active
-
2025-01-31$158,000 Active
-
2024-09-27price $160,000
-
2024-08-28$160,000 Active
-
2024-08-01historical
-
2024-07-09price $175,000
-
2024-07-06price $173,000
-
2024-05-15price $177,000
-
2024-05-01price $182,000
-
2024-03-10price $185,000
-
2024-02-10price $187,000
-
2024-01-03status Active
-
2024-01-01historical
-
2023-11-06price $190,000
-
2023-09-18price $205,000
-
2023-08-26$215,000 Active
-
2023-08-26$175,000
-
2012-02-13soldstatus $78,000
-
2012-02-10soldstatus $78,000
-
2011-06-20$80,000
-
2011-06-20$80,000
-
2010-11-22$110,000
-
2010-11-22$110,000
-
1980-06-01soldstatus $55,000
ⓘ Source: listings_history table (triggers on properties + properties_extension) + one-shot
backfill from property_details.listing_events for pre-trigger history.
Tax reassessment forecast LA · Resets to sale price
- Current annual tax
- $1,072 · $89/mo
- Projected year-2 tax
- $1,072 · $89/mo
- Expected delta
- $0/yr ($0/mo · 0.0%)
ⓘ Screening estimate from a state-policy table — verify with the county assessor before closing.
Nearby sold comps map
Loading sold comps map…
Walkable amenities ~0.75 mi
Loading nearby amenities…
Taxation est. · year 1
- Rental income
- $21,802
- − Mortgage interest
- −$8,402
- − Property taxes
- −$1,072
- − Insurance
- −$750
- − Repairs & maintenance
- −$1,744
- − Management
- −$1,744
- − Depreciation
- −$4,364
- Taxable income
- $3,726
- Est. tax owed @ 24.0%
- −$894
- After-tax cash flow
- $5,068/yr
For passive investors: Depreciation is non-cash, so a rental often shows a tax loss while cash-flowing — sheltering income. Rental losses are passive: they offset passive income freely, and up to $25,000/yr can offset ordinary (W-2) income if you actively participate and your MAGI is under $100k (phasing out to $0 by $150k); unused losses carry forward. On sale, claimed depreciation is recaptured at up to 25%, and gains may owe capital-gains tax (a 1031 exchange can defer both). Figures are a year-1 estimate at your 24.0% rate — not tax advice; consult a CPA.
Schools (NCES district)
- District
- Jefferson Parish
- NCES district ID
- 2200840
- Math proficiency
- 24% ▼ -36.00%
- Reading proficiency
- 34% ▼ -30.00%
- Median HH income
- $48,421
- Composite
- 25.19/100
- National rank
- #7511
- State rank
- #44 of 98 in LA
Livability — Westwego
- Score
- 68/100
- State rank
- #97
- US rank
- #9851
Category grades
Schools grade is shown separately in the Schools card above.
Census & demographics
- Census place
- Westwego, LA
- County
- Jefferson Parish · 426,999 people
- City population
- 32,130
- Metro
- New Orleans-Metairie, LA
- Population (ZIP)
- 32,130
- Household income
- $53,597
- Rent vs Own
- Severe rent burden
- 1457.0
Population outlook (Jefferson County) Hauer SSP2
- Today (2025)
- 451,696 people
- By 2030
- 455,451 · +0.8%
- By 2040
- 458,308 · +1.5%
- By 2050
- 461,031 · +2.1%
- By 2075
- 476,351 · +5.5%
- By 2100
- 499,377 · +10.6%
Race, ethnicity, and origin ACS 2023
- Neighborhood character
- Diverse neighborhood (Simpson 0.65)
- Race & ethnicity
- Black 46% White 36% Hispanic / Latino 13% Two or more races 6% Asian 2%
- Hispanic origin (detail)
- Mexican 2% Dominican 2%
- Common ancestry
- Lithuanian 9% Scottish 1%
- Foreign-born
- 8% · Canada, Vietnam
- Languages at home
- 86% English-only · Spanish 11% Vietnamese 2% French/Haitian/Cajun 1%
Political lean MEDSL · Jefferson
- 2024 margin
- R (+12.9) · D 42.5% · R 55.5% · Other 2.1%
- 2008→2024 swing
- +13.6pp toward D · 2008: -26.6pp · 2024: -12.9pp
- All cycles
- 2024: R+12.9 2020: R+11.1 2016: R+14.8 2012: R+18.4 2008: R+26.6
Not yet ingested
- Civics
- —
Market trends
- HPI YoY
- ▼ -111.56%
- Current HPI
- 102.9992
- Rent YoY
- ▼ -0.80%
- Metro
- New Orleans-Metairie, LA
- State GDP YoY
- ▲ 3.29%
- F500 in state
- 10
Industry mix (Fortune 500 HQ in LA)
| Industry | F500 HQs | Revenue |
|---|---|---|
| Telecommunications | 2 | $23B |
|
||
| Utilities | 1 | $12B |
|
||
| Wholesale / Distribution | 1 | $5B |
|
||
| Advertising | 1 | $2B |
|
||
Price history
+172.7% since first listed26 events — show timeline
- 2026-02-01 Listed $150,000 GSREIN
- 2026-02-01 Listed $150,000 AcadianaMLS
- 2025-08-01 Listed $155,000 AcadianaMLS
- 2025-01-31 Listed $158,000 AcadianaMLS
- 2024-09-27 Price Changed $160,000 GSREIN
- 2024-08-28 Listed $160,000 AcadianaMLS
- 2024-08-01 Delisted — GBRMLS
- 2024-07-09 Price Changed $175,000 GBRMLS
- 2024-07-06 Price Changed $173,000 GBRMLS
- 2024-05-15 Price Changed $177,000 GBRMLS
- 2024-05-01 Price Changed $182,000 GBRMLS
- 2024-03-10 Price Changed $185,000 GBRMLS
- 2024-02-10 Price Changed $187,000 GBRMLS
- 2024-01-03 Relisted — GBRMLS
- 2024-01-01 Delisted — GBRMLS
- 2023-11-06 Price Changed $190,000 GBRMLS
- 2023-09-18 Price Changed $205,000 GBRMLS
- 2023-08-26 Listed $175,000 AcadianaMLS
- 2023-08-26 Listed $215,000 GBRMLS
- 2012-02-13 Sold (Public Records) $78,000 Public Records
- 2012-02-10 Sold (MLS) $78,000 GSREIN
- 2011-06-20 Listed $80,000 AcadianaMLS
- 2011-06-20 Listed $80,000 GSREIN
- 2010-11-22 Listed $110,000 GSREIN
- 2010-11-22 Listed $110,000 AcadianaMLS
- 1980-06-01 Sold (Public Records) $55,000 Public Records
Property tax history
+4.1%/yrLatest (2025): $1,072 · -0.2% YoY. Source: county tax records.
Cash-flow waterfall
monthlySold comps — $/sqft
last 12 mo · ≤1 miLoading sold comps…