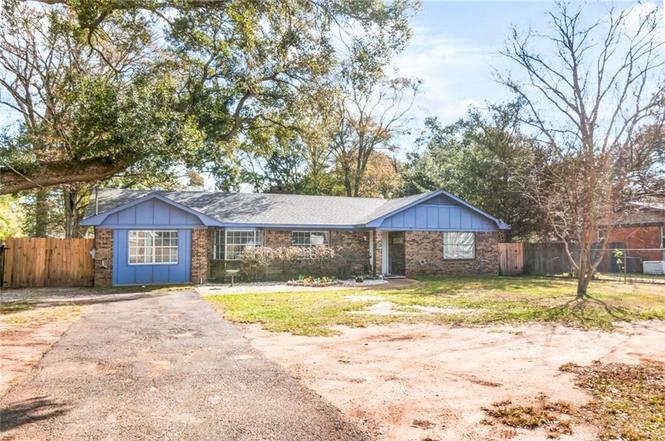
5505 Mcdonald Rd · Tillmans Corner, AL
Flood risk 1/10 · Minimal
- FEMA flood zone
- X (unshaded)
- Chance of flooding over 30 yrs
- 0.0%
- Est. flood insurance / yr
- $507 – $1,088
Fire risk 6/10 · Moderate
- Est. fire insurance / yr
- $916 – $1,700
Heat risk 9/10 · Severe
- Hot days now (above 105°F)
- 7 days/yr
- Hot days in 30 yrs
- 21 days/yr
Wind risk 9/10 · Severe
- Chance of severe wind over 30 yrs
- 99.0%
Air-quality risk 1/10 · Minimal
- Unhealthy air days now
- 0 days/yr
- Unhealthy air days in 30 yrs
- 0 days/yr
Risk factors via First Street. Map © Google.
Why this score? — see what drove the C grade
The composite is a weighted blend of 9 inputs, each scored 0–100. Each bar is that input's sub-score; the figure is the points it added to the 100-point composite (weight × sub-score).
- Cash flow +22.6/30.0
- ARV discount +15.0/15.0
- DSCR +7.2/10.0
- 1% rule +4.7/10.0
- Livability +3.1/5.0
- Rent growth +2.5/5.0
- Condition / age +2.5/5.0
- Schools +2.3/10.0
- Appreciation +0.0/10.0
$179,194
🖨 Deal sheet (PDF) 📄 Offer letter ✓ Due diligence
Listing remarks MLS
Well maintained brick beauty. 4/3 w/ open floor plan split, perfect for Inlaw. Ceramic tile in kitchen & baths. 12x20 covered porch. All appliances convey incl fridge, washer, dryer & new range. Workshop 11x16 w/ attached dbl carport. New roof 2008. Fenced. All furnishings convey. USDA eligible for 100% financing.
Key facts
- Large living area
- Formal dining room
- Large breakfast bar
Tags
Property features AI
Exterior
- Parking: Driveway
- Utilities: Cable available; Electricity available; Phone available; Sewer available (septic tank); Water available
- Home design: Single-family residence; Residential property; Built in 1975; Shingle roof
- Construction: Brick (four sides) construction; No listed foundation details
- Exterior features: Garden; Exterior lighting; Outdoor storage (shed); Fenced backyard with privacy wood fencing; View
Interior
- Kitchen: Electric range; Refrigerator
- Bedrooms: 4 bedrooms
- Flooring: Carpet; Ceramic tile; Laminate
- Bathrooms: 3 full bathrooms
- Heating & cooling: Central heating (electric); Central air conditioning; Ceiling fans
- Interior features: Double vanity; Fireplace (brick surround) with wood-burning stove in living room; Bay windows; Breakfast bar, white cabinets, eat-in kitchen with view to family room; Separate dining room; Double master bedroom
- Laundry & utility: 220-volt electric service (suitable for large appliances)
Neighborhood map
What this means for you Summary
Snapshot
- This is a 4-bed/2.0-bath single-family listed at $179k.
Deal economics
- At list price, monthly cash flow is $304 ($4k/yr) — positive.
- The deal already cash-flows at list — no discount required.
- To meet the 1% rule (rent ≥ 1% of price), the offer needs to be $173k (3.2% below list).
- Recommended offer: $168k (6.0% below list) — sets the bar for market timing.
- Cap rate 8.3% vs local median 5.1% in Tillmans Corner — top-decile yield for the area; either an underpriced asset or a hidden risk that comps aren't pricing in. Stress-test before assuming the spread holds.
Location & tenants
- Location reads 61/100 on livability (#260 in AL) — a middle-class / working-renter tenant base. Strengths: cost of living A+, housing A+; Watch: crime D+, amenities F, commute F.
- Mobile County (urban): math 15% / reading 39% proficiency, ranked #81 of 129 in AL (top 63%) — low school quality limits family demand, transient renter base, plan for 1-2y turnover; 67% free/reduced lunch — lower-income household profile, screen leases tightly.
- Zoned schools: Pearl Haskew Elementary (math 22% / reading 47%, grade F, #296 of 627 statewide, top 49%, 502 students, 68% FRL); Theodore High School (math 10% / reading 12%, grade F, #247 of 305 statewide, top 81%, 1,280 students, 60% FRL) — zoned schools at 64% FRL track the district average.
- Market conditions: 253 active listings in the ZIP; 1 comparable units currently listed for rent nearby; 1,678 units permitted in Mobile County in 2024 (264 in 5+ unit buildings).
- This rent runs 32% of the median local income ($65k/yr) — at the standard rent-burdened threshold; future hikes will face affordability resistance.
Forward outlook
- Local home prices are declining (-3.0%/yr); year-one equity from $1k of loan paydown is wiped out by about $5k of value loss. Plan a longer hold.
- Mobile County population projected to shrink 8% by 2050 — rents likely to lag national; underwrite the cash flow, not the appreciation.
Negotiation context
- It's been on market 63 days — a 6% lower offer ($168k) is reasonable based on typical stale-listing flexibility.
- 3 sale attempts since 12y ago; this cycle's ask has dropped $16k (8%) from the opening price — seller is motivated, your offer sets the floor, not the list.
- Current owner paid $114k; list at $179k implies a 57% gain — meaningful room to come down on a strong offer.
Risks & watch-outs
- Climate carrying-cost: severe wind risk, 99% chance of damaging wind over 30y; major wildfire risk; extreme-heat days projected 7→21/yr by 2055 (HVAC capex compounding) — expect insurance premiums to compound above CPI over the hold.
Questions for the listing agent
- It's been on market 63 days. Have you received any prior offers? Is the seller open to a 6% concession, seller financing, or rate buy-down credit?
- Built in 1975 — when were the roof, HVAC, electrical panel, plumbing, and water heater last replaced?
- Why hasn't it sold? Are there any deal-killer items the seller is aware of (foundation, flood, title, zoning, code violations)?
- Is there a deadline driving the sale (1031 exchange, divorce, estate, relocation)? That informs how much negotiation room exists.
- Schools are F-rated, which usually means shorter tenancies and higher turnover. Who's the typical renter profile here, and what's been the actual vacancy rate?
- Crime grade is D in this area — have there been break-ins, vandalism, or insurance claims at this property in the last 3 years? What carrier currently insures it and at what premium?
- What's the average days-on-market for RENTAL listings here right now (not sales)? A rising rental-DOM trend means longer vacancies and softer asking-rent achievability than the comps imply.
- What's the recent tenant-quality profile in this submarket — average credit score on applications, eviction rate, late-payment / NSF rate, and stable-employment percentage? A property-management company in the area should have these aggregated.
- How much new for-sale + rental construction is in the pipeline within 1–3 miles? Heavy new supply typically softens prices + rents 12–24 months out; constrained supply supports both.
Investment metrics
- 1% rule
- 0.97% ✗
- Cap rate
- 8.33%
- Cash-on-cash
- 7.27%
- DSCR
- 1.32
- GRM
- 8.6
CMA / ARV
- ARV (on-the-fly)
- $223,447
- Comps found
- 9
Show comp detail 9 sales within ~0.75 mi
| Address | Dist | Beds/Ba | Sqft | Sold | Price | $/sf | Match |
|---|---|---|---|---|---|---|---|
| 8561 Lincoln Downs Dr E | 0.15mi | 3/2.0 (-1) | 1,692 (+4%) | 1mo | $232,000 | $137 | 81 |
| 5470 Robert Jefferson Dr E | 0.11mi | 3/2.5 (-1) | 1,760 (+8%) | 7mo | $144,000 | $82 | 69 |
| 8475 Holloway Dr N | 0.21mi | 4/2.0 | 1,800 (+10%) | 19mo | $155,000 | $86 | 57 |
| 8179 Cheyenne St S | 0.64mi | 3/2.0 (-1) | 1,713 (+5%) | 2mo | $200,000 | $117 | 55 |
| 5160 Cheyenne St W | 0.55mi | 3/2.0 (-1) | 1,718 (+5%) | 12mo | $247,000 | $144 | 51 |
| 5380 Ruger Ct | 0.54mi | 3/2.5 (-1) | 1,593 (-2%) | 17mo | $205,000 | $129 | 50 |
| 8189 Cheyenne St S | 0.63mi | 3/2.0 (-1) | 1,480 (-9%) | 4mo | $241,800 | $163 | 47 |
| 5199 Cheyenne Ct | 0.51mi | 3/2.0 (-1) | 1,480 (-9%) | 12mo | $240,000 | $162 | 46 |
| 8017 Beretta Dr | 0.65mi | 4/2.0 | 1,875 (+15%) | 19mo | $275,000 | $147 | 29 |
Match score weights: distance 35% · size 25% · config 20% · recency 20%. Top-matched comps best support the ARV.
Projected returns pro-forma
-3.0% appreciation · 3.0% rent growth · sell at horizon
- IRR
- -5.2%
- Equity multiple
- 0.81×
- Total profit
- $-9,762
- Equity at exit
- $26,718
- IRR
- 4.4%
- Equity multiple
- 1.32×
- Total profit
- $16,097
- Equity at exit
- $15,493
Cash invested: $50,174 (down + closing). Projections, not guarantees.
Landlord ↔ Tenant lean methodology
- Overall (STATE)
- 90 Strongly Landlord-Friendly
- State Alabama
- 90 Strongly Landlord-Friendly · R+15
- County
- — inherits STATE
- City
- — inherits STATE
ZIP-level market 36582
- Home prices YoY
- -19.1%
- Active inventory
- 253
- Price-to-rent
- 8.6×
Monthly cashflow live
- Estimated rent
- $1,734 medium interval (Pro) →
- Mortgage (P&I)
- −$940
- Tax from tax record
- −$51 /mo · $618/yr
- Insurance
- −$75
- HOA
- −$0
- Vacancy / Maint / Mgmt
- −$364
- Net cashflow
- $304
Break-even live
Sensitivity live
| Price | -10% $405 | -5% $355 | +0% $304 | +5% $253 | +10% $202 |
|---|---|---|---|---|---|
| Rent | -10% $167 | -5% $235 | +0% $304 | +5% $372 | +10% $441 |
| Rate | -1.0pp $394 | -0.5pp $349 | base $304 | +0.5pp $257 | +1.0pp $210 |
UW: 25.0% down · 7.5% · 30yr · 1.5% tax · 5.0% vac · 8.0% maint · 8.0% mgmt
Financing live
Cash to close
- Down payment
- $44,798
- Closing costs
- $5,376
- Reserves months
- —
- Total cash needed
- —
Loan-product check · same deal, 3 products live
Conventional
25% down · 7.5% · 30yr
- Down + closing
- —
- Monthly P&I
- —
- Monthly cashflow
- —
- DSCR
- —
- Eligible?
- —
Personal DTI + credit; lowest rate.
DSCR
20% down · 8.5% · 30yr
- Down + closing
- —
- Monthly P&I
- —
- Monthly cashflow
- —
- DSCR
- —
- Eligible?
- —
No personal income docs; deal must DSCR.
Hard money
10% down · 12.0% · 12mo
- Down + closing
- —
- Monthly P&I
- —
- Monthly cashflow
- —
- DSCR
- —
- Eligible?
- —
Short-term bridge; refi at stabilization.
Rent comps 1 comps
| Address | Beds | Baths | Sqft | Rent | $/sqft | DOM | Units | Dist |
|---|---|---|---|---|---|---|---|---|
| 4734 Clarendon Dr Mobile, AL | 3.0 | 1.0 | 1168 | $1,195 | $1.02 | 45d | 1 | 1.23mi |
Listing history 12 events
-
2026-05-31status $179,194 Pending 63 DOM
-
2026-05-30days on market $179,194 Active 63 DOM
-
2026-04-22status Pending
-
2026-04-10price $179,194
-
2026-03-23status Active
-
2026-03-16status Pending
-
2026-02-28price $189,209
-
2026-02-13$195,000 Active
-
2019-05-09soldstatus $114,136
-
2015-02-12soldstatus $86,701
-
2015-01-19soldstatus $86,000 327-char remark
Show marketing remark (327 chars)
Well maintained brick beauty. 4/3 w/ open floor plan split, perfect for Inlaw. Ceramic tile in kitchen & baths. 12x20 covered porch. All appliances convey incl fridge, washer, dryer & new range. Workshop 11x16 w/ attached dbl carport. New roof 2008. Fenced. All furnishings convey. USDA eligible for 100% financing.
-
2014-06-17$87,000 327-char remark
Show marketing remark (327 chars)
Well maintained brick beauty. 4/3 w/ open floor plan split, perfect for Inlaw. Ceramic tile in kitchen & baths. 12x20 covered porch. All appliances convey incl fridge, washer, dryer & new range. Workshop 11x16 w/ attached dbl carport. New roof 2008. Fenced. All furnishings convey. USDA eligible for 100% financing.
ⓘ Source: listings_history table (triggers on properties + properties_extension) + one-shot
backfill from property_details.listing_events for pre-trigger history.
Tax reassessment forecast AL · Resets to sale price
- Current annual tax
- $618 · $51/mo
- Projected year-2 tax
- $735 · $61/mo
- Expected delta
- +$117/yr (+$10/mo · 18.9%)
ⓘ Screening estimate from a state-policy table — verify with the county assessor before closing.
Climate risk First Street
- Flood 1/10 Low FEMA zone X (unshaded) · 0% chance over 30 yrs
- Wildfire 6/10 Major
- Heat 9/10 Extreme 7 d/yr ≥105°F today · 21 d/yr by 30 yrs out
- Wind 9/10 Extreme 99% chance of damaging wind over 30 yrs
- Air quality 1/10 Low 0 unhealthy d/yr today · 0 by 30 yrs out
Nearby sold comps map
Loading sold comps map…
Walkable amenities ~0.75 mi
Loading nearby amenities…
Taxation est. · year 1
- Rental income
- $20,806
- − Mortgage interest
- −$10,038
- − Property taxes
- −$618
- − Insurance
- −$896
- − Repairs & maintenance
- −$1,665
- − Management
- −$1,665
- − Depreciation
- −$5,213
- Taxable income
- $713
- Est. tax owed @ 24.0%
- −$171
- After-tax cash flow
- $3,476/yr
For passive investors: Depreciation is non-cash, so a rental often shows a tax loss while cash-flowing — sheltering income. Rental losses are passive: they offset passive income freely, and up to $25,000/yr can offset ordinary (W-2) income if you actively participate and your MAGI is under $100k (phasing out to $0 by $150k); unused losses carry forward. On sale, claimed depreciation is recaptured at up to 25%, and gains may owe capital-gains tax (a 1031 exchange can defer both). Figures are a year-1 estimate at your 24.0% rate — not tax advice; consult a CPA.
Schools (NCES district)
- District
- Mobile County
- NCES district ID
- 0102370
- Math proficiency
- 15% ▼ -28.00%
- Reading proficiency
- 39% ▬ 0.00%
- Median HH income
- $42,455
- Composite
- 22.9/100
- National rank
- #8002
- State rank
- #81 of 129 in AL
Livability — Tillmans Corner
- Score
- 61/100
- State rank
- #260
- US rank
- #18090
Category grades
Schools grade is shown separately in the Schools card above.
Census & demographics
- Census place
- Tillmans Corner, AL
- County
- Mobile County · 246,577 people
- City population
- 14,550
- Metro
- Mobile, AL
- Population (ZIP)
- 23,705
- Household income
- $64,763
- Rent vs Own
- Severe rent burden
- 431.0
Population outlook (Mobile County) Hauer SSP2
- Today (2025)
- 415,303 people
- By 2030
- 411,755 · -0.9%
- By 2040
- 399,670 · -3.8%
- By 2050
- 382,616 · -7.9%
- By 2075
- 337,353 · -18.8%
- By 2100
- 283,391 · -31.8%
Race, ethnicity, and origin ACS 2023
- Neighborhood character
- Predominantly White (73%)
- Race & ethnicity
- White 73% Black 18% Two or more races 4% Hispanic / Latino 3% Asian 2%
- Common ancestry
- Slovak 3% Serbian 2% Lithuanian 2%
- Foreign-born
- 3% · Canada, Vietnam
- Languages at home
- 95% English-only · Spanish 3% Vietnamese 1%
Political lean MEDSL · Mobile
- 2024 margin
- R (+16.4) · D 41.3% · R 57.7%
- 2008→2024 swing
- -7.7pp toward R · 2008: -8.7pp · 2024: -16.4pp
- All cycles
- 2024: R+16.4 2020: R+11.9 2016: R+13.9 2012: R+9.3 2008: R+8.7
Not yet ingested
- Civics
- —
Market trends
- HPI YoY
- ▼ -49.61%
- Current HPI
- 209.7621
- Rent YoY
- —
- Metro
- Mobile, AL
- State GDP YoY
- ▲ 2.94%
- F500 in state
- 4
Industry mix (Fortune 500 HQ in AL)
| Industry | F500 HQs | Revenue |
|---|---|---|
| Financial Services | 1 | $8B |
|
||
| Healthcare | 1 | $5B |
|
||
Price history
+106.0% since first listed10 events — show timeline
- 2026-04-22 Pending — GCMLS AL
- 2026-04-10 Price Changed $179,194 GCMLS AL
- 2026-03-23 Relisted — GCMLS AL
- 2026-03-16 Pending — GCMLS AL
- 2026-02-28 Price Changed $189,209 GCMLS AL
- 2026-02-13 Listed $195,000 GCMLS AL
- 2019-05-09 Sold (Public Records) $114,136 Public Records
- 2015-02-12 Sold (Public Records) $86,701 Public Records
- 2015-01-19 Sold (MLS) $86,000 BCAR
- 2014-06-17 Listed $87,000 BCAR
Property tax history
-3.2%/yrLatest (2025): $618 · +4.9% YoY. Source: county tax records.
Cash-flow waterfall
monthlySold comps — $/sqft
last 12 mo · ≤1 miLoading sold comps…