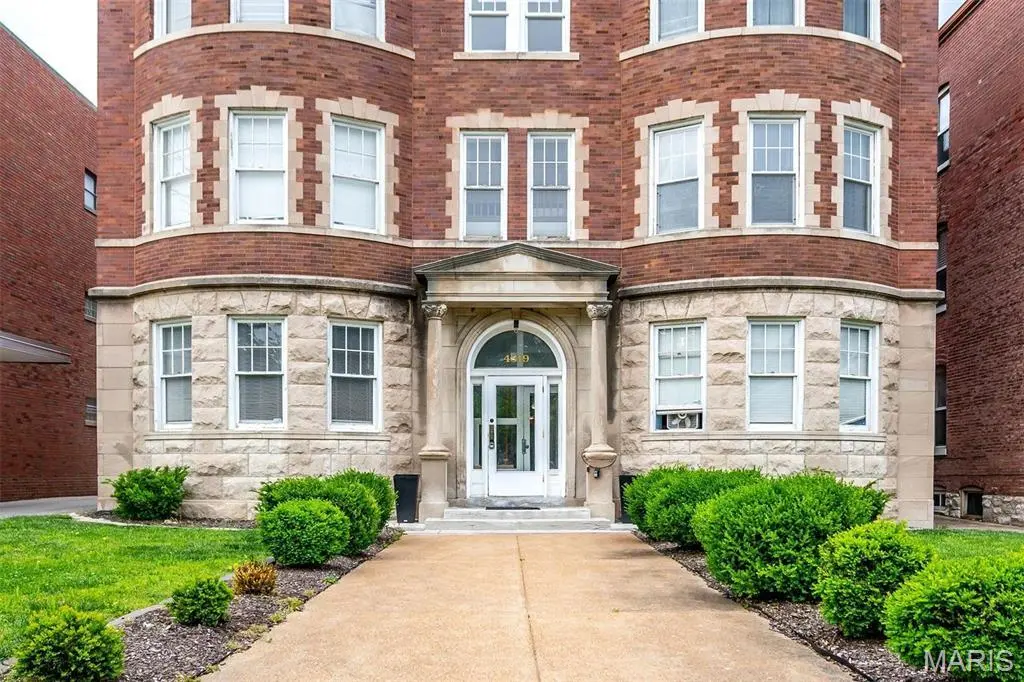
4319 Lindell Blvd Unit D · St. Louis, MO
Flood risk 1/10 · Minimal
- FEMA flood zone
- X (unshaded)
- Chance of flooding over 30 yrs
- 0.0%
- Est. flood insurance / yr
- $507 – $1,088
Fire risk 1/10 · Minimal
- Est. fire insurance / yr
- $1,054 – $1,958
Heat risk 6/10 · Moderate
- Hot days now (above 108°F)
- 7 days/yr
- Hot days in 30 yrs
- 21 days/yr
Wind risk 2/10 · Minimal
- Chance of severe wind over 30 yrs
- 1.0%
Air-quality risk 3/10 · Minor
- Unhealthy air days now
- 3 days/yr
- Unhealthy air days in 30 yrs
- 4 days/yr
Risk factors via First Street. Map © Google.
Why this score? — see what drove the D grade
The composite is a weighted blend of 9 inputs, each scored 0–100. Each bar is that input's sub-score; the figure is the points it added to the 100-point composite (weight × sub-score).
- ARV discount +15.0/15.0
- Cash flow +11.1/30.0
- 1% rule +4.7/10.0
- Rent growth +3.3/5.0
- DSCR +3.2/10.0
- Livability +2.5/5.0
- Condition / age +2.5/5.0
- Schools +1.2/10.0
- Appreciation +0.0/10.0
$169,000
🖨 Deal sheet (PDF) 📄 Offer letter ✓ Due diligence
Listing remarks MLS
Central West End. Great, walkable neighborhood. Spacious 2 bed/ 2bath (The second bed is in the basement and does not have a door) this would make a great office/ guest room. Close to SLU, Wash U, and The Medical Center. First floor apartment with views of Lindell out your living room bay window. Bedroom is large with plenty of closet space. Washer and dryer in the unit. One gated reserved parking space included. Location: Ground Level
Key facts
- Close to slu
- Close to wash u
- $250 HOA
Tags
Neighborhood map
What this means for you Summary
Snapshot
- This is a 2-bed/1.5-bath condo listed at $169k.
Deal economics
- At list price, monthly cash flow is $-68 ($-813/yr) — negative.
- To cash-flow at today's rent, offer at most $157k (7.1% below list).
- To meet the 1% rule (rent ≥ 1% of price), the offer needs to be $163k (3.3% below list).
- Recommended offer: $157k (7.1% below list) — sets the bar for cash-flow.
Location & tenants
- Location reads: area grade D — affects rentability + tenant quality, not the cash-flow math above.
- St. Louis City (urban): math 10% / reading 18% proficiency, ranked #312 of 324 in MO (top 96%) — low school quality limits family demand, transient renter base, plan for 1-2y turnover; 80% free/reduced lunch — lower-income household profile, screen leases tightly.
- Zoned schools: Nahed Chapman New American Aca (math 2% / reading 2%, grade F, #1,099 of 1,115 statewide, top 100%, 335 students, 99% FRL); Gateway Middle (math 0% / reading 8%, grade F, #389 of 391 statewide, top 100%, 506 students, 99% FRL); Roosevelt High (math 2% / reading 8%, grade F, #517 of 521 statewide, top 100%, 460 students, 99% FRL) — zoned schools average 99% FRL vs 80% district-wide (19 pts higher); higher-poverty schools than district average — tighter screening recommended.
- Market conditions: Rents rising (+3.1%/yr); 153 active listings in the ZIP; 40 comparable units currently listed for rent nearby; rentals at typical pace (median 18d on market — plan ~3-4 weeks tenant-placement turnaround); 294 units permitted in St. Louis city in 2024 (227 in 5+ unit buildings).
- This rent runs 36% of the median local income ($55k/yr) — at the standard rent-burdened threshold; future hikes will face affordability resistance.
Forward outlook
- Local home prices are declining (-3.0%/yr); year-one equity from $1k of loan paydown is wiped out by about $5k of value loss. Plan a longer hold.
- St. Louis County population projected to shrink 6% by 2050 — rents likely to lag national; underwrite the cash flow, not the appreciation.
Negotiation context
- It's been on market 80 days — a 6% lower offer ($159k) is reasonable based on typical stale-listing flexibility.
- 4 sale attempts since 2y ago; this cycle's ask has dropped $10k (6%) from the opening price — seller is motivated, your offer sets the floor, not the list.
- Current owner paid $131k; 29% above their basis — modest negotiation headroom, anchor on the comps not their cost.
Risks & watch-outs
- Watch-outs: built in 1902 — expect roof / HVAC / electrical / plumbing capex.
- Climate carrying-cost: extreme-heat days projected 7→21/yr by 2055 (HVAC capex compounding) — expect insurance premiums to compound above CPI over the hold.
Questions for the listing agent
- What do current leases actually rent for vs. the listed asking? Can we see a recent rent roll and the last 12 months of T-12 income?
- It's been on market 80 days. Have you received any prior offers? Is the seller open to a 7% concession, seller financing, or rate buy-down credit?
- Built in 1902 — when were the roof, HVAC, electrical panel, plumbing, and water heater last replaced?
- What does the HOA fee cover, when was the last increase, and are there any pending special assessments or reserve-fund shortfalls?
- Any open or pending special assessments — roof, HVAC, plumbing, elevator, façade? What's the per-unit balance and payoff schedule, and is the seller paying it off at close or rolling it to the buyer?
- Why hasn't it sold? Are there any deal-killer items the seller is aware of (foundation, flood, title, zoning, code violations)?
- Is there a deadline driving the sale (1031 exchange, divorce, estate, relocation)? That informs how much negotiation room exists.
- The area grade is low — what's the realistic commute time and amenity access for the typical tenant pool here? Any planned neighborhood developments (good or bad) we should know about?
- What's the average days-on-market for RENTAL listings here right now (not sales)? A rising rental-DOM trend means longer vacancies and softer asking-rent achievability than the comps imply.
- What's the recent tenant-quality profile in this submarket — average credit score on applications, eviction rate, late-payment / NSF rate, and stable-employment percentage? A property-management company in the area should have these aggregated.
- How much new apartment / multifamily construction is in the pipeline within 1–3 miles? Heavy new supply (>2% of stock underway) typically softens rents 12–24 months out; light construction supports rent growth.
Investment metrics
- 1% rule
- 0.97% ✗
- Cap rate
- 5.81%
- Cash-on-cash
- -1.72%
- DSCR
- 0.92
- GRM
- 8.6
CMA / ARV
- ARV (median comp)
- $219,445
- List price
- $169,000
- Delta
- -22.99%
- Verdict
- UNDERPRICED
- Comps
- 20 within 1.0 mi
Projected returns pro-forma
-3.0% appreciation · 3.1% rent growth · sell at horizon
- IRR
- -18.9%
- Equity multiple
- 0.34×
- Total profit
- $-31,391
- Equity at exit
- $25,198
- IRR
- -11.0%
- Equity multiple
- 0.33×
- Total profit
- $-31,633
- Equity at exit
- $14,612
Cash invested: $47,320 (down + closing). Projections, not guarantees.
Landlord ↔ Tenant lean methodology
- Overall (STATE)
- 81 Strongly Landlord-Friendly
- State Missouri
- 81 Strongly Landlord-Friendly · R+10
- County
- — inherits STATE
- City
- — inherits STATE
ZIP-level market 63108
- Home prices YoY
- -33.1%
- Rents YoY
- 3.1%
- Active inventory
- 153
- Price-to-rent
- 8.6×
Monthly cashflow live
- Estimated rent
- $1,635 high interval (Pro) →
- Mortgage (P&I)
- −$886
- Tax from tax record
- −$152 /mo · $1,829/yr
- Insurance
- −$70
- HOA
- −$250
- Vacancy / Maint / Mgmt
- −$343
- Net cashflow
- $-68
Break-even live
Sensitivity live
| Price | -10% $28 | -5% $-20 | +0% $-68 | +5% $-116 | +10% $-163 |
|---|---|---|---|---|---|
| Rent | -10% $-197 | -5% $-132 | +0% $-68 | +5% $-3 | +10% $61 |
| Rate | -1.0pp $17 | -0.5pp $-25 | base $-68 | +0.5pp $-112 | +1.0pp $-156 |
UW: 25.0% down · 7.5% · 30yr · 1.5% tax · 5.0% vac · 8.0% maint · 8.0% mgmt
Financing live
Cash to close
- Down payment
- $42,250
- Closing costs
- $5,070
- Reserves months
- —
- Total cash needed
- —
Loan-product check · same deal, 3 products live
Conventional
25% down · 7.5% · 30yr
- Down + closing
- —
- Monthly P&I
- —
- Monthly cashflow
- —
- DSCR
- —
- Eligible?
- —
Personal DTI + credit; lowest rate.
DSCR
20% down · 8.5% · 30yr
- Down + closing
- —
- Monthly P&I
- —
- Monthly cashflow
- —
- DSCR
- —
- Eligible?
- —
No personal income docs; deal must DSCR.
Hard money
10% down · 12.0% · 12mo
- Down + closing
- —
- Monthly P&I
- —
- Monthly cashflow
- —
- DSCR
- —
- Eligible?
- —
Short-term bridge; refi at stabilization.
Rent comps 40 comps
| Address | Beds | Baths | Sqft | Rent | $/sqft | DOM | Units | Dist |
|---|---|---|---|---|---|---|---|---|
| 322 N Boyle Ave Unit 3N St. Louis, MO | 2.0 | 2.0 | 1115 | $1,550 | $1.39 | 45d | 1 | 0.06mi |
| 4242 Lindell Blvd Saint Louis, MO | 1.0–2.0 | 1.0–2.0 | 820 | $1,625 | $1.98 | 18d | 4 | 0.07mi |
| 4242 Lindell Blvd Apt 102 St. Louis, MO | 1.0 | 1.0 | 740 | $1,300 | $1.76 | 25d | 1 | 0.07mi |
| 4359 W Pine Blvd Saint Louis, MO | 2.0 | 1.0 | 1100 | $1,995 | $1.81 | 19d | 1 | 0.12mi |
| 4355 Maryland Ave Saint Louis, MO | 1.0 | 1.0 | 588 | $1,200 | $2.04 | 45d | 4 | 0.16mi |
| 4355 Maryland Ave Saint Louis, MO | 2.0 | 1.0 | 701 | $1,700 | $2.43 | 4d | 8 | 0.17mi |
| 4400 Lindell Blvd Saint Louis, MO | 3.0 | 1.0–3.0 | 1100 | $2,398 | $2.18 | 0d | 16 | 0.21mi |
| 4362 McPherson Ave Saint Louis, MO | 1.0 | 1.0 | 900 | $1,095 | $1.22 | 45d | 1 | 0.22mi |
| 4394 McPherson Ave Saint Louis, MO | 2.0 | 1.0 | 850 | $1,175 | $1.38 | 45d | 1 | 0.27mi |
| 4100 Lindell Blvd #302 St. Louis, MO | 1.0 | 1.0 | 755 | $1,225 | $1.62 | 0d | 1 | 0.28mi |
| 4065 W Pine Blvd Saint Louis, MO | 1.0–3.0 | 1.0–2.0 | 1075 | $1,900 | $1.77 | 45d | 8 | 0.31mi |
| 462 Whittier St Apt 6 St. Louis, MO | 1.0 | 1.0 | 598 | $1,225 | $2.05 | 21d | 1 | 0.33mi |
| 4466 Greenwich Ct St. Louis, MO | 2.0 | 1.0–2.0 | 750 | $1,422 | $1.90 | 4d | 6 | 0.39mi |
| 4140 Washington Blvd Saint Louis, MO | 1.0 | 1.0 | 495 | $1,010 | $2.04 | 45d | 6 | 0.42mi |
| 4140 Washington Blvd Saint Louis, MO | 1.0–2.0 | 1.0–2.5 | 907 | $2,035 | $2.24 | 0d | 1 | 0.42mi |
| 4497 Pershing Ave Saint Louis, MO | 2.0 | 1.0 | 579 | $1,399 | $2.42 | 0d | 6 | 0.43mi |
| 368 N Taylor Ave Saint Louis, MO | 1.0 | 1.0 | 575 | $1,000 | $1.74 | 0d | 8 | 0.43mi |
| 4515 Maryland Ave Saint Louis, MO | 1.0 | 1.0 | 760 | $1,265 | $1.66 | 0d | 5 | 0.44mi |
| 3960 W Pine Blvd Saint Louis, MO | 2.0 | 1.0 | 850 | $1,300 | $1.53 | 45d | 1 | 0.46mi |
| 3965 Laclede Ave Saint Louis, MO | 1.0–2.0 | 1.0–2.0 | 872 | $1,685 | $1.93 | 4d | 4 | 0.47mi |
| 4466 Olive St Saint Louis, MO | 1.0–2.0 | 1.0–2.5 | 1222 | $2,495 | $2.04 | 0d | 7 | 0.48mi |
| 4616 Lindell Blvd Saint Louis, MO | 1.0 | 1.0 | 617 | $1,450 | $2.35 | 9d | 6 | 0.52mi |
| 4615 Lindell Blvd Saint Louis, MO | 1.0–2.0 | 1.0–2.5 | 1251 | $2,075 | $1.66 | 9d | 6 | 0.52mi |
| 4535 Forest Park Ave Saint Louis, MO | 1.0–2.0 | 1.0–2.0 | 1042 | $2,645 | $2.54 | 0d | 13 | 0.54mi |
| 3906 Lindell Blvd St. Louis, MO | 2.0–3.0 | 1.0 | 1072 | $1,375 | $1.28 | 45d | 10 | 0.54mi |
| 3906 Lindell Blvd St. Louis, MO | 2.0–3.0 | 1.0 | 1072 | $1,299 | $1.21 | 0d | 15 | 0.54mi |
| 4567 W Pine Blvd Saint Louis, MO | 2.0–3.0 | 2.0 | 1326 | $2,575 | $1.94 | 0d | 6 | 0.55mi |
| 4160 Olive Blvd Motorworks Saint Louis, MO | 1.0 | 1.0 | 555 | $1,192 | $2.15 | 12d | 3 | 0.56mi |
| 13 S Vandeventer Ave St. Louis, MO | 2.0 | 2.0 | 972 | $1,400 | $1.44 | 6d | 1 | 0.60mi |
| 4907 W Pine Blvd Saint Louis, MO | 2.0 | 1.0–2.0 | 750 | $1,649 | $2.20 | 45d | 1 | 0.61mi |
| 4909 Laclede Ave Saint Louis, MO | 1.0 | 1.0 | 891 | $2,450 | $2.75 | 45d | 1 | 0.61mi |
| 2 Maryland Plz Saint Louis, MO | 1.0–2.0 | 1.0–2.0 | 799 | $1,820 | $2.28 | 45d | 4 | 0.63mi |
| 7 Maryland Plz St. Louis, MO | 1.0 | 1.0 | 513 | $1,030 | $2.01 | 45d | 1 | 0.64mi |
| 325-329 N Euclid Ave Unit 2819-B St. Louis, MO | 1.0 | 1.0 | 700 | $950 | $1.36 | 19d | 1 | 0.66mi |
| 4949 W Pine Blvd St. Louis, MO | 1.0–2.0 | 1.0–2.0 | 925 | $2,225 | $2.41 | 0d | 11 | 0.67mi |
| 4954 W Pine Blvd Saint Louis, MO | 2.0 | 2.0 | 950 | $1,300 | $1.37 | 25d | 1 | 0.71mi |
| 386 N Euclid Ave Saint Louis, MO | 1.0 | 1.0 | 590 | $1,495 | $2.53 | 6d | 1 | 0.72mi |
| 40 N Kingshighway Blvd Saint Louis, MO | 2.0 | 1.0–2.0 | 860 | $2,545 | $2.96 | 3d | 54 | 0.74mi |
| 40 N Kingshighway Blvd Saint Louis, MO | 3.0 | 1.0–2.0 | 872 | $2,195 | $2.52 | 45d | 54 | 0.74mi |
| 100 N Kingshighway Blvd Saint Louis, MO | 3.0 | 1.0–2.0 | 1211 | $5,531 | $4.57 | 45d | 84 | 0.75mi |
HOA detail condo
- Monthly dues
- $250 · $3,000/yr
- Likely covers
- security
- Assessments
- None detected in remarks — confirm with the listing agent.
Listing history 26 events
-
2026-06-21days on market $169,000 Active 80 DOM
-
2026-06-18days on market $169,000 Active 77 DOM
-
2026-06-17days on market $169,000 Active 76 DOM
-
2026-06-16days on market $169,000 Active 75 DOM
-
2026-06-15days on market $169,000 Active 74 DOM
-
2026-06-13days on market $169,000 Active 72 DOM
-
2026-06-09days on market $169,000 Active 68 DOM
-
2026-06-08days on market $169,000 Active 67 DOM
-
2026-06-08days on market $169,000 Active 66 DOM
-
2026-06-05days on market $169,000 Active 63 DOM
-
2026-06-03days on market $169,000 Active 62 DOM
-
2026-06-02days on market $169,000 Active 61 DOM
-
2026-06-01days on market $169,000 Active 60 DOM
-
2026-05-31days on market $169,000 Active 59 DOM
-
2026-04-02$179,000 Active 439-char remark
Show marketing remark (439 chars)
Central West End. Great, walkable neighborhood. Spacious 2 bed/ 2bath (The second bed is in the basement and does not have a door) this would make a great office/ guest room. Close to SLU, Wash U, and The Medical Center. First floor apartment with views of Lindell out your living room bay window. Bedroom is large with plenty of closet space. Washer and dryer in the unit. One gated reserved parking space included. Location: Ground Level
-
2024-10-03$175,000 Active
-
2024-10-03historical
-
2024-08-01historical
-
2024-06-04price $175,000
-
2024-05-01$180,000 Active
-
2024-05-01historical $1,200
-
2024-04-26$1,200
-
2004-08-11soldstatus $131,000
-
2001-08-07soldstatus
-
1999-10-11soldstatus
-
1997-07-25soldstatus
ⓘ Source: listings_history table (triggers on properties + properties_extension) + one-shot
backfill from property_details.listing_events for pre-trigger history.
Tax reassessment forecast MO · Resets to sale price
- Current annual tax
- $1,829 · $152/mo
- Projected year-2 tax
- $1,829 · $152/mo
- Expected delta
- $0/yr ($0/mo · 0.0%)
ⓘ Screening estimate from a state-policy table — verify with the county assessor before closing.
Climate risk First Street
- Flood 1/10 Low FEMA zone X (unshaded) · 0% chance over 30 yrs
- Wildfire 1/10 Low
- Heat 6/10 Major 7 d/yr ≥108°F today · 21 d/yr by 30 yrs out
- Wind 2/10 Low 100% chance of damaging wind over 30 yrs
- Air quality 3/10 Moderate 3 unhealthy d/yr today · 4 by 30 yrs out
Nearby sold comps map
Loading sold comps map…
Walkable amenities ~0.75 mi
Loading nearby amenities…
Taxation est. · year 1
- Rental income
- $19,616
- − Mortgage interest
- −$9,467
- − Property taxes
- −$1,829
- − Insurance
- −$845
- − Repairs & maintenance
- −$1,569
- − Management
- −$1,569
- − HOA
- −$3,000
- − Depreciation
- −$4,916
- Taxable loss
- −$3,580
- Est. tax savings @ 24.0%
- +$859
- After-tax cash flow
- $47/yr
For passive investors: Depreciation is non-cash, so a rental often shows a tax loss while cash-flowing — sheltering income. Rental losses are passive: they offset passive income freely, and up to $25,000/yr can offset ordinary (W-2) income if you actively participate and your MAGI is under $100k (phasing out to $0 by $150k); unused losses carry forward. On sale, claimed depreciation is recaptured at up to 25%, and gains may owe capital-gains tax (a 1031 exchange can defer both). Figures are a year-1 estimate at your 24.0% rate — not tax advice; consult a CPA.
Schools (NCES district)
- District
- St. Louis City
- NCES district ID
- 2929280
- Math proficiency
- 10% ▼ -6.00%
- Reading proficiency
- 18% ▼ -3.00%
- Median HH income
- $35,685
- Composite
- 11.54/100
- National rank
- #9699
- State rank
- #312 of 324 in MO
Livability — St. Louis
No livability data for this city. (Only ~50 U.S. cities are tracked.)
Census & demographics
- Census place
- St. Louis, MO
- County
- Saint Louis City · 254,015 people
- City population
- 283,259
- Metro
- St. Louis, MO-IL
- Population (ZIP)
- 21,336
- Household income
- $55,147
- Rent vs Own
- Severe rent burden
- 2180.0
Population outlook (St. Louis County) Hauer SSP2
- Today (2025)
- 315,737 people
- By 2030
- 313,865 · -0.6%
- By 2040
- 305,439 · -3.3%
- By 2050
- 296,529 · -6.1%
- By 2075
- 271,028 · -14.2%
- By 2100
- 255,359 · -19.1%
Race, ethnicity, and origin ACS 2023
- Neighborhood character
- Diverse neighborhood (Simpson 0.62)
- Race & ethnicity
- White 54% Black 26% Asian 13% Hispanic / Latino 4% Two or more races 4%
- Common ancestry
- Lithuanian 4% Romanian 3% Iranian 2%
- Foreign-born
- 13% · China, Canada, South Korea
- Languages at home
- 85% English-only · Chinese 3% Other Asian/Pacific 3% Spanish 3%
Political lean MEDSL · St. Louis
- 2024 margin
- Solid D (+64.7) · D 81.4% · R 16.7% · Other 2.0%
- 2008→2024 swing
- -3.5pp toward R · 2008: 68.2pp · 2024: 64.7pp
- All cycles
- 2024: D+64.7 2020: D+66.2 2016: D+63.7 2012: D+66.6 2008: D+68.2
Not yet ingested
- Civics
- —
Market trends
- HPI YoY
- ▼ -111.22%
- Current HPI
- 225.1081
- Rent YoY
- ▲ 3.10%
- Metro
- St. Louis, MO-IL
- State GDP YoY
- ▲ 1.84%
- F500 in state
- 20
Industry mix (Fortune 500 HQ in MO)
| Industry | F500 HQs | Revenue |
|---|---|---|
| Healthcare | 1 | $163B |
|
||
| Insurance | 1 | $21B |
|
||
| Industrial Technology | 1 | $17B |
|
||
| Retail | 1 | $16B |
|
||
| Industrial Distribution | 1 | $10B |
|
||
| Utilities | 1 | $9B |
|
||
Price history
+36.6% since first listed12 events — show timeline
- 2026-04-02 Listed $179,000 MARIS as Distributed by MLS Grid
- 2024-10-03 Listed $175,000 MARIS as Distributed by MLS Grid
- 2024-10-03 Coming Soon — MARIS as Distributed by MLS Grid
- 2024-08-01 Delisted — MARIS as Distributed by MLS Grid
- 2024-06-04 Price Changed $175,000 MARIS as Distributed by MLS Grid
- 2024-05-01 Listed $180,000 MARIS as Distributed by MLS Grid
- 2024-05-01 Rental Removed $1,200 APPFOLIO
- 2024-04-26 Listed for Rent $1,200 APPFOLIO
- 2004-08-11 Sold (Public Records) $131,000 Public Records
- 2001-08-07 Sold (Public Records) — Public Records
- 1999-10-11 Sold (Public Records) — Public Records
- 1997-07-25 Sold (Public Records) — Public Records
Property tax history
-1.5%/yrLatest (2024): $1,829 · +4.7% YoY. Source: county tax records.
Cash-flow waterfall
monthlySold comps — $/sqft
last 12 mo · ≤1 miLoading sold comps…