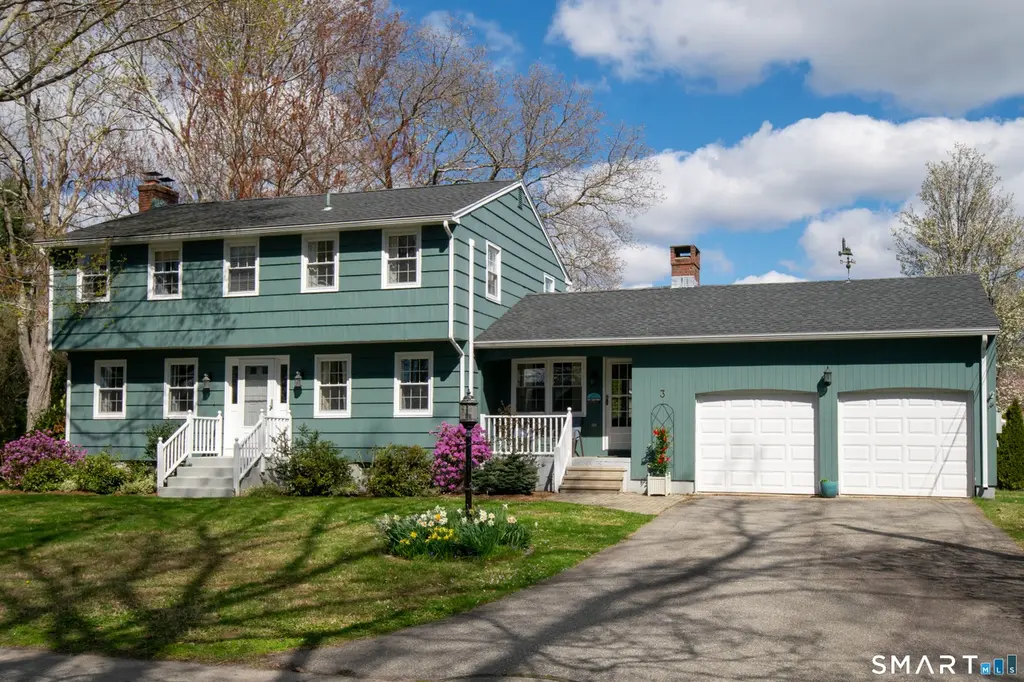
3 Deerfield Rd · Saybrook Manor, CT
Flood risk 4/10 · Minor
- FEMA flood zone
- X (shaded)
- Chance of flooding over 30 yrs
- 0.13%
- Est. flood insurance / yr
- $473 – $860
Fire risk 1/10 · Minimal
- Est. fire insurance / yr
- $829 – $1,539
Heat risk 6/10 · Moderate
- Hot days now (above 93°F)
- 7 days/yr
- Hot days in 30 yrs
- 18 days/yr
Wind risk 8/10 · Major
- Chance of severe wind over 30 yrs
- 80.0%
Air-quality risk 4/10 · Minor
- Unhealthy air days now
- 4 days/yr
- Unhealthy air days in 30 yrs
- 5 days/yr
Risk factors via First Street. Map © Google.
Why this score? — see what drove the D grade
The composite is a weighted blend of 9 inputs, each scored 0–100. Each bar is that input's sub-score; the figure is the points it added to the 100-point composite (weight × sub-score).
- Cash flow +14.5/30.0
- ARV discount +5.8/15.0
- Schools +4.9/10.0
- DSCR +4.4/10.0
- 1% rule +3.2/10.0
- Livability +3.2/5.0
- Rent growth +2.5/5.0
- Condition / age +2.5/5.0
- Appreciation +0.0/10.0
$699,900
🖨 Deal sheet (PDF) 📄 Offer letter ✓ Due diligence
Listing remarks
Exceptional Colonial! This stunning 1916 sq. ft. home is in the desirable Meadowood area, offering convenient access to restaurants, shops, beaches & some water views. It is ideal for commuters, with proximity to I-95, and Boston & New York City only 2.5 hr. away. The home boasts hardwood floors, with a tile floor in the kitchen. The spacious living room is complete with a wood-burning fireplace. Adjacent to the kitchen is a family room featuring a gas fireplace, creating a cozy spot for reading or relaxation. The updated kitchen is equipped with quartz countertops, a double oven, and is conveniently next to the dining room. Enjoy outdoor living with a spacious screened-in porch
Key facts
- 0.31 acre lot
- 2 garage spots
- Built 1962
Neighborhood map
What this means for you Summary
Snapshot
- This is a 4-bed/2.5-bath single-family listed at $700k.
Deal economics
- At list price, monthly cash flow is $154 ($2k/yr) — positive.
- The deal already cash-flows at list — no discount required.
- To meet the 1% rule (rent ≥ 1% of price), the offer needs to be $571k (18.4% below list).
- Recommended offer: $571k (18.4% below list) — sets the bar for 1% rule.
Location & tenants
- Location reads 64/100 on livability (#129 in CT) — a middle-class / working-renter tenant base. Strengths: crime A+, employment A+, housing A-; Watch: amenities F, commute F, cost of living F.
- Old Saybrook School District (suburban): math 45% / reading 64% proficiency, ranked #66 of 153 in CT (top 43%) — acceptable for families but not a draw, mixed tenant base, ~2y average lease; only 13% free/reduced lunch — higher-income household profile.
- Zoned schools: Kathleen E. Goodwin School (math 52% / reading 67%, grade B-, #159 of 553 statewide, top 31%, 401 students, 24% FRL); Old Saybrook Middle School (math 42% / reading 64%, grade C+, #71 of 175 statewide, top 41%, 317 students, 26% FRL); Old Saybrook Senior High School (math 42% / reading 62%, grade D+, #80 of 194 statewide, top 44%, 347 students, 22% FRL).
- Market conditions: 76 active listings in the ZIP; 4 comparable units currently listed for rent nearby; rentals lingering (median 46d on market — plan ~5-8 weeks vacancy on turnover, expect pricing pressure); 100% of comp listings sitting > 30 days — soft ceiling on asking rent; 278 units permitted in Lower Connecticut River Valley Planning Region in 2024 (89 in 5+ unit buildings).
Forward outlook
- Local home prices are declining (-3.0%/yr); year-one equity from $5k of loan paydown is wiped out by about $21k of value loss. Plan a longer hold.
Negotiation context
- Only 2 days on market — expect competitive offers; lowballing is unlikely to land.
Risks & watch-outs
- Climate carrying-cost: severe wind risk, 80% chance of damaging wind over 30y; extreme-heat days projected 7→18/yr by 2055 (HVAC capex compounding) — expect insurance premiums to compound above CPI over the hold.
Questions for the listing agent
- Built in 1962 — when were the roof, HVAC, electrical panel, plumbing, and water heater last replaced?
- Is there a deadline driving the sale (1031 exchange, divorce, estate, relocation)? That informs how much negotiation room exists.
- The area grade is low — what's the realistic commute time and amenity access for the typical tenant pool here? Any planned neighborhood developments (good or bad) we should know about?
- What's the average days-on-market for RENTAL listings here right now (not sales)? A rising rental-DOM trend means longer vacancies and softer asking-rent achievability than the comps imply.
- What's the recent tenant-quality profile in this submarket — average credit score on applications, eviction rate, late-payment / NSF rate, and stable-employment percentage? A property-management company in the area should have these aggregated.
- How much new for-sale + rental construction is in the pipeline within 1–3 miles? Heavy new supply typically softens prices + rents 12–24 months out; constrained supply supports both.
Investment metrics
- 1% rule
- 0.82% ✗
- Cap rate
- 6.56%
- Cash-on-cash
- 0.94%
- DSCR
- 1.04
- GRM
- 10.2
CMA / ARV
- ARV (on-the-fly)
- $674,432
- Comps found
- 9
Show comp detail 9 sales within ~0.75 mi
| Address | Dist | Beds/Ba | Sqft | Sold | Price | $/sf | Match |
|---|---|---|---|---|---|---|---|
| 14 Meadowood Ln | 0.06mi | 4/2.0 | 1,812 (-5%) | 11mo | $499,000 | $275 | 78 |
| 4 Chartier Ave | 0.46mi | 3/1.5 (-1) | 1,920 (+0%) | 9mo | $675,000 | $352 | 62 |
| 118 Old Sea Ln | 0.45mi | 3/3.0 (-1) | 1,994 (+4%) | 11mo | $1,750,000 | $878 | 56 |
| 1 Hartford Ave | 0.36mi | 3/2.0 (-1) | 1,762 (-8%) | 9mo | $620,000 | $352 | 56 |
| 10 Lookout Hill Rd | 0.58mi | 3/1.5 (-1) | 1,936 (+1%) | 13mo | $365,000 | $189 | 51 |
| 11 Chandler St | 0.48mi | 3/3.0 (-1) | 2,052 (+7%) | 14mo | $1,420,000 | $692 | 47 |
| 3 Lookout Hill Rd | 0.56mi | 3/2.0 (-1) | 1,881 (-2%) | 24mo | $525,000 | $279 | 44 |
| 11 Beach Rd E | 0.50mi | 3/2.0 (-1) | 1,648 (-14%) | 13mo | $993,500 | $603 | 35 |
| 90 Chalker Beach Rd | 0.39mi | 4/1.5 | 1,632 (-15%) | 24mo | $685,000 | $420 | 34 |
Match score weights: distance 35% · size 25% · config 20% · recency 20%. Top-matched comps best support the ARV.
Projected returns pro-forma
-3.0% appreciation · 3.0% rent growth · sell at horizon
- IRR
- -14.8%
- Equity multiple
- 0.47×
- Total profit
- $-103,798
- Equity at exit
- $104,357
- IRR
- -6.2%
- Equity multiple
- 0.60×
- Total profit
- $-78,586
- Equity at exit
- $60,515
Cash invested: $195,972 (down + closing). Projections, not guarantees.
Landlord ↔ Tenant lean methodology
- Overall (STATE)
- 27 Tenant-Leaning
- State Connecticut
- 27 Tenant-Leaning · D+7
- County
- — inherits STATE
- City
- — inherits STATE
ZIP-level market 06475
- Active inventory
- 76
- Price-to-rent
- 10.2×
Monthly cashflow live
- Estimated rent
- $5,709 medium interval (Pro) →
- Mortgage (P&I)
- −$3,670
- Tax from tax record
- −$394 /mo · $4,726/yr
- Insurance
- −$292
- HOA
- −$0
- Vacancy / Maint / Mgmt
- −$1,199
- Net cashflow
- $154
Break-even live
Sensitivity live
| Price | -10% $550 | -5% $352 | +0% $154 | +5% $-44 | +10% $-242 |
|---|---|---|---|---|---|
| Rent | -10% $-297 | -5% $-71 | +0% $154 | +5% $380 | +10% $605 |
| Rate | -1.0pp $507 | -0.5pp $332 | base $154 | +0.5pp $-27 | +1.0pp $-212 |
UW: 25.0% down · 7.5% · 30yr · 1.5% tax · 5.0% vac · 8.0% maint · 8.0% mgmt
Financing live
Cash to close
- Down payment
- $174,975
- Closing costs
- $20,997
- Reserves months
- —
- Total cash needed
- —
Loan-product check · same deal, 3 products live
Conventional
25% down · 7.5% · 30yr
- Down + closing
- —
- Monthly P&I
- —
- Monthly cashflow
- —
- DSCR
- —
- Eligible?
- —
Personal DTI + credit; lowest rate.
DSCR
20% down · 8.5% · 30yr
- Down + closing
- —
- Monthly P&I
- —
- Monthly cashflow
- —
- DSCR
- —
- Eligible?
- —
No personal income docs; deal must DSCR.
Hard money
10% down · 12.0% · 12mo
- Down + closing
- —
- Monthly P&I
- —
- Monthly cashflow
- —
- DSCR
- —
- Eligible?
- —
Short-term bridge; refi at stabilization.
Rent comps 4 comps
| Address | Beds | Baths | Sqft | Rent | $/sqft | DOM | Units | Dist |
|---|---|---|---|---|---|---|---|---|
| 33 Beach Rd W Old Saybrook, CT | 4.0 | 1.5 | 1316 | $4,500 | $3.42 | 45d | 1 | 0.62mi |
| 58 Chapman Ave Westbrook, CT | 3.0 | 4.0 | 2353 | $4,000 | $1.70 | 45d | 1 | 0.90mi |
| 156 Old Kelsey Point Rd Westbrook, CT | 4.0 | 3.0 | 1618 | $7,500 | $4.64 | 45d | 1 | 1.01mi |
| 226 Old Kelsey Point Rd Westbrook, CT | 3.0 | 2.0 | 1606 | $5,500 | $3.42 | 45d | 1 | 1.10mi |
Listing history 3 events
-
2026-04-27status Under Contract
-
2026-04-25$699,900 Active
-
2026-04-22historical $699,900
ⓘ Source: listings_history table (triggers on properties + properties_extension) + one-shot
backfill from property_details.listing_events for pre-trigger history.
Tax reassessment forecast CT · Partial reset (capped growth)
- Current annual tax
- $4,726 · $394/mo
- Projected year-2 tax
- $9,852 · $821/mo
- Expected delta
- +$5,126/yr (+$427/mo · 108.5%)
ⓘ Screening estimate from a state-policy table — verify with the county assessor before closing.
Climate risk First Street
- Flood 4/10 Moderate FEMA zone X (shaded) · 13% chance over 30 yrs
- Wildfire 1/10 Low
- Heat 6/10 Major 7 d/yr ≥93°F today · 18 d/yr by 30 yrs out
- Wind 8/10 Severe 80% chance of damaging wind over 30 yrs
- Air quality 4/10 Moderate 4 unhealthy d/yr today · 5 by 30 yrs out
Nearby sold comps map
Loading sold comps map…
Walkable amenities ~0.75 mi
Loading nearby amenities…
Taxation est. · year 1
- Rental income
- $68,507
- − Mortgage interest
- −$39,205
- − Property taxes
- −$4,726
- − Insurance
- −$3,500
- − Repairs & maintenance
- −$5,481
- − Management
- −$5,481
- − Depreciation
- −$20,361
- Taxable loss
- −$10,245
- Est. tax savings @ 24.0%
- +$2,459
- After-tax cash flow
- $4,310/yr
For passive investors: Depreciation is non-cash, so a rental often shows a tax loss while cash-flowing — sheltering income. Rental losses are passive: they offset passive income freely, and up to $25,000/yr can offset ordinary (W-2) income if you actively participate and your MAGI is under $100k (phasing out to $0 by $150k); unused losses carry forward. On sale, claimed depreciation is recaptured at up to 25%, and gains may owe capital-gains tax (a 1031 exchange can defer both). Figures are a year-1 estimate at your 24.0% rate — not tax advice; consult a CPA.
Schools (NCES district)
- District
- Old Saybrook School District
- NCES district ID
- 0903180
- Math proficiency
- 45% ▼ -19.00%
- Reading proficiency
- 64% ▼ -10.00%
- Median HH income
- $74,710
- Composite
- 48.81/100
- National rank
- #2090
- State rank
- #66 of 153 in CT
Livability — Saybrook Manor
- Score
- 64/100
- State rank
- #129
- US rank
- #14643
Category grades
Schools grade is shown separately in the Schools card above.
Census & demographics
- Census place
- Saybrook Manor, CT
- Population (ZIP)
- 10,515
Population outlook (Lower Connecticut River Valley County) Hauer SSP2
- By 2040
- 188,651
Race, ethnicity, and origin ACS 2023
- Neighborhood character
- Predominantly White (90%)
- Race & ethnicity
- White 90% Hispanic / Latino 7% Two or more races 4% Asian 1% Native American 1%
- Hispanic origin (detail)
- Puerto Rican 2%
- Common ancestry
- Romanian 8% Lithuanian 4% Iranian 2%
- Foreign-born
- 8% · Canada, China
- Languages at home
- 89% English-only · Spanish 7% Russian/Polish/Slavic 1% Other Indo-European 1%
Political lean MEDSL · Lower Connecticut River Valley
- 2024 margin
- D (+13.4) · D 55.9% · R 42.4% · Other 1.7%
- All cycles
- 2024: D+13.4
Not yet ingested
- Civics
- —
Market trends
- HPI YoY
- ▼ -222.11%
- Current HPI
- 301.8614
- Rent YoY
- —
- Metro
- —
- State GDP YoY
- ▲ 1.06%
- F500 in state
- 38
Industry mix (Fortune 500 HQ in CT)
| Industry | F500 HQs | Revenue |
|---|---|---|
| Industrial Machinery | 4 | $38B |
|
||
| Insurance | 3 | $71B |
|
||
| Financial Services | 2 | $25B |
|
||
| Transportation / Logistics | 2 | $18B |
|
||
| Healthcare | 1 | $247B |
|
||
| Telecommunications | 1 | $55B |
|
||
Price history
+0.0% since first listed3 events — show timeline
- 2026-04-27 Pending — Smart MLS
- 2026-04-25 Listed $699,900 Smart MLS
- 2026-04-22 Coming Soon $699,900 Smart MLS
Property tax history
+0.7%/yrLatest (2023): $4,726 · +1.9% YoY. Source: county tax records.
Cash-flow waterfall
monthlySold comps — $/sqft
last 12 mo · ≤1 miLoading sold comps…