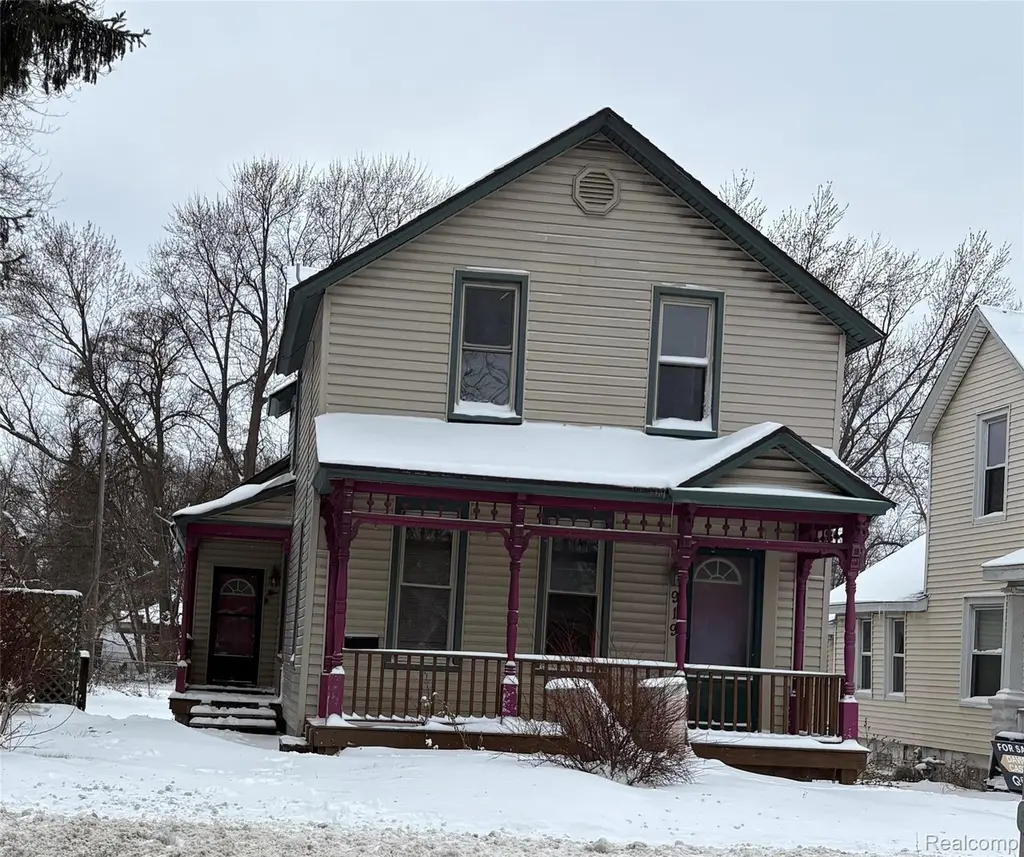
919 10th St · Port Huron, MI
Flood risk 7/10 · Major
- FEMA flood zone
- X (unshaded)
- Chance of flooding over 30 yrs
- 0.77%
- Est. flood insurance / yr
- $507 – $1,088
Fire risk 1/10 · Minimal
- Est. fire insurance / yr
- $784 – $1,456
Heat risk 2/10 · Minimal
- Hot days now (above 98°F)
- 7 days/yr
- Hot days in 30 yrs
- 13 days/yr
Wind risk 1/10 · Minimal
- Chance of severe wind over 30 yrs
- —
Air-quality risk 2/10 · Minimal
- Unhealthy air days now
- 1 days/yr
- Unhealthy air days in 30 yrs
- 2 days/yr
Risk factors via First Street. Map © Google.
Why this score? — see what drove the B- grade
The composite is a weighted blend of 9 inputs, each scored 0–100. Each bar is that input's sub-score; the figure is the points it added to the 100-point composite (weight × sub-score).
- Cash flow +30.0/30.0
- 1% rule +10.0/10.0
- DSCR +10.0/10.0
- ARV discount +7.5/15.0
- Rent growth +3.4/5.0
- Livability +3.2/5.0
- Schools +2.5/10.0
- Condition / age +2.5/5.0
- Appreciation +0.0/10.0
$69,000
🖨 Deal sheet 📄 Offer letter ✓ Due diligence
Listing remarks MLS
HUGE HOME! CASH ONLY. 4 BEDROOMS. 1.5 BATH. GREAT SIZE FAMILY HOME OR INVESMENT PROPERTY. WOULD BE A GREAT RENTAL OR FLIP. BEAUITFUL WALK IN STAIRWAY, HUGE FAMILY AND LIVING ROOM AND GREAT ROOM WITH FIREPLACE. 2WAY STAIRS FOR CONVENIENCE. SHED IN BACK. 2 EXTERIOR DOOR ENTRANCES!
Key facts
- 2way stairs
- Living room
- Family room
Tags
Neighborhood map
What this means for you Summary
Snapshot
- This is a 4-bed/1.5-bath single-family listed at $69k.
Deal economics
- At list price, monthly cash flow is $578 ($7k/yr) — positive.
- The deal already cash-flows at list — no discount required.
- Meets the 1% rule at list price ($1k rent vs $69k).
- Recommended offer: $61k (12.0% below list) — sets the bar for market timing.
- Cap rate 17.5% vs local median 4.6% in Port Huron — top-decile yield for the area; either an underpriced asset or a hidden risk that comps aren't pricing in. Stress-test before assuming the spread holds.
Location & tenants
- Location reads 65/100 on livability (#445 in MI) — a middle-class / working-renter tenant base. Strengths: cost of living A+, housing A+; Watch: amenities C-, health & safety D, schools F.
- Port Huron Area School District (suburban): math 23% / reading 37% proficiency, ranked #368 of 540 in MI (top 68%) — families likely to look elsewhere, expect single-tenant / working-renter base with shorter leases.
- Market conditions: Rents rising (+3.6%/yr); 220 active listings in the ZIP; 3 comparable units currently listed for rent nearby; rentals at typical pace (median 24d on market — plan ~3-4 weeks tenant-placement turnaround); 232 units permitted in St. Clair County in 2024 (0 in 5+ unit buildings).
- This rent runs 34% of the median local income ($53k/yr) — at the standard rent-burdened threshold; future hikes will face affordability resistance.
Forward outlook
- Local home prices are declining (-3.0%/yr); year-one equity from $477 of loan paydown is wiped out by about $2k of value loss. Plan a longer hold.
- St. Clair County population projected at -20% by 2050 — secular population decline; favor cash flow + early exit over multi-decade hold.
- At projected returns (-3.0% appreciation + 3.6% rent growth), your $19k cash investment doubles in ~4 years — after that, you're playing with house money.
Negotiation context
- It's been on market 131 days — a 12% lower offer ($61k) is reasonable based on typical stale-listing flexibility.
- 9 sale attempts since 16y ago with the ask held roughly flat each time — persistent listings suggest the price (not the market) is what's stuck; bring a comps-based counter.
- Current owner paid $28k; list at $69k implies a 151% gain — meaningful room to come down on a strong offer.
Risks & watch-outs
- Watch-outs: property tax is 2.5% of price; flood insurance adds $66/mo; built in 1913 — expect roof / HVAC / electrical / plumbing capex.
- Climate carrying-cost: major flood risk — expect insurance premiums to compound above CPI over the hold.
Questions for the listing agent
- It's been on market 131 days. Have you received any prior offers? Is the seller open to a 12% concession, seller financing, or rate buy-down credit?
- Built in 1913 — when were the roof, HVAC, electrical panel, plumbing, and water heater last replaced?
- Property tax is high relative to price — has the assessment been appealed recently, and will the sale trigger a re-assessment?
- What's the actual annual flood-insurance premium (NFIP or private), and is the property in a SFHA with mandatory coverage?
- Why hasn't it sold? Are there any deal-killer items the seller is aware of (foundation, flood, title, zoning, code violations)?
- Is there a deadline driving the sale (1031 exchange, divorce, estate, relocation)? That informs how much negotiation room exists.
- Schools are F-rated, which usually means shorter tenancies and higher turnover. Who's the typical renter profile here, and what's been the actual vacancy rate?
- Crime grade is F in this area — have there been break-ins, vandalism, or insurance claims at this property in the last 3 years? What carrier currently insures it and at what premium?
- What's the average days-on-market for RENTAL listings here right now (not sales)? A rising rental-DOM trend means longer vacancies and softer asking-rent achievability than the comps imply.
- What's the recent tenant-quality profile in this submarket — average credit score on applications, eviction rate, late-payment / NSF rate, and stable-employment percentage? A property-management company in the area should have these aggregated.
- How much new for-sale + rental construction is in the pipeline within 1–3 miles? Heavy new supply typically softens prices + rents 12–24 months out; constrained supply supports both.
Investment metrics
- 1% rule
- 2.16% ✓
- Cap rate
- 17.50%
- Cash-on-cash
- 40.04%
- DSCR
- 2.78
- GRM
- 3.9
CMA / ARV
- ARV (median comp)
- $138,680
- List price
- $69,000
- Delta
- -50.25%
- Verdict
- UNDERPRICED
- Comps
- 20 within 1.0 mi
Show comp detail 12 sales within ~0.75 mi
| Address | Dist | Beds/Ba | Sqft | Sold | Price | $/sf | Match |
|---|---|---|---|---|---|---|---|
| 919 10th St | 0.00mi | 4/1.5 | 1,662 (0%) | 0mo | $60,000 | $36 | 100 |
| 1128 Gillett St | 0.17mi | 4/2.0 | 1,680 (+1%) | 1mo | $135,000 | $80 | 88 |
| 1102 Lapeer Ave | 0.19mi | 4/1.5 | 1,700 (+2%) | 1mo | $180,000 | $106 | 86 |
| 1111 Pearl St | 0.28mi | 4/1.0 | 1,489 (-10%) | 1mo | $155,000 | $104 | 67 |
| 1324 Pine St | 0.29mi | 3/2.0 (-1) | 1,800 (+8%) | 1mo | $215,000 | $119 | 65 |
| 1132 Griswold St | 0.49mi | 4/2.0 | 1,560 (-6%) | 2mo | $113,000 | $72 | 63 |
| 1133 Chestnut St | 0.34mi | 3/1.5 (-1) | 1,430 (-14%) | 1mo | $180,000 | $126 | 55 |
| 1226 Young St | 0.53mi | 3/2.0 (-1) | 1,482 (-11%) | 1mo | $170,500 | $115 | 50 |
| 1022 17th St | 0.54mi | 3/1.5 (-1) | 1,453 (-13%) | 2mo | $165,000 | $114 | 47 |
| 1127 Minnie St | 0.65mi | 4/2.0 | 1,870 (+12%) | 2mo | $175,000 | $94 | 45 |
| 1822 Wall St | 0.67mi | 3/2.0 (-1) | 1,876 (+13%) | 1mo | $199,900 | $107 | 40 |
| 1914 Howard St | 0.72mi | 3/3.5 (-1) | 1,508 (-9%) | 2mo | $205,000 | $136 | 37 |
Match score weights: distance 35% · size 25% · config 20% · recency 20%. Top-matched comps best support the ARV.
Projected returns pro-forma
-3.0% appreciation · 3.61% rent growth · sell at horizon
- IRR
- 32.5%
- Equity multiple
- 2.38×
- Total profit
- $26,661
- Equity at exit
- $10,288
- IRR
- 39.9%
- Equity multiple
- 4.87×
- Total profit
- $74,862
- Equity at exit
- $5,966
Cash invested: $19,320 (down + closing). Projections, not guarantees.
Landlord ↔ Tenant lean methodology
- Overall (STATE)
- 62 Landlord-Friendly
- State Michigan
- 62 Landlord-Friendly · EVEN
- County
- — inherits STATE
- City
- — inherits STATE
ZIP-level market 48060
- Rents YoY
- 3.6%
- Active inventory
- 220
- Price-to-rent
- 3.9×
Monthly cashflow live
- Estimated rent
- $1,493 medium interval (Pro) →
- Mortgage (P&I)
- −$362
- Tax from tax record
- −$145 /mo · $1,735/yr
- Insurance
- −$29
- Flood insurance flood zone
- −$66 /mo · $798/yr
- HOA
- −$0
- Vacancy / Maint / Mgmt
- −$314
- Net cashflow
- $578
Break-even live
UW: 25.0% down · 7.5% · 30yr · 1.5% tax · 5.0% vac · 8.0% maint · 8.0% mgmt
Financing live
Cash to close
- Down payment
- $17,250
- Closing costs
- $2,070
- Reserves months
- —
- Total cash needed
- —
Loan-product check · same deal, 3 products live
Conventional
25% down · 7.5% · 30yr
- Down + closing
- —
- Monthly P&I
- —
- Monthly cashflow
- —
- DSCR
- —
- Eligible?
- —
Personal DTI + credit; lowest rate.
DSCR
20% down · 8.5% · 30yr
- Down + closing
- —
- Monthly P&I
- —
- Monthly cashflow
- —
- DSCR
- —
- Eligible?
- —
No personal income docs; deal must DSCR.
Hard money
10% down · 12.0% · 12mo
- Down + closing
- —
- Monthly P&I
- —
- Monthly cashflow
- —
- DSCR
- —
- Eligible?
- —
Short-term bridge; refi at stabilization.
Rent comps 3 comps
| Address | Beds | Baths | Sqft | Rent | $/sqft | DOM | Units | Dist |
|---|---|---|---|---|---|---|---|---|
| 937 Howard St Port Huron, MI | 3.0 | 1.0 | 1080 | $1,500 | $1.39 | 18d | 1 | 0.05mi |
| 909 Stone St Unit 1 Port Huron, MI | 3.0 | 1.0 | 1100 | $1,250 | $1.14 | 43d | 1 | 0.66mi |
| 516 Glenwood Ave Port Huron, MI | 3.0 | 1.5 | 2000 | $1,300 | $0.65 | 24d | 1 | 0.68mi |
Listing history 36 events
-
2026-06-09days on market $69,000 Active 131 DOM
-
2026-06-08days on market $69,000 Active 130 DOM
-
2026-06-07days on market $69,000 Active 129 DOM
-
2026-06-04days on market $69,000 Active 126 DOM
-
2026-06-03days on market $69,000 Active 125 DOM
-
2026-06-02days on market $69,000 Active 124 DOM
-
2026-06-01days on market $69,000 Active 123 DOM
-
2026-05-31days on market $69,000 Active 122 DOM
-
2026-05-20price $69,000 279-char remark
Show marketing remark (279 chars)
HUGE HOME! CASH ONLY. 4 BEDROOMS. 1.5 BATH. GREAT SIZE FAMILY HOME OR INVESMENT PROPERTY. WOULD BE A GREAT RENTAL OR FLIP. BEAUITFUL WALK IN STAIRWAY, HUGE FAMILY AND LIVING ROOM AND GREAT ROOM WITH FIREPLACE. 2WAY STAIRS FOR CONVENIENCE. SHED IN BACK. 2 EXTERIOR DOOR ENTRANCES!
-
2026-05-19price $69,000 279-char remark
Show marketing remark (279 chars)
HUGE HOME! CASH ONLY. 4 BEDROOMS. 1.5 BATH. GREAT SIZE FAMILY HOME OR INVESMENT PROPERTY. WOULD BE A GREAT RENTAL OR FLIP. BEAUITFUL WALK IN STAIRWAY, HUGE FAMILY AND LIVING ROOM AND GREAT ROOM WITH FIREPLACE. 2WAY STAIRS FOR CONVENIENCE. SHED IN BACK. 2 EXTERIOR DOOR ENTRANCES!
-
2026-05-01price $69,900 279-char remark
Show marketing remark (279 chars)
HUGE HOME! CASH ONLY. 4 BEDROOMS. 1.5 BATH. GREAT SIZE FAMILY HOME OR INVESMENT PROPERTY. WOULD BE A GREAT RENTAL OR FLIP. BEAUITFUL WALK IN STAIRWAY, HUGE FAMILY AND LIVING ROOM AND GREAT ROOM WITH FIREPLACE. 2WAY STAIRS FOR CONVENIENCE. SHED IN BACK. 2 EXTERIOR DOOR ENTRANCES!
-
2026-04-30price $69,900 279-char remark
Show marketing remark (279 chars)
HUGE HOME! CASH ONLY. 4 BEDROOMS. 1.5 BATH. GREAT SIZE FAMILY HOME OR INVESMENT PROPERTY. WOULD BE A GREAT RENTAL OR FLIP. BEAUITFUL WALK IN STAIRWAY, HUGE FAMILY AND LIVING ROOM AND GREAT ROOM WITH FIREPLACE. 2WAY STAIRS FOR CONVENIENCE. SHED IN BACK. 2 EXTERIOR DOOR ENTRANCES!
-
2026-03-21price $75,000 279-char remark
Show marketing remark (279 chars)
HUGE HOME! CASH ONLY. 4 BEDROOMS. 1.5 BATH. GREAT SIZE FAMILY HOME OR INVESMENT PROPERTY. WOULD BE A GREAT RENTAL OR FLIP. BEAUITFUL WALK IN STAIRWAY, HUGE FAMILY AND LIVING ROOM AND GREAT ROOM WITH FIREPLACE. 2WAY STAIRS FOR CONVENIENCE. SHED IN BACK. 2 EXTERIOR DOOR ENTRANCES!
-
2026-03-20price $75,000 279-char remark
Show marketing remark (279 chars)
HUGE HOME! CASH ONLY. 4 BEDROOMS. 1.5 BATH. GREAT SIZE FAMILY HOME OR INVESMENT PROPERTY. WOULD BE A GREAT RENTAL OR FLIP. BEAUITFUL WALK IN STAIRWAY, HUGE FAMILY AND LIVING ROOM AND GREAT ROOM WITH FIREPLACE. 2WAY STAIRS FOR CONVENIENCE. SHED IN BACK. 2 EXTERIOR DOOR ENTRANCES!
-
2026-02-19price $57,000 279-char remark
Show marketing remark (279 chars)
HUGE HOME! CASH ONLY. 4 BEDROOMS. 1.5 BATH. GREAT SIZE FAMILY HOME OR INVESMENT PROPERTY. WOULD BE A GREAT RENTAL OR FLIP. BEAUITFUL WALK IN STAIRWAY, HUGE FAMILY AND LIVING ROOM AND GREAT ROOM WITH FIREPLACE. 2WAY STAIRS FOR CONVENIENCE. SHED IN BACK. 2 EXTERIOR DOOR ENTRANCES!
-
2026-02-18price $57,000 279-char remark
Show marketing remark (279 chars)
HUGE HOME! CASH ONLY. 4 BEDROOMS. 1.5 BATH. GREAT SIZE FAMILY HOME OR INVESMENT PROPERTY. WOULD BE A GREAT RENTAL OR FLIP. BEAUITFUL WALK IN STAIRWAY, HUGE FAMILY AND LIVING ROOM AND GREAT ROOM WITH FIREPLACE. 2WAY STAIRS FOR CONVENIENCE. SHED IN BACK. 2 EXTERIOR DOOR ENTRANCES!
-
2026-01-29$69,000 Active 279-char remark
Show marketing remark (279 chars)
HUGE HOME! CASH ONLY. 4 BEDROOMS. 1.5 BATH. GREAT SIZE FAMILY HOME OR INVESMENT PROPERTY. WOULD BE A GREAT RENTAL OR FLIP. BEAUITFUL WALK IN STAIRWAY, HUGE FAMILY AND LIVING ROOM AND GREAT ROOM WITH FIREPLACE. 2WAY STAIRS FOR CONVENIENCE. SHED IN BACK. 2 EXTERIOR DOOR ENTRANCES!
-
2026-01-23soldstatus $27,500 Closed
-
2026-01-23soldstatus $27,500 Closed
-
2026-01-16status Pending
-
2026-01-16status Pending
-
2025-12-15$60,000 Active
-
2025-12-15$60,000 Active
-
2011-11-28soldstatus $7,050
-
2011-11-17historical
-
2011-11-05historical
-
2011-11-04$7,000
-
2011-08-31$9,900
-
2011-04-06historical
-
2011-01-24$13,900
-
2010-10-19soldstatus $4,350
-
2010-10-19soldstatus $4,350
-
2010-10-18historical
-
2010-07-09$19,900
-
2010-07-09$19,900
ⓘ Source: listings_history table (triggers on properties + properties_extension) + one-shot
backfill from property_details.listing_events for pre-trigger history.
Tax reassessment forecast MI · Partial reset (capped growth)
- Current annual tax
- $1,735 · $145/mo
- Projected year-2 tax
- $1,735 · $145/mo
- Expected delta
- $0/yr ($0/mo · 0.0%)
ⓘ Screening estimate from a state-policy table — verify with the county assessor before closing.
Climate risk First Street
- Flood 7/10 Severe FEMA zone X (unshaded) · 77% chance over 30 yrs
- Wildfire 1/10 Low
- Heat 2/10 Low 7 d/yr ≥98°F today · 13 d/yr by 30 yrs out
- Wind 1/10 Low
- Air quality 2/10 Low 1 unhealthy d/yr today · 2 by 30 yrs out
Nearby sold comps map
Loading sold comps map…
Walkable amenities ~0.75 mi
Loading nearby amenities…
Taxation est. · year 1
- Rental income
- $17,920
- − Mortgage interest
- −$3,865
- − Property taxes
- −$1,735
- − Insurance
- −$1,142
- − Repairs & maintenance
- −$1,434
- − Management
- −$1,434
- − Depreciation
- −$2,007
- Taxable income
- $6,303
- Est. tax owed @ 24.0%
- −$1,513
- After-tax cash flow
- $5,425/yr
For passive investors: Depreciation is non-cash, so a rental often shows a tax loss while cash-flowing — sheltering income. Rental losses are passive: they offset passive income freely, and up to $25,000/yr can offset ordinary (W-2) income if you actively participate and your MAGI is under $100k (phasing out to $0 by $150k); unused losses carry forward. On sale, claimed depreciation is recaptured at up to 25%, and gains may owe capital-gains tax (a 1031 exchange can defer both). Figures are a year-1 estimate at your 24.0% rate — not tax advice; consult a CPA.
Schools (NCES district)
- District
- Port Huron Area School District
- NCES district ID
- 2628830
- Math proficiency
- 23% ▼ -5.00%
- Reading proficiency
- 37% ▼ -2.00%
- Median HH income
- $42,093
- Composite
- 25.4/100
- National rank
- #7462
- State rank
- #368 of 540 in MI
Livability — Port Huron
- Score
- 65/100
- State rank
- #445
- US rank
- #12478
Category grades
Schools grade is shown separately in the Schools card above.
Census & demographics
- Census place
- Port Huron, MI
- County
- Saint Clair County · 44,760 people
- City population
- 39,342
- Metro
- Detroit-Warren-Dearborn, MI
- Population (ZIP)
- 39,342
- Household income
- $53,018
- Rent vs Own
- Severe rent burden
- 1808.0
Population outlook (St. Clair County) Hauer SSP2
- Today (2025)
- 154,587 people
- By 2030
- 150,031 · -2.9%
- By 2040
- 138,177 · -10.6%
- By 2050
- 124,390 · -19.5%
- By 2075
- 95,825 · -38.0%
- By 2100
- 68,672 · -55.6%
Race, ethnicity, and origin ACS 2023
- Neighborhood character
- Predominantly White (80%)
- Race & ethnicity
- White 80% Black 7% Two or more races 7% Hispanic / Latino 6%
- Hispanic origin (detail)
- Mexican 4%
- Common ancestry
- Romanian 6% Lithuanian 4% Slovak 3%
- Foreign-born
- 2% · Canada
- Languages at home
- 97% English-only · Spanish 2%
Political lean MEDSL · St. Clair
- 2024 margin
- Solid R (+34.6) · D 32.0% · R 66.6% · Other 1.4%
- 2008→2024 swing
- -37.3pp toward R · 2008: 2.6pp · 2024: -34.6pp
- All cycles
- 2024: R+34.6 2020: R+30.2 2016: R+31.4 2012: R+7.1 2008: D+2.6
Not yet ingested
- Civics
- —
Market trends
- HPI YoY
- ▼ -134.75%
- Current HPI
- 177.2401
- Rent YoY
- ▲ 3.61%
- Metro
- Detroit-Warren-Dearborn, MI
- State GDP YoY
- ▲ 1.37%
- F500 in state
- 28
Industry mix (Fortune 500 HQ in MI)
| Industry | F500 HQs | Revenue |
|---|---|---|
| Automotive Parts | 3 | $48B |
|
||
| Automotive | 2 | $372B |
|
||
| Chemicals | 1 | $45B |
|
||
| Automotive Retail | 1 | $29B |
|
||
| Healthcare / Medical Devices | 1 | $23B |
|
||
| Automotive Technology | 1 | $20B |
|
||
Price history
+246.7% since first listed28 events — show timeline
- 2026-05-20 Price Changed $69,000 MiRealSource-MiMLS
- 2026-05-19 Price Changed $69,000 REALCOMP
- 2026-05-01 Price Changed $69,900 MiRealSource-MiMLS
- 2026-04-30 Price Changed $69,900 REALCOMP
- 2026-03-21 Price Changed $75,000 MiRealSource-MiMLS
- 2026-03-20 Price Changed $75,000 REALCOMP
- 2026-02-19 Price Changed $57,000 MiRealSource-MiMLS
- 2026-02-18 Price Changed $57,000 REALCOMP
- 2026-01-29 Listed $69,000 REALCOMP
- 2026-01-29 Listed $69,000 MiRealSource-MiMLS
- 2026-01-23 Sold (MLS) $27,500 MiRealSource-MiMLS
- 2026-01-23 Sold (MLS) $27,500 REALCOMP
- 2026-01-16 Pending — MiRealSource-MiMLS
- 2026-01-16 Pending — REALCOMP
- 2025-12-15 Listed $60,000 MiRealSource-MiMLS
- 2025-12-15 Listed $60,000 REALCOMP
- 2011-11-28 Sold (MLS) $7,050 MiRealSource-MiMLS
- 2011-11-17 Listing Removed — MiRealSource-MiMLS
- 2011-11-05 Listing Removed — MiRealSource-MiMLS
- 2011-11-04 Listed $7,000 MiRealSource-MiMLS
- 2011-08-31 Listed $9,900 MiRealSource-MiMLS
- 2011-04-06 Listing Removed — MiRealSource-MiMLS
- 2011-01-24 Listed $13,900 MiRealSource-MiMLS
- 2010-10-19 Sold (MLS) $4,350 MiRealSource-MiMLS
- 2010-10-19 Sold (MLS) $4,350 REALCOMP
- 2010-10-18 Listing Removed — MiRealSource-MiMLS
- 2010-07-09 Listed $19,900 MiRealSource-MiMLS
- 2010-07-09 Listed $19,900 REALCOMP
Property tax history
+3.6%/yrLatest (2025): $1,735 · -5.3% YoY. Source: county tax records.
Cash-flow waterfall
monthlySold comps — $/sqft
last 12 mo · ≤1 miLoading sold comps…