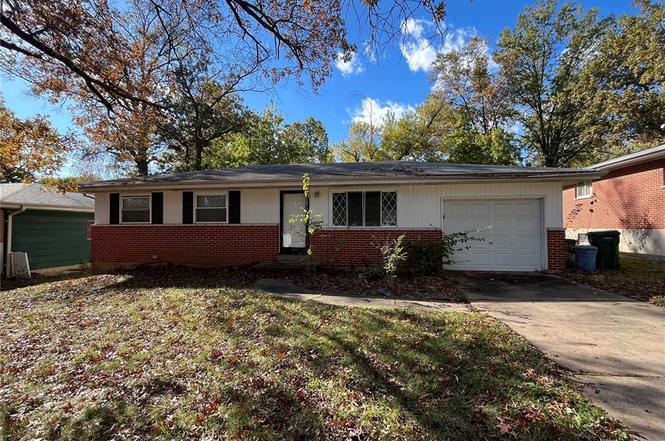
10133 Maraldo Pl · Bellefontaine Neighbors, MO
Flood risk 1/10 · Minimal
- FEMA flood zone
- X (unshaded)
- Chance of flooding over 30 yrs
- 0.0%
- Est. flood insurance / yr
- $473 – $860
Fire risk 1/10 · Minimal
- Est. fire insurance / yr
- $1,054 – $1,958
Heat risk 5/10 · Moderate
- Hot days now (above 107°F)
- 7 days/yr
- Hot days in 30 yrs
- 21 days/yr
Wind risk 2/10 · Minimal
- Chance of severe wind over 30 yrs
- 1.0%
Air-quality risk 4/10 · Minor
- Unhealthy air days now
- 4 days/yr
- Unhealthy air days in 30 yrs
- 5 days/yr
Risk factors via First Street. Map © Google.
Why this score? — see what drove the B grade
The composite is a weighted blend of 9 inputs, each scored 0–100. Each bar is that input's sub-score; the figure is the points it added to the 100-point composite (weight × sub-score).
- Cash flow +30.0/30.0
- ARV discount +15.0/15.0
- 1% rule +10.0/10.0
- DSCR +10.0/10.0
- Rent growth +4.1/5.0
- Livability +2.9/5.0
- Condition / age +2.5/5.0
- Schools +0.4/10.0
- Appreciation +0.0/10.0
$64,900
🖨 Deal sheet 📄 Offer letter ✓ Due diligence
Listing remarks MLS
Welcome to 10133 Maraldo Place. This home is located on a nice, quiet, dead end street and has been very well taken care of for a long time. This is a perfect, move in ready home for a fantastic price. Features include: hardwood floors throughout, newer double pane windows, new vanities, sinks, faucets and toilets in the bathrooms, new stainless steel dishwasher and stainless steel cooktop. All systems are in good, working condition. Backyard is perfect for entertaining. This home has a lot to offer, schedule your showing today!
Key facts
- 7,875 sq ft lot
- Garage
- Built 1962
Neighborhood map
What this means for you Summary
Snapshot
- This is a 3-bed/1.5-bath single-family listed at $65k.
Deal economics
- At list price, monthly cash flow is $592 ($7k/yr) — positive.
- The deal already cash-flows at list — no discount required.
- Meets the 1% rule at list price ($1k rent vs $65k).
- Recommended offer: $64k (1.5% below list) — sets the bar for market timing.
- Cap rate 17.2% vs local median 9.5% in Bellefontaine Neighbors — top-decile yield for the area; either an underpriced asset or a hidden risk that comps aren't pricing in. Stress-test before assuming the spread holds.
Location & tenants
- Location reads 58/100 on livability (#592 in MO) — a working-class tenant base; expect higher turnover. Strengths: cost of living A+, housing B+; Watch: employment D+, crime F, amenities F.
- Riverview Gardens (suburban): math 2% / reading 9% proficiency, ranked #324 of 324 in MO (top 100%) — low school quality limits family demand, transient renter base, plan for 1-2y turnover; 90% free/reduced lunch — lower-income household profile, screen leases tightly.
- Zoned schools: Gibson Elem. (math 0% / reading 7%, grade F, #1,097 of 1,115 statewide, top 98%, 429 students, 99% FRL); Riverview Gardens Sr. High (math 2% / reading 18%, grade F, #501 of 521 statewide, top 97%, 1,331 students, 100% FRL).
- Market conditions: Rents rising fast (+6.6%/yr); 201 active listings in the ZIP; 40 comparable units currently listed for rent nearby; rentals at typical pace (median 24d on market — plan ~3-4 weeks tenant-placement turnaround); 42% of comp listings sitting > 30 days — soft ceiling on asking rent; lower-income renter base — watch delinquency; 920 units permitted in St. Louis County in 2024 (250 in 5+ unit buildings).
- This rent runs 39% of the median local income ($43k/yr) — at the standard rent-burdened threshold; future hikes will face affordability resistance.
Forward outlook
- Local home prices are declining (-3.0%/yr); year-one equity from $449 of loan paydown is wiped out by about $2k of value loss. Plan a longer hold.
- At projected returns (-3.0% appreciation + 6.6% rent growth), your $18k cash investment doubles in ~3 years — after that, you're playing with house money.
Negotiation context
- It's been on market 17 days — a 2% lower offer ($64k) is reasonable based on typical stale-listing flexibility.
- 3 sale attempts since 12y ago with the ask held roughly flat each time — persistent listings suggest the price (not the market) is what's stuck; bring a comps-based counter.
- Current owner paid $52k; 25% above their basis — modest negotiation headroom, anchor on the comps not their cost.
Risks & watch-outs
- Watch-outs: property tax is 2.8% of price.
- Climate carrying-cost: extreme-heat days projected 7→21/yr by 2055 (HVAC capex compounding) — expect insurance premiums to compound above CPI over the hold.
Questions for the listing agent
- Built in 1962 — when were the roof, HVAC, electrical panel, plumbing, and water heater last replaced?
- Property tax is high relative to price — has the assessment been appealed recently, and will the sale trigger a re-assessment?
- Is there a deadline driving the sale (1031 exchange, divorce, estate, relocation)? That informs how much negotiation room exists.
- Schools are F-rated, which usually means shorter tenancies and higher turnover. Who's the typical renter profile here, and what's been the actual vacancy rate?
- Crime grade is F in this area — have there been break-ins, vandalism, or insurance claims at this property in the last 3 years? What carrier currently insures it and at what premium?
- What's the average days-on-market for RENTAL listings here right now (not sales)? A rising rental-DOM trend means longer vacancies and softer asking-rent achievability than the comps imply.
- What's the recent tenant-quality profile in this submarket — average credit score on applications, eviction rate, late-payment / NSF rate, and stable-employment percentage? A property-management company in the area should have these aggregated.
- How much new for-sale + rental construction is in the pipeline within 1–3 miles? Heavy new supply typically softens prices + rents 12–24 months out; constrained supply supports both.
Investment metrics
- 1% rule
- 2.17% ✓
- Cap rate
- 17.24%
- Cash-on-cash
- 39.09%
- DSCR
- 2.74
- GRM
- 3.8
CMA / ARV
- ARV (on-the-fly)
- $124,875
- Comps found
- 12
Show comp detail 12 sales within ~0.75 mi
| Address | Dist | Beds/Ba | Sqft | Sold | Price | $/sf | Match |
|---|---|---|---|---|---|---|---|
| 10130 Newbold Dr | 0.22mi | 3/1.0 | 984 (-2%) | 2mo | $144,900 | $147 | 84 |
| 534 Alcove Ave | 0.41mi | 3/1.0 | 996 (-0%) | 3mo | $104,200 | $105 | 76 |
| 1033 Bakewell Dr | 0.33mi | 2/1.0 (-1) | 992 (-1%) | 3mo | $99,900 | $101 | 74 |
| 10307 Seaton Dr | 0.31mi | 3/1.5 | 932 (-7%) | 1mo | $142,000 | $152 | 73 |
| 10505 Druid Dr | 0.63mi | 3/1.0 | 1,008 (+1%) | 1mo | $115,000 | $114 | 66 |
| 1236 Bliss Dr | 0.57mi | 3/1.0 | 944 (-6%) | 0mo | $118,000 | $125 | 62 |
| 10066 Dorothy Ave | 0.35mi | 2/1.0 (-1) | 916 (-8%) | 1mo | $99,900 | $109 | 62 |
| 10201 Gourock Dr | 0.54mi | 3/1.0 | 932 (-7%) | 3mo | $110,000 | $118 | 59 |
| 10128 Ashbrook Dr | 0.62mi | 3/1.0 | 912 (-9%) | 0mo | $130,000 | $143 | 54 |
| 1140 Nectar Dr | 0.68mi | 3/1.0 | 912 (-9%) | 1mo | $135,000 | $148 | 51 |
| 10522 Byfield Dr | 0.74mi | 2/1.0 (-1) | 1,038 (+4%) | 1mo | $99,900 | $96 | 51 |
| 10555 Gourock Dr | 0.74mi | 3/2.0 | 918 (-8%) | 3mo | $120,000 | $131 | 48 |
Match score weights: distance 35% · size 25% · config 20% · recency 20%. Top-matched comps best support the ARV.
Projected returns pro-forma
-3.0% appreciation · 6.59% rent growth · sell at horizon
- IRR
- 39.6%
- Equity multiple
- 2.79×
- Total profit
- $32,519
- Equity at exit
- $9,677
- IRR
- 47.9%
- Equity multiple
- 6.53×
- Total profit
- $100,409
- Equity at exit
- $5,611
Cash invested: $18,172 (down + closing). Projections, not guarantees.
Landlord ↔ Tenant lean methodology
- Overall (STATE)
- 81 Strongly Landlord-Friendly
- State Missouri
- 81 Strongly Landlord-Friendly · R+10
- County
- — inherits STATE
- City
- — inherits STATE
ZIP-level market 63137
- Rents YoY
- 6.6%
- Active inventory
- 201
- Price-to-rent
- 3.8×
Monthly cashflow live
- Estimated rent
- $1,408 high interval (Pro) →
- Mortgage (P&I)
- −$340
- Tax from tax record
- −$153 /mo · $1,835/yr
- Insurance
- −$27
- HOA
- −$0
- Vacancy / Maint / Mgmt
- −$296
- Net cashflow
- $592
Break-even live
UW: 25.0% down · 7.5% · 30yr · 1.5% tax · 5.0% vac · 8.0% maint · 8.0% mgmt
Financing live
Cash to close
- Down payment
- $16,225
- Closing costs
- $1,947
- Reserves months
- —
- Total cash needed
- —
Loan-product check · same deal, 3 products live
Conventional
25% down · 7.5% · 30yr
- Down + closing
- —
- Monthly P&I
- —
- Monthly cashflow
- —
- DSCR
- —
- Eligible?
- —
Personal DTI + credit; lowest rate.
DSCR
20% down · 8.5% · 30yr
- Down + closing
- —
- Monthly P&I
- —
- Monthly cashflow
- —
- DSCR
- —
- Eligible?
- —
No personal income docs; deal must DSCR.
Hard money
10% down · 12.0% · 12mo
- Down + closing
- —
- Monthly P&I
- —
- Monthly cashflow
- —
- DSCR
- —
- Eligible?
- —
Short-term bridge; refi at stabilization.
Rent comps 40 comps
| Address | Beds | Baths | Sqft | Rent | $/sqft | DOM | Units | Dist |
|---|---|---|---|---|---|---|---|---|
| 10203 Trio Ln Saint Louis, MO | 3.0 | 1.0 | 912 | $1,435 | $1.57 | 16d | 1 | 0.16mi |
| 815 Bella Ln Saint Louis, MO | 3.0 | 1.0 | 864 | $1,275 | $1.48 | 43d | 1 | 0.30mi |
| 1009 Bliss Dr Saint Louis, MO | 3.0 | 1.0 | 912 | $1,400 | $1.54 | 43d | 1 | 0.33mi |
| 10066 Dorothy Ave Saint Louis, MO | 2.0 | 1.0 | 916 | $1,225 | $1.34 | 21d | 1 | 0.35mi |
| 10200 Tappan Dr Saint Louis, MO | 3.0 | 1.0 | 912 | $1,450 | $1.59 | 16d | 1 | 0.35mi |
| 10367 Coburg Lands Dr Saint Louis, MO | 3.0 | 1.0 | 912 | $1,270 | $1.39 | 43d | 1 | 0.38mi |
| 1115 Bakewell Dr Saint Louis, MO | 3.0 | 1.0 | 916 | $1,300 | $1.42 | 43d | 1 | 0.42mi |
| 10201 Gourock Dr Saint Louis, MO | 3.0 | 1.0 | 886 | $1,275 | $1.44 | 43d | 1 | 0.52mi |
| 1205 Shepley Dr Saint Louis, MO | 3.0 | 1.0 | 901 | $1,350 | $1.50 | 43d | 1 | 0.55mi |
| 1205 Shepley Dr Saint Louis, MO | 3.0 | 1.0 | 901 | $1,325 | $1.47 | 23d | 1 | 0.55mi |
| 10421 Gardo Ct Saint Louis, MO | 3.0 | 2.0 | 1000 | $1,395 | $1.40 | 14d | 1 | 0.56mi |
| 10401 Hobkirk Dr Saint Louis, MO | 3.0 | 1.0 | 1050 | $1,500 | $1.43 | 17d | 1 | 0.57mi |
| 10508 Druid Dr Saint Louis, MO | 3.0 | 1.0 | 1122 | $1,475 | $1.31 | 16d | 1 | 0.59mi |
| 9943 Lilac Dr Saint Louis, MO | 2.0 | 1.0 | 1086 | $1,000 | $0.92 | 43d | 1 | 0.60mi |
| 1230 Roxton Dr Saint Louis, MO | 3.0 | 1.0 | 912 | $1,400 | $1.54 | 21d | 1 | 0.60mi |
| 1253 Avant Dr Saint Louis, MO | 2.0 | 1.0 | 795 | $1,295 | $1.63 | 17d | 1 | 0.61mi |
| 1253 Avant Dr Saint Louis, MO | 2.0 | 1.0 | 795 | $1,295 | $1.63 | 14d | 1 | 0.61mi |
| 743 Shepley Dr Saint Louis, MO | 3.0 | 1.0 | 932 | $1,025 | $1.10 | 7d | 1 | 0.61mi |
| 1255 Bosworth Dr Saint Louis, MO | 3.0 | 1.0 | 1071 | $1,575 | $1.47 | 10d | 1 | 0.61mi |
| 9924 Gloucester Dr Saint Louis, MO | 3.0 | 2.0 | 992 | $1,565 | $1.58 | 10d | 1 | 0.63mi |
| 1208 Rapid Dr Saint Louis, MO | 3.0 | 1.0 | 992 | $1,375 | $1.39 | 4d | 1 | 0.66mi |
| 10213 Durness Dr Saint Louis, MO | 2.0 | 1.0 | 932 | $1,225 | $1.31 | 43d | 1 | 0.66mi |
| 10327 Renfrew Dr Saint Louis, MO | 3.0 | 1.0 | 844 | $1,199 | $1.42 | 43d | 1 | 0.77mi |
| 9811 Lilac Dr Unit I St. Louis, MO | 2.0 | 1.0 | 705 | $799 | $1.13 | 43d | 1 | 0.79mi |
| 1130 Forest Home Dr Saint Louis, MO | 3.0 | 1.0 | 1025 | $1,275 | $1.24 | 43d | 1 | 0.81mi |
| 10524 Durness Dr Saint Louis, MO | 3.0 | 1.0 | 1000 | $1,250 | $1.25 | 43d | 1 | 0.81mi |
| 623 Ludlow Dr Saint Louis, MO | 2.0 | 1.0 | 840 | $1,199 | $1.43 | 23d | 1 | 0.81mi |
| 10519 Renfrew Dr Saint Louis, MO | 3.0 | 1.5 | 982 | $1,399 | $1.42 | 43d | 1 | 0.83mi |
| 10309 Galloway Dr Saint Louis, MO | 3.0 | 1.0 | 892 | $1,295 | $1.45 | 12d | 1 | 0.83mi |
| 437 Lancashire Rd Saint Louis, MO | 3.0 | 1.0 | 1082 | $1,395 | $1.29 | 43d | 1 | 0.84mi |
| 255 Chambers Rd St. Louis, MO | 2.0 | 1.0 | 700 | $850 | $1.21 | 43d | 1 | 0.84mi |
| 457 Shepley Dr Saint Louis, MO | 3.0 | 1.0 | 854 | $1,350 | $1.58 | 23d | 1 | 0.86mi |
| 1520 Attica Dr Saint Louis, MO | 2.0 | 1.0 | 1062 | $1,200 | $1.13 | 23d | 1 | 0.87mi |
| 432 Midlothian Rd Saint Louis, MO | 3.0 | 1.0 | 1120 | $1,350 | $1.21 | 10d | 1 | 0.88mi |
| 416 Crawford Rd Saint Louis, MO | 3.0 | 1.0 | 844 | $1,499 | $1.78 | 23d | 1 | 0.89mi |
| 10063 Northgate Dr Saint Louis, MO | 2.0 | 1.0 | 1054 | $1,200 | $1.14 | 43d | 1 | 0.94mi |
| 10518 Gretna Cir Saint Louis, MO | 3.0 | 1.0 | 1082 | $1,450 | $1.34 | 23d | 1 | 0.94mi |
| 10019 Northgate Dr Saint Louis, MO | 3.0 | 1.0 | 991 | $1,150 | $1.16 | 21d | 1 | 0.96mi |
| 409 Shepley Dr Saint Louis, MO | 3.0 | 1.0 | 854 | $1,095 | $1.28 | 4d | 1 | 0.97mi |
| 460 Bluff Dr Saint Louis, MO | 3.0 | 1.0 | 1002 | $1,300 | $1.30 | 43d | 1 | 0.98mi |
Listing history 8 events
-
2025-12-11status Pending
-
2025-11-24$64,900 Active
-
2025-02-21status Pending
-
2025-01-06$109,900 Active
-
2014-11-20soldstatus $52,000
-
2014-11-14soldstatus 534-char remark
Show marketing remark (534 chars)
Welcome to 10133 Maraldo Place. This home is located on a nice, quiet, dead end street and has been very well taken care of for a long time. This is a perfect, move in ready home for a fantastic price. Features include: hardwood floors throughout, newer double pane windows, new vanities, sinks, faucets and toilets in the bathrooms, new stainless steel dishwasher and stainless steel cooktop. All systems are in good, working condition. Backyard is perfect for entertaining. This home has a lot to offer, schedule your showing today!
-
2014-07-25$53,900 534-char remark
Show marketing remark (534 chars)
Welcome to 10133 Maraldo Place. This home is located on a nice, quiet, dead end street and has been very well taken care of for a long time. This is a perfect, move in ready home for a fantastic price. Features include: hardwood floors throughout, newer double pane windows, new vanities, sinks, faucets and toilets in the bathrooms, new stainless steel dishwasher and stainless steel cooktop. All systems are in good, working condition. Backyard is perfect for entertaining. This home has a lot to offer, schedule your showing today!
-
1962-10-08soldstatus
ⓘ Source: listings_history table (triggers on properties + properties_extension) + one-shot
backfill from property_details.listing_events for pre-trigger history.
Tax reassessment forecast MO · Resets to sale price
- Current annual tax
- $1,835 · $153/mo
- Projected year-2 tax
- $1,835 · $153/mo
- Expected delta
- $0/yr ($0/mo · 0.0%)
ⓘ Screening estimate from a state-policy table — verify with the county assessor before closing.
Climate risk First Street
- Flood 1/10 Low FEMA zone X (unshaded) · 0% chance over 30 yrs
- Wildfire 1/10 Low
- Heat 5/10 Major 7 d/yr ≥107°F today · 21 d/yr by 30 yrs out
- Wind 2/10 Low 100% chance of damaging wind over 30 yrs
- Air quality 4/10 Moderate 4 unhealthy d/yr today · 5 by 30 yrs out
Nearby sold comps map
Loading sold comps map…
Walkable amenities ~0.75 mi
Loading nearby amenities…
Taxation est. · year 1
- Rental income
- $16,895
- − Mortgage interest
- −$3,635
- − Property taxes
- −$1,835
- − Insurance
- −$324
- − Repairs & maintenance
- −$1,352
- − Management
- −$1,352
- − Depreciation
- −$1,888
- Taxable income
- $6,509
- Est. tax owed @ 24.0%
- −$1,562
- After-tax cash flow
- $5,541/yr
For passive investors: Depreciation is non-cash, so a rental often shows a tax loss while cash-flowing — sheltering income. Rental losses are passive: they offset passive income freely, and up to $25,000/yr can offset ordinary (W-2) income if you actively participate and your MAGI is under $100k (phasing out to $0 by $150k); unused losses carry forward. On sale, claimed depreciation is recaptured at up to 25%, and gains may owe capital-gains tax (a 1031 exchange can defer both). Figures are a year-1 estimate at your 24.0% rate — not tax advice; consult a CPA.
Schools (NCES district)
- District
- Riverview Gardens
- NCES district ID
- 2926670
- Math proficiency
- 2% ▼ -6.00%
- Reading proficiency
- 9% ▼ -6.00%
- Median HH income
- $32,759
- Composite
- 4.22/100
- National rank
- #10058
- State rank
- #324 of 324 in MO
Livability — Bellefontaine Neighbors
- Score
- 58/100
- State rank
- #592
- US rank
- #20944
Category grades
Schools grade is shown separately in the Schools card above.
Census & demographics
- Census place
- Bellefontaine Neighbors, MO
- County
- Saint Louis County · 888,823 people
- City population
- 19,684
- Metro
- St. Louis, MO-IL
- Population (ZIP)
- 19,684
- Household income
- $43,422
- Rent vs Own
- Severe rent burden
- 1863.0
Population outlook (St. Louis County) Hauer SSP2
- Today (2025)
- 1,025,227 people
- By 2030
- 1,028,023 · +0.3%
- By 2040
- 1,020,940 · -0.4%
- By 2050
- 1,007,280 · -1.8%
- By 2075
- 987,277 · -3.7%
- By 2100
- 921,984 · -10.1%
Race, ethnicity, and origin ACS 2023
- Neighborhood character
- Predominantly Black (82%)
- Race & ethnicity
- Black 82% White 13% Two or more races 3%
- Common ancestry
- Romanian 1% Lithuanian 1% Italian 1%
- Foreign-born
- 1%
Political lean MEDSL · St. Louis
- 2024 margin
- Strong D (+23.4) · D 60.8% · R 37.4% · Other 1.7%
- 2008→2024 swing
- +3.5pp toward D · 2008: 19.9pp · 2024: 23.4pp
- All cycles
- 2024: D+23.4 2020: D+24.0 2016: D+16.2 2012: D+13.7 2008: D+19.9
Not yet ingested
- Civics
- —
Market trends
- HPI YoY
- ▼ -96.70%
- Current HPI
- 130.6765
- Rent YoY
- ▲ 6.59%
- Metro
- St. Louis, MO-IL
- State GDP YoY
- ▲ 1.84%
- F500 in state
- 20
Industry mix (Fortune 500 HQ in MO)
| Industry | F500 HQs | Revenue |
|---|---|---|
| Healthcare | 1 | $163B |
|
||
| Insurance | 1 | $21B |
|
||
| Industrial Technology | 1 | $17B |
|
||
| Retail | 1 | $16B |
|
||
| Industrial Distribution | 1 | $10B |
|
||
| Utilities | 1 | $9B |
|
||
Price history
+20.4% since first listed8 events — show timeline
- 2025-12-11 Pending — MARIS as Distributed by MLS Grid
- 2025-11-24 Listed $64,900 MARIS as Distributed by MLS Grid
- 2025-02-21 Pending — MARIS as Distributed by MLS Grid
- 2025-01-06 Listed $109,900 MARIS as Distributed by MLS Grid
- 2014-11-20 Sold (Public Records) $52,000 Public Records
- 2014-11-14 Sold (MLS) — MARIS as Distributed by MLS Grid
- 2014-07-25 Listed $53,900 MARIS as Distributed by MLS Grid
- 1962-10-08 Sold (Public Records) — Public Records
Property tax history
+5.6%/yrLatest (2022): $1,835 · +0.9% YoY. Source: county tax records.
Cash-flow waterfall
monthlySold comps — $/sqft
last 12 mo · ≤1 miLoading sold comps…