 Multi-family
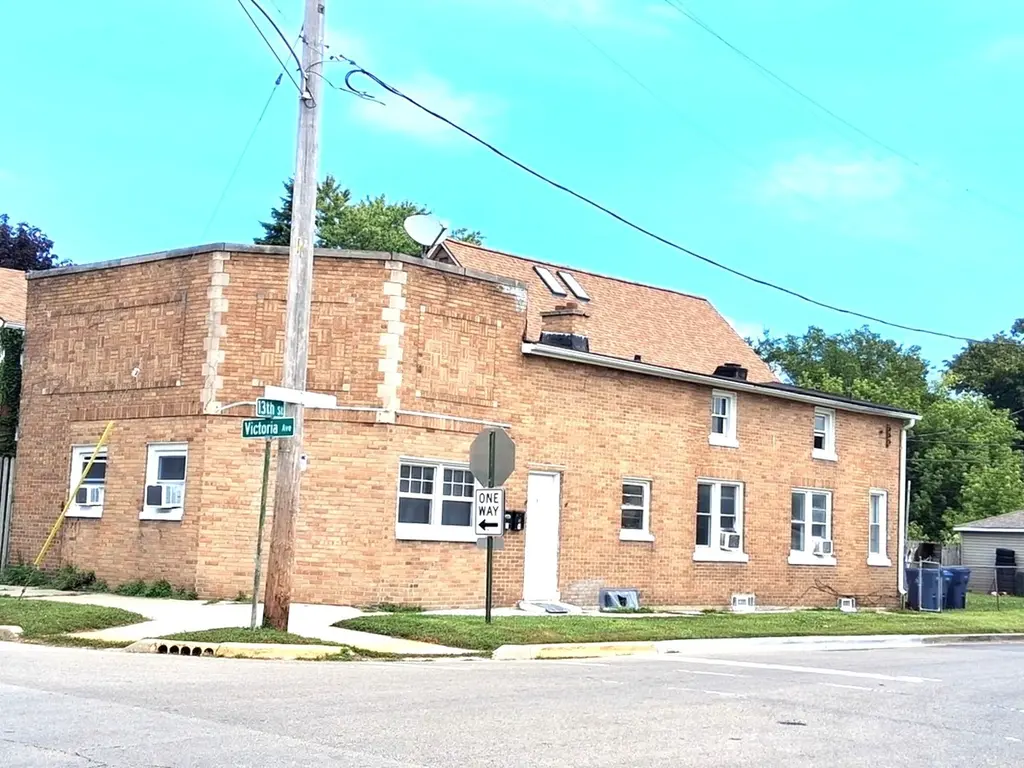
1247 Victoria Ave · North Chicago, IL
Flood risk 6/10 · Moderate
- FEMA flood zone
- X (unshaded)
- Chance of flooding over 30 yrs
- 0.7%
- Est. flood insurance / yr
- $473 – $860
Fire risk 1/10 · Minimal
- Est. fire insurance / yr
- $804 – $1,492
Heat risk 2/10 · Minimal
- Hot days now (above 97°F)
- 7 days/yr
- Hot days in 30 yrs
- 14 days/yr
Wind risk 2/10 · Minimal
- Chance of severe wind over 30 yrs
- —
Air-quality risk 4/10 · Minor
- Unhealthy air days now
- 4 days/yr
- Unhealthy air days in 30 yrs
- 5 days/yr
Risk factors via First Street. Map © Google.
Why this score? — see what drove the B grade
The composite is a weighted blend of 9 inputs, each scored 0–100. Each bar is that input's sub-score; the figure is the points it added to the 100-point composite (weight × sub-score).
- Cash flow +25.5/30.0
- ARV discount +15.0/15.0
- DSCR +8.4/10.0
- 1% rule +7.5/10.0
- Appreciation +4.2/10.0
- Livability +4.0/5.0
- Rent growth +2.5/5.0
- Condition / age +2.5/5.0
- Schools +0.9/10.0
$267,000
🖨 Deal sheet 📄 Offer letter ✓ Due diligence
Multi-family units
County records classify this as Multi-Family (2-4 Unit). Listing-text estimate: 1 unit. estimate disagrees with records
Listing remarks MLS
This property features 2 flats both on 1.5 story building with separate basements and utilities. Great opportunity to live in one an rent one, this is a brick exterior property with a 2 car Frame garage. Kitchens feature granite counter tops. Both Kitchens and baths along with both flats were rehabbed in '24. Great tenancies and ready to sell. Included is a W/D leased for extra income.
Key facts
- 3,725 sq ft lot
- Garage
- Built 1920
Neighborhood map
What this means for you Summary
Snapshot
- This is a 4-bed/2.0-bath multifamily listed at $267k.
Deal economics
- At list price, monthly cash flow is $623 ($7k/yr) — positive.
- The deal already cash-flows at list — no discount required.
- Meets the 1% rule at list price ($3k rent vs $267k).
- Recommended offer: $243k (9.0% below list) — sets the bar for market timing.
- Cap rate 9.1% vs local median 4.8% in North Chicago — top-decile yield for the area; either an underpriced asset or a hidden risk that comps aren't pricing in. Stress-test before assuming the spread holds.
Location & tenants
- Location reads 81/100 on livability (#95 in IL, #1,536 nationally) — a professional / high-income tenant draw. Strengths: commute A+, cost of living A+, housing A+; Watch: employment D+, schools F, amenities F.
- North Chicago SD 187 (suburban): math 8% / reading 13% proficiency, ranked #574 of 620 in IL (top 93%) — low school quality limits family demand, transient renter base, plan for 1-2y turnover; 78% free/reduced lunch — lower-income household profile, screen leases tightly.
- Market conditions: 25 active listings in the ZIP; 4 comparable units currently listed for rent nearby; rentals leasing fast (median 1d on market — plan ~1-2 weeks tenant-placement turnaround); 948 units permitted in Lake County in 2024 (424 in 5+ unit buildings).
Forward outlook
- Local home prices are declining (-1.6%/yr); year-one equity from $2k of loan paydown is wiped out by about $4k of value loss. Plan a longer hold.
- Lake County population projected to shrink 8% by 2050 — rents likely to lag national; underwrite the cash flow, not the appreciation.
- At projected returns (-1.6% appreciation + 3.0% rent growth), your $75k cash investment doubles in ~9 years — after that, you're playing with house money.
Negotiation context
- It's been on market 112 days — a 9% lower offer ($243k) is reasonable based on typical stale-listing flexibility.
- 10 sale attempts since 4y ago; this cycle's ask has dropped $23k (8%) from the opening price — seller is motivated, your offer sets the floor, not the list.
- Current owner paid $121k; list at $267k implies a 121% gain — meaningful room to come down on a strong offer.
Risks & watch-outs
- Watch-outs: built in 1920 — expect roof / HVAC / electrical / plumbing capex.
- Climate carrying-cost: major flood risk — expect insurance premiums to compound above CPI over the hold.
Questions for the listing agent
- It's been on market 112 days. Have you received any prior offers? Is the seller open to a 9% concession, seller financing, or rate buy-down credit?
- Built in 1920 — when were the roof, HVAC, electrical panel, plumbing, and water heater last replaced?
- Why hasn't it sold? Are there any deal-killer items the seller is aware of (foundation, flood, title, zoning, code violations)?
- Is there a deadline driving the sale (1031 exchange, divorce, estate, relocation)? That informs how much negotiation room exists.
- Schools are F-rated, which usually means shorter tenancies and higher turnover. Who's the typical renter profile here, and what's been the actual vacancy rate?
- What's the average days-on-market for RENTAL listings here right now (not sales)? A rising rental-DOM trend means longer vacancies and softer asking-rent achievability than the comps imply.
- What's the recent tenant-quality profile in this submarket — average credit score on applications, eviction rate, late-payment / NSF rate, and stable-employment percentage? A property-management company in the area should have these aggregated.
- How much new apartment / multifamily construction is in the pipeline within 1–3 miles? Heavy new supply (>2% of stock underway) typically softens rents 12–24 months out; light construction supports rent growth.
Investment metrics
- 1% rule
- 1.25% ✓
- Cap rate
- 9.09%
- Cash-on-cash
- 9.99%
- DSCR
- 1.44
- GRM
- 6.7
CMA / ARV
- ARV (median comp)
- $480,224
- List price
- $267,000
- Delta
- -44.40%
- Verdict
- UNDERPRICED
- Comps
- 4 within 1.0 mi
Projected returns pro-forma
-1.61% appreciation · 3.0% rent growth · sell at horizon
- IRR
- 3.9%
- Equity multiple
- 1.17×
- Total profit
- $12,474
- Equity at exit
- $56,755
- IRR
- 11.2%
- Equity multiple
- 2.03×
- Total profit
- $77,048
- Equity at exit
- $53,262
Cash invested: $74,760 (down + closing). Projections, not guarantees.
Landlord ↔ Tenant lean methodology
- Overall (STATE)
- 43 Moderately Tenant-Leaning
- State Illinois
- 43 Moderately Tenant-Leaning · D+7
- County
- — inherits STATE
- City
- — inherits STATE
ZIP-level market 60064
- Home prices YoY
- -0.7%
- Active inventory
- 25
- Price-to-rent
- 13.3×
Monthly cashflow live
- Estimated rent
- $3,336 medium interval (Pro) →
- Mortgage (P&I)
- −$1,400
- Tax from tax record
- −$501 /mo · $6,016/yr
- Insurance
- −$111
- HOA
- −$0
- Vacancy / Maint / Mgmt
- −$701
- Net cashflow
- $623
Break-even live
2-unit breakdown (identical units grouped — click to expand)
| Units | Beds | Baths | Est. rent |
|---|---|---|---|
| 2× units | 2 | 1 | $3,336 |
| #1 | 2 | 1 | $1,668 |
| #2 | 2 | 1 | $1,668 |
| Total (2 units) | $3,336 | ||
UW: 25.0% down · 7.5% · 30yr · 1.5% tax · 5.0% vac · 8.0% maint · 8.0% mgmt
Financing live
Cash to close
- Down payment
- $66,750
- Closing costs
- $8,010
- Reserves months
- —
- Total cash needed
- —
Loan-product check · same deal, 3 products live
Conventional
25% down · 7.5% · 30yr
- Down + closing
- —
- Monthly P&I
- —
- Monthly cashflow
- —
- DSCR
- —
- Eligible?
- —
Personal DTI + credit; lowest rate.
DSCR
20% down · 8.5% · 30yr
- Down + closing
- —
- Monthly P&I
- —
- Monthly cashflow
- —
- DSCR
- —
- Eligible?
- —
No personal income docs; deal must DSCR.
Hard money
10% down · 12.0% · 12mo
- Down + closing
- —
- Monthly P&I
- —
- Monthly cashflow
- —
- DSCR
- —
- Eligible?
- —
Short-term bridge; refi at stabilization.
Rent comps 4 comps
| Address | Beds | Baths | Sqft | Rent | $/sqft | DOM | Units | Dist |
|---|---|---|---|---|---|---|---|---|
| 1701 Victoria Ave North Chicago, IL | 3.0 | 2.0 | 2345 | $1,950 | $0.83 | 43d | 1 | 0.52mi |
| 903 S McAlister Ave Waukegan, IL | 4.0 | 2.0 | 2275 | $2,560 | $1.13 | 1d | 1 | 0.59mi |
| 2404 Pearsall Pkwy Waukegan, IL | 4.0 | 2.0 | 2000 | $4,300 | $2.15 | 1d | 1 | 1.19mi |
| 708 Keller Ave Waukegan, IL | 4.0 | 2.0 | 1800 | $4,500 | $2.50 | 1d | 1 | 1.30mi |
Listing history 50 events
-
2026-06-18days on market $267,000 Active 112 DOM
-
2026-06-17days on market $267,000 Active 111 DOM
-
2026-06-16days on market $267,000 Active 110 DOM
-
2026-06-15days on market $267,000 Active 109 DOM
-
2026-06-13days on market $267,000 Active 107 DOM
-
2026-06-13days on market $267,000 Active 106 DOM
-
2026-06-09days on market $267,000 Active 103 DOM
-
2026-06-08days on market $267,000 Active 102 DOM
-
2026-06-07days on market $267,000 Active 101 DOM
-
2026-06-04days on market $267,000 Active 98 DOM
-
2026-06-03days on market $267,000 Active 97 DOM
-
2026-06-02days on market $267,000 Active 96 DOM
-
2026-06-01days on market $267,000 Active 95 DOM
-
2026-05-31days on market $267,000 Active 94 DOM
-
2026-05-01price $267,000 390-char remark
Show marketing remark (390 chars)
This property features 2 flats both on 1.5 story building with separate basements and utilities. Great opportunity to live in one an rent one, this is a brick exterior property with a 2 car Frame garage. Kitchens feature granite counter tops. Both Kitchens and baths along with both flats were rehabbed in '24. Great tenancies and ready to sell. Included is a W/D leased for extra income.
-
2026-04-26price $268,000 390-char remark
Show marketing remark (390 chars)
This property features 2 flats both on 1.5 story building with separate basements and utilities. Great opportunity to live in one an rent one, this is a brick exterior property with a 2 car Frame garage. Kitchens feature granite counter tops. Both Kitchens and baths along with both flats were rehabbed in '24. Great tenancies and ready to sell. Included is a W/D leased for extra income.
-
2026-03-23price $278,000 390-char remark
Show marketing remark (390 chars)
This property features 2 flats both on 1.5 story building with separate basements and utilities. Great opportunity to live in one an rent one, this is a brick exterior property with a 2 car Frame garage. Kitchens feature granite counter tops. Both Kitchens and baths along with both flats were rehabbed in '24. Great tenancies and ready to sell. Included is a W/D leased for extra income.
-
2026-03-19price $281,000 390-char remark
Show marketing remark (390 chars)
This property features 2 flats both on 1.5 story building with separate basements and utilities. Great opportunity to live in one an rent one, this is a brick exterior property with a 2 car Frame garage. Kitchens feature granite counter tops. Both Kitchens and baths along with both flats were rehabbed in '24. Great tenancies and ready to sell. Included is a W/D leased for extra income.
-
2026-03-13price $282,000 390-char remark
Show marketing remark (390 chars)
This property features 2 flats both on 1.5 story building with separate basements and utilities. Great opportunity to live in one an rent one, this is a brick exterior property with a 2 car Frame garage. Kitchens feature granite counter tops. Both Kitchens and baths along with both flats were rehabbed in '24. Great tenancies and ready to sell. Included is a W/D leased for extra income.
-
2026-03-11price $284,000 390-char remark
Show marketing remark (390 chars)
This property features 2 flats both on 1.5 story building with separate basements and utilities. Great opportunity to live in one an rent one, this is a brick exterior property with a 2 car Frame garage. Kitchens feature granite counter tops. Both Kitchens and baths along with both flats were rehabbed in '24. Great tenancies and ready to sell. Included is a W/D leased for extra income.
-
2026-03-04price $287,000 390-char remark
Show marketing remark (390 chars)
This property features 2 flats both on 1.5 story building with separate basements and utilities. Great opportunity to live in one an rent one, this is a brick exterior property with a 2 car Frame garage. Kitchens feature granite counter tops. Both Kitchens and baths along with both flats were rehabbed in '24. Great tenancies and ready to sell. Included is a W/D leased for extra income.
-
2026-02-26$289,990 Active 390-char remark
Show marketing remark (390 chars)
This property features 2 flats both on 1.5 story building with separate basements and utilities. Great opportunity to live in one an rent one, this is a brick exterior property with a 2 car Frame garage. Kitchens feature granite counter tops. Both Kitchens and baths along with both flats were rehabbed in '24. Great tenancies and ready to sell. Included is a W/D leased for extra income.
-
2026-02-24historical
-
2026-02-16price
-
2026-02-11Active
-
2024-01-08historical
-
2024-01-02$142,000 Active
-
2023-12-13Active
-
2023-11-27historical Contingent - No Showings
-
2023-11-27historical
-
2023-10-20status Active
-
2023-10-20price
-
2023-08-30historical Contingent - No Showings
-
2023-08-20price
-
2023-08-16Active
-
2023-08-15historical
-
2023-08-10price
-
2023-07-28price
-
2023-07-22price
-
2023-07-18Active
-
2023-07-17historical
-
2023-07-12price
-
2023-06-28price
-
2023-06-16Active
-
2023-05-02historical
-
2023-04-07price
-
2023-03-14Active
-
2022-04-11soldstatus $120,700 Closed
-
2022-04-11soldstatus $120,700 Closed
-
2022-02-15historical Contingent - No Showings
ⓘ Source: listings_history table (triggers on properties + properties_extension) + one-shot
backfill from property_details.listing_events for pre-trigger history.
Tax reassessment forecast IL · Partial reset (capped growth)
- Current annual tax
- $6,016 · $501/mo
- Projected year-2 tax
- $6,038 · $503/mo
- Expected delta
- +$22/yr (+$2/mo · 0.4%)
ⓘ Screening estimate from a state-policy table — verify with the county assessor before closing.
Climate risk First Street
- Flood 6/10 Major FEMA zone X (unshaded) · 70% chance over 30 yrs
- Wildfire 1/10 Low
- Heat 2/10 Low 7 d/yr ≥97°F today · 14 d/yr by 30 yrs out
- Wind 2/10 Low
- Air quality 4/10 Moderate 4 unhealthy d/yr today · 5 by 30 yrs out
Nearby sold comps map
Loading sold comps map…
Walkable amenities ~0.75 mi
Loading nearby amenities…
Taxation est. · year 1
- Rental income
- $40,032
- − Mortgage interest
- −$14,956
- − Property taxes
- −$6,016
- − Insurance
- −$1,335
- − Repairs & maintenance
- −$3,203
- − Management
- −$3,203
- − Depreciation
- −$7,767
- Taxable income
- $3,552
- Est. tax owed @ 24.0%
- −$853
- After-tax cash flow
- $6,620/yr
For passive investors: Depreciation is non-cash, so a rental often shows a tax loss while cash-flowing — sheltering income. Rental losses are passive: they offset passive income freely, and up to $25,000/yr can offset ordinary (W-2) income if you actively participate and your MAGI is under $100k (phasing out to $0 by $150k); unused losses carry forward. On sale, claimed depreciation is recaptured at up to 25%, and gains may owe capital-gains tax (a 1031 exchange can defer both). Figures are a year-1 estimate at your 24.0% rate — not tax advice; consult a CPA.
Schools (NCES district)
- District
- North Chicago SD 187
- NCES district ID
- 1700110
- Math proficiency
- 8% ▼ -4.00%
- Reading proficiency
- 13% ▼ -4.00%
- Median HH income
- $39,812
- Composite
- 9.05/100
- National rank
- #9873
- State rank
- #574 of 620 in IL
Livability — North Chicago
- Score
- 81/100
- State rank
- #95
- US rank
- #1536
Category grades
Schools grade is shown separately in the Schools card above.
Census & demographics
- Census place
- North Chicago, IL
- City population
- 29,316
- Population (ZIP)
- 15,047
Population outlook (Lake County) Hauer SSP2
- Today (2025)
- 700,217 people
- By 2030
- 693,290 · -1.0%
- By 2040
- 673,588 · -3.8%
- By 2050
- 643,556 · -8.1%
- By 2075
- 562,792 · -19.6%
- By 2100
- 457,715 · -34.6%
Race, ethnicity, and origin ACS 2023
- Neighborhood character
- Diverse neighborhood (Simpson 0.61)
- Race & ethnicity
- Hispanic / Latino 54% Black 30% Two or more races 19% White 11% Asian 2% Native American 2%
- Hispanic origin (detail)
- Mexican 47% Puerto Rican 2%
- Common ancestry
- Romanian 1% British 1% American 1%
- Foreign-born
- 27% · Canada
- Languages at home
- 51% English-only · Spanish 47% Other Indo-European 1%
Political lean MEDSL · Lake
- 2024 margin
- Strong D (+20.8) · D 59.7% · R 38.9% · Other 1.4%
- 2008→2024 swing
- +1.1pp toward D · 2008: 19.6pp · 2024: 20.8pp
- All cycles
- 2024: D+20.8 2020: D+24.1 2016: D+20.3 2012: D+8.1 2008: D+19.6
Not yet ingested
- Civics
- —
Market trends
- HPI YoY
- ▼ -1.61%
- Current HPI
- 233.6178
- Rent YoY
- —
- Metro
- —
- State GDP YoY
- ▲ 1.59%
- F500 in state
- 60
Industry mix (Fortune 500 HQ in IL)
| Industry | F500 HQs | Revenue |
|---|---|---|
| Insurance | 4 | $201B |
|
||
| Consumer Goods | 4 | $87B |
|
||
| Industrial Machinery | 3 | $64B |
|
||
| Healthcare | 2 | $55B |
|
||
| Retail / Pharmacy | 1 | $148B |
|
||
| Agriculture / Food | 1 | $86B |
|
||
Price history
+295.6% since first listed39 events — show timeline
- 2026-05-01 Price Changed $267,000 MRED as Distributed by MLS Grid
- 2026-04-26 Price Changed $268,000 MRED as Distributed by MLS Grid
- 2026-03-23 Price Changed $278,000 MRED as Distributed by MLS Grid
- 2026-03-19 Price Changed $281,000 MRED as Distributed by MLS Grid
- 2026-03-13 Price Changed $282,000 MRED as Distributed by MLS Grid
- 2026-03-11 Price Changed $284,000 MRED as Distributed by MLS Grid
- 2026-03-04 Price Changed $287,000 MRED as Distributed by MLS Grid
- 2026-02-26 Listed $289,990 MRED as Distributed by MLS Grid
- 2026-02-24 Listing Removed — MRED as Distributed by MLS Grid
- 2026-02-16 Price Changed — MRED as Distributed by MLS Grid
- 2026-02-11 Listed — MRED as Distributed by MLS Grid
- 2024-01-08 Listing Removed — MRED as Distributed by MLS Grid
- 2024-01-02 Listed $142,000 MRED as Distributed by MLS Grid
- 2023-12-13 Listed — MRED as Distributed by MLS Grid
- 2023-11-27 Contingent — MRED as Distributed by MLS Grid
- 2023-11-27 Listing Removed — MRED as Distributed by MLS Grid
- 2023-10-20 Relisted — MRED as Distributed by MLS Grid
- 2023-10-20 Price Changed — MRED as Distributed by MLS Grid
- 2023-08-30 Contingent — MRED as Distributed by MLS Grid
- 2023-08-20 Price Changed — MRED as Distributed by MLS Grid
- 2023-08-16 Listed — MRED as Distributed by MLS Grid
- 2023-08-15 Listing Removed — MRED as Distributed by MLS Grid
- 2023-08-10 Price Changed — MRED as Distributed by MLS Grid
- 2023-07-28 Price Changed — MRED as Distributed by MLS Grid
- 2023-07-22 Price Changed — MRED as Distributed by MLS Grid
- 2023-07-18 Listed — MRED as Distributed by MLS Grid
- 2023-07-17 Listing Removed — MRED as Distributed by MLS Grid
- 2023-07-12 Price Changed — MRED as Distributed by MLS Grid
- 2023-06-28 Price Changed — MRED as Distributed by MLS Grid
- 2023-06-16 Listed — MRED as Distributed by MLS Grid
- 2023-05-02 Listing Removed — MRED as Distributed by MLS Grid
- 2023-04-07 Price Changed — MRED as Distributed by MLS Grid
- 2023-03-14 Listed — MRED as Distributed by MLS Grid
- 2022-04-11 Sold (MLS) $120,700 MRED as Distributed by MLS Grid
- 2022-04-11 Sold (MLS) $120,700 MRED as Distributed by MLS Grid
- 2022-02-15 Contingent — MRED as Distributed by MLS Grid
- 2022-02-10 Listed $142,000 MRED as Distributed by MLS Grid
- 2022-02-10 Listing Removed — MRED as Distributed by MLS Grid
- 2001-07-23 Sold (Public Records) $67,500 Public Records
Property tax history
+1.1%/yrLatest (2024): $6,016 · -25.8% YoY. Source: county tax records.
Cash-flow waterfall
monthlySold comps — $/sqft
last 12 mo · ≤1 miLoading sold comps…