 6-Plex
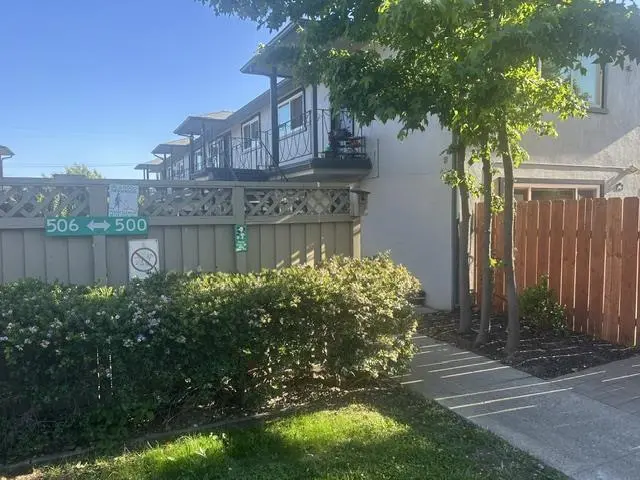
500 19th Ave · San Mateo, CA
Flood risk 4/10 · Minor
- FEMA flood zone
- X
- Chance of flooding over 30 yrs
- 0.24%
- Est. flood insurance / yr
- $507 – $1,088
Fire risk 1/10 · Minimal
- Est. fire insurance / yr
- $659 – $1,223
Heat risk 2/10 · Minimal
- Hot days now (above 87°F)
- 7 days/yr
- Hot days in 30 yrs
- 15 days/yr
Wind risk 1/10 · Minimal
- Chance of severe wind over 30 yrs
- —
Air-quality risk 7/10 · Major
- Unhealthy air days now
- 12 days/yr
- Unhealthy air days in 30 yrs
- 12 days/yr
Risk factors via First Street. Map © Google.
Why this score? — see what drove the B- grade
The composite is a weighted blend of 9 inputs, each scored 0–100. Each bar is that input's sub-score; the figure is the points it added to the 100-point composite (weight × sub-score).
- Cash flow +21.1/30.0
- Appreciation +8.5/10.0
- ARV discount +7.5/15.0
- 1% rule +6.7/10.0
- DSCR +6.7/10.0
- Schools +5.7/10.0
- Rent growth +4.2/5.0
- Livability +4.0/5.0
- Condition / age +2.5/5.0
$2,600,000
🖨 Deal sheet (PDF) 📄 Offer letter ✓ Due diligence
Multi-family units
County records classify this as Multi-Family (5+ Unit). Listing-text estimate: 6 units. confirmed
5+ unit building — per-unit beds/baths from public records are typically unavailable; the breakdown below (if shown) is an estimate from the listing text.
Listing remarks MLS
Fiesta Gardens Six unit building in very good condition. Upper units have decks; lower units have patio yards. Great location for access to shops, parks, transportation and schools. Easy access to Hwy 101/92/280 to SF, SJ or Hayward HOA has pool, tennis clubhouse etc. Rents are low, excellent opportunity to upgrade and increase cash flow.
Key facts
- Hoa has pool
- 7,728 sq ft lot
- Parking
Tags
Property features AI
Finance
- Financial info: Annual rental income and gross income reported; Gross scheduled income and gross rent multiplier provided; Vacancy factor indicated; Tenant pays utilities for electric, gas and heating
- HOA & community: Has HOA; HOA amenities include barbecue area, clubhouse, community pool and organized activities; HOA fee listed
Exterior
- Parking: Carport parking; At least 1 marked parking space; Carport capacity listed as 6 (minimum)
- Utilities: Individual electric meters; Individual gas meters; Public water (irrigation connected); Public sewer (connected); Primary water meter
- Home design: Individual ownership; Zoned R3; Grade-level/level lot
- Construction: Masonry and wood construction; Composition roof; Concrete perimeter and slab foundation; One building
- Exterior features: Backyard; Balcony/Patio; Courtyard; Low-maintenance landscaping; Automatic sprinklers; Tennis court(s)
Interior
- Kitchen: Appliances vary by unit; Granite, tile and other countertops; Garbage disposal; Gas oven; Refrigerator(s); Gas hookups
- Bedrooms: Multiple 1-bedroom units (several unit types listed as 1 bedroom)
- Flooring: Carpet; Laminate; Tile
- Bathrooms: Multiple full bathrooms (each unit listed with 1 full bath)
- Heating & cooling: Gas heating; Wall furnace
- Interior features: Coin-operated laundry; Carpet, laminate and tile flooring
- Laundry & utility: Coin-operated laundry (on-site)
Neighborhood map
What this means for you Summary
Snapshot
- This is a 6 × 6-bed/6.0-bath units multifamily listed at $2.60M.
Deal economics
- At list price, monthly cash flow is $4k ($45k/yr) — positive. Per door: $621/mo.
- The deal already cash-flows at list — no discount required.
- Meets the 1% rule at list price ($30k rent vs $2.60M).
- Recommended offer: $2.52M (3.0% below list) — sets the bar for market timing.
- Cap rate 8.0% vs local median 1.2% in San Mateo — top-decile yield for the area; either an underpriced asset or a hidden risk that comps aren't pricing in. Stress-test before assuming the spread holds.
Location & tenants
- Location reads 79/100 on livability (#56 in CA, #2,095 nationally) — a middle-class / working-renter tenant base. Strengths: amenities A+, commute A+, employment A+; Watch: cost of living F.
- San Mateo Union High (suburban): math 50% / reading 70% proficiency, ranked #178 of 1,400 in CA (top 13%) — acceptable for families but not a draw, mixed tenant base, ~2y average lease.
- Zoned schools: Hillsdale High (1,629 students, 19% FRL).
- Market conditions: Rents rising fast (+7.0%/yr); 48 active listings in the ZIP; high-income renter base; 1,019 units permitted in San Mateo County in 2024 (484 in 5+ unit buildings).
Forward outlook
- In year one you build about $202k of equity ($18k loan paydown + $184k appreciation (7.1% local appreciation)).
- San Mateo County population projected at +24% by 2050 — long-run rental-demand tailwind backs the buy-and-hold thesis.
- At projected returns (7.1% appreciation + 7.0% rent growth), your $728k cash investment doubles in ~3 years — after that, you're playing with house money.
- By year 2, paydown + projected appreciation supports a ~$323k cash-out refi (75% LTV) — recoverable capital for the next deal without selling this one.
Negotiation context
- It's been on market 33 days — a 3% lower offer ($2.52M) is reasonable based on typical stale-listing flexibility.
- 3 sale attempts since 3y ago; this cycle's ask is 94514% above the opening price — seller raised mid-cycle; expect resistance to lowballs.
- Current owner paid $475k; list at $2.60M implies a 447% gain — meaningful room to come down on a strong offer.
Risks & watch-outs
- Watch-outs: built in 1958 — expect roof / HVAC / electrical / plumbing capex.
Questions for the listing agent
- It's been on market 33 days. Have you received any prior offers? Is the seller open to a 3% concession, seller financing, or rate buy-down credit?
- Can we see the unit-by-unit rent roll, current vacancy, and any below-market leases? What's the average tenancy length?
- What capital expenditures (roof, boiler, parking lot, exteriors) have been made in the last 5 years, and what's planned in the next 2?
- Built in 1958 — when were the roof, HVAC, electrical panel, plumbing, and water heater last replaced?
- What does the HOA fee cover, when was the last increase, and are there any pending special assessments or reserve-fund shortfalls?
- Is there a deadline driving the sale (1031 exchange, divorce, estate, relocation)? That informs how much negotiation room exists.
- Schools are B-rated — typically a magnet for longer-tenancy family renters. What's the average tenant stay here, and is there a school-zone premium baked into asking?
- What's the average days-on-market for RENTAL listings here right now (not sales)? A rising rental-DOM trend means longer vacancies and softer asking-rent achievability than the comps imply.
- What's the recent tenant-quality profile in this submarket — average credit score on applications, eviction rate, late-payment / NSF rate, and stable-employment percentage? A property-management company in the area should have these aggregated.
- How much new apartment / multifamily construction is in the pipeline within 1–3 miles? Heavy new supply (>2% of stock underway) typically softens rents 12–24 months out; light construction supports rent growth.
Investment metrics
- 1% rule
- 1.17% ✓
- Cap rate
- 8.01%
- Cash-on-cash
- 6.15%
- DSCR
- 1.27
- GRM
- 7.1
CMA / ARV
No comps found within radius.
Projected returns pro-forma
7.08% appreciation · 6.97% rent growth · sell at horizon
- IRR
- 24.9%
- Equity multiple
- 2.77×
- Total profit
- $1,286,913
- Equity at exit
- $1,815,504
- IRR
- 24.6%
- Equity multiple
- 6.32×
- Total profit
- $3,871,825
- Equity at exit
- $3,461,182
Cash invested: $728,000 (down + closing). Projections, not guarantees.
Landlord ↔ Tenant lean methodology
- Overall (STATE)
- 18 Strongly Tenant-Friendly
- State California
- 18 Strongly Tenant-Friendly · D+13
- County
- — inherits STATE
- City
- — inherits STATE
ZIP-level market 94402
- Home prices YoY
- 2.0%
- Rents YoY
- 7.0%
- Active inventory
- 48
- Price-to-rent
- 42.6×
Monthly cashflow live
- Estimated rent
- $30,493 medium interval (Pro) →
- Mortgage (P&I)
- −$13,635
- Tax from tax record
- −$1,911 /mo · $22,932/yr
- Insurance
- −$1,083
- HOA
- −$3,732
- Vacancy / Maint / Mgmt
- −$6,404
- Net cashflow
- $3,728
Break-even live
Sensitivity live
| Price | -10% $5,200 | -5% $4,464 | +0% $3,728 | +5% $2,993 | +10% $2,257 |
|---|---|---|---|---|---|
| Rent | -10% $1,320 | -5% $2,524 | +0% $3,728 | +5% $4,933 | +10% $6,137 |
| Rate | -1.0pp $5,038 | -0.5pp $4,390 | base $3,728 | +0.5pp $3,055 | +1.0pp $2,369 |
6-unit breakdown (identical units grouped — click to expand)
| Units | Beds | Baths | Est. rent |
|---|---|---|---|
| 6× units | 6 | 6 | $30,492 |
| #1 | 6 | 6 | $5,082 |
| #2 | 6 | 6 | $5,082 |
| #3 | 6 | 6 | $5,082 |
| #4 | 6 | 6 | $5,082 |
| #5 | 6 | 6 | $5,082 |
| #6 | 6 | 6 | $5,082 |
| Total (6 units) | $30,493 | ||
UW: 25.0% down · 7.5% · 30yr · 1.5% tax · 5.0% vac · 8.0% maint · 8.0% mgmt
Financing live
Cash to close
- Down payment
- $650,000
- Closing costs
- $78,000
- Reserves months
- —
- Total cash needed
- —
Loan-product check · same deal, 3 products live
Conventional
25% down · 7.5% · 30yr
- Down + closing
- —
- Monthly P&I
- —
- Monthly cashflow
- —
- DSCR
- —
- Eligible?
- —
Personal DTI + credit; lowest rate.
DSCR
20% down · 8.5% · 30yr
- Down + closing
- —
- Monthly P&I
- —
- Monthly cashflow
- —
- DSCR
- —
- Eligible?
- —
No personal income docs; deal must DSCR.
Hard money
10% down · 12.0% · 12mo
- Down + closing
- —
- Monthly P&I
- —
- Monthly cashflow
- —
- DSCR
- —
- Eligible?
- —
Short-term bridge; refi at stabilization.
HOA detail
- Monthly dues
- $3,732 · $44,784/yr
- Likely covers
- pool
Listing history 25 events
-
2026-06-21days on market $2,600,000 Active 33 DOM
-
2026-06-18days on market $2,600,000 Active 30 DOM
-
2026-06-17days on market $2,600,000 Active 29 DOM
-
2026-06-16days on market $2,600,000 Active 28 DOM
-
2026-06-15days on market $2,600,000 Active 27 DOM
-
2026-06-13days on market $2,600,000 Active 25 DOM
-
2026-06-13days on market $2,600,000 Active 24 DOM
-
2026-06-10price $2,600,000 Active 21 DOM
-
2026-06-09days on market $2,788,000 Active 21 DOM
-
2026-06-08days on market $2,788,000 Active 20 DOM
-
2026-06-07days on market $2,788,000 Active 19 DOM
-
2026-06-04days on market $2,788,000 Active 16 DOM
-
2026-06-03days on market $2,788,000 Active 15 DOM
-
2026-06-02days on market $2,788,000 Active 14 DOM
-
2026-06-01days on market $2,788,000 Active 13 DOM
-
2026-05-31days on market $2,788,000 Active 12 DOM
-
2026-05-21price $2,788,000 340-char remark
Show marketing remark (340 chars)
Fiesta Gardens Six unit building in very good condition. Upper units have decks; lower units have patio yards. Great location for access to shops, parks, transportation and schools. Easy access to Hwy 101/92/280 to SF, SJ or Hayward HOA has pool, tennis clubhouse etc. Rents are low, excellent opportunity to upgrade and increase cash flow.
-
2026-05-19$2,748 Active 340-char remark
Show marketing remark (340 chars)
Fiesta Gardens Six unit building in very good condition. Upper units have decks; lower units have patio yards. Great location for access to shops, parks, transportation and schools. Easy access to Hwy 101/92/280 to SF, SJ or Hayward HOA has pool, tennis clubhouse etc. Rents are low, excellent opportunity to upgrade and increase cash flow.
-
2024-03-14historical $2,400
-
2023-12-15price $2,400
-
2023-12-14$1,800
-
1991-05-14soldstatus $475,000
-
1991-05-14soldstatus $475,000
ⓘ Source: listings_history table (triggers on properties + properties_extension) + one-shot
backfill from property_details.listing_events for pre-trigger history.
Tax reassessment forecast CA · Resets to sale price
- Current annual tax
- $22,932 · $1,911/mo
- Projected year-2 tax
- $22,932 · $1,911/mo
- Expected delta
- $0/yr ($0/mo · 0.0%)
ⓘ Screening estimate from a state-policy table — verify with the county assessor before closing.
Climate risk First Street
- Flood 4/10 Moderate FEMA zone X · 24% chance over 30 yrs
- Wildfire 1/10 Low
- Heat 2/10 Low 7 d/yr ≥87°F today · 15 d/yr by 30 yrs out
- Wind 1/10 Low
- Air quality 7/10 Severe 12 unhealthy d/yr today · 12 by 30 yrs out
Nearby sold comps map
Loading sold comps map…
Walkable amenities ~0.75 mi
Loading nearby amenities…
Taxation est. · year 1
- Rental income
- $365,916
- − Mortgage interest
- −$145,640
- − Property taxes
- −$22,932
- − Insurance
- −$13,000
- − Repairs & maintenance
- −$29,273
- − Management
- −$29,273
- − HOA
- −$44,784
- − Depreciation
- −$75,636
- Taxable income
- $5,377
- Est. tax owed @ 24.0%
- −$1,290
- After-tax cash flow
- $43,451/yr
For passive investors: Depreciation is non-cash, so a rental often shows a tax loss while cash-flowing — sheltering income. Rental losses are passive: they offset passive income freely, and up to $25,000/yr can offset ordinary (W-2) income if you actively participate and your MAGI is under $100k (phasing out to $0 by $150k); unused losses carry forward. On sale, claimed depreciation is recaptured at up to 25%, and gains may owe capital-gains tax (a 1031 exchange can defer both). Figures are a year-1 estimate at your 24.0% rate — not tax advice; consult a CPA.
Schools (NCES district)
- District
- San Mateo Union High
- NCES district ID
- 0634980
- Math proficiency
- 50% ▼ -2.00%
- Reading proficiency
- 70% ▼ -1.00%
- Median HH income
- $96,956
- Composite
- 57.13/100
- National rank
- #2338
- State rank
- #178 of 1400 in CA
Livability — San Mateo
- Score
- 79/100
- State rank
- #56
- US rank
- #2095
Category grades
Schools grade is shown separately in the Schools card above.
Census & demographics
- Census place
- San Mateo, CA
- County
- San Mateo County · 733,415 people
- City population
- 104,046
- Metro
- San Francisco-Oakland-Berkeley, CA
- Population (ZIP)
- 25,475
- Household income
- $172,522
- Rent vs Own
- Severe rent burden
- 1017.0
Population outlook (San Mateo County) Hauer SSP2
- Today (2025)
- 864,008 people
- By 2030
- 910,523 · +5.4%
- By 2040
- 997,285 · +15.4%
- By 2050
- 1,071,189 · +24.0%
- By 2075
- 1,197,206 · +38.6%
- By 2100
- 1,192,523 · +38.0%
Race, ethnicity, and origin ACS 2023
- Neighborhood character
- Diverse neighborhood (Simpson 0.67)
- Race & ethnicity
- White 49% Asian 26% Hispanic / Latino 15% Two or more races 12% Black 1%
- Hispanic origin (detail)
- Mexican 6%
- Common ancestry
- Lithuanian 3% Italian 3% Scotch-Irish 2%
- Foreign-born
- 27% · Canada, China, Vietnam
- Languages at home
- 68% English-only · Spanish 9% Chinese 8% Other Indo-European 5%
Political lean MEDSL · San Mateo
- 2024 margin
- Solid D (+50.3) · D 73.5% · R 23.2% · Other 3.3%
- 2008→2024 swing
- +1.6pp toward D · 2008: 48.7pp · 2024: 50.3pp
- All cycles
- 2024: D+50.3 2020: D+57.7 2016: D+57.7 2012: D+44.8 2008: D+48.7
Not yet ingested
- Civics
- —
Market trends
- HPI YoY
- ▲ 7.08%
- Current HPI
- 366.9431
- Rent YoY
- ▲ 6.97%
- Metro
- San Francisco-Oakland-Berkeley, CA
- State GDP YoY
- ▲ 3.21%
- F500 in state
- 116
Industry mix (Fortune 500 HQ in CA)
| Industry | F500 HQs | Revenue |
|---|---|---|
| Technology | 27 | $1,492B |
|
||
| Financial Services | 3 | $174B |
|
||
| Retail | 3 | $44B |
|
||
| Insurance | 3 | $26B |
|
||
| Media / Entertainment | 2 | $115B |
|
||
| Pharmaceuticals / Biotech | 2 | $62B |
|
||
Price history
+486.9% since first listed9 events — show timeline
- 2026-05-21 Price Changed $2,788,000 bridgeMLS, Bay East AOR, or Contra Costa AOR
- 2026-05-21 Price Changed $2,788,000 MLSListings
- 2026-05-19 Listed $2,748 MLSListings
- 2026-05-19 Listed $2,748 bridgeMLS, Bay East AOR, or Contra Costa AOR
- 2024-03-14 Rental Removed $2,400 APPFOLIO
- 2023-12-15 Price Changed $2,400 APPFOLIO
- 2023-12-14 Listed for Rent $1,800 APPFOLIO
- 1991-05-14 Sold (Public Records) $475,000 Public Records
- 1991-05-14 Sold (Public Records) $475,000 Public Records
Property tax history
+5.2%/yrLatest (2025): $22,932 · +2.7% YoY. Source: county tax records.
Cash-flow waterfall
monthlySold comps — $/sqft
last 12 mo · ≤1 miLoading sold comps…