3120 Van Bibber Lake Inc Ests · Van Bibber Lake, IN
Flood risk 1/10 · Minimal
- FEMA flood zone
- X (unshaded)
- Chance of flooding over 30 yrs
- 0.0%
- Est. flood insurance / yr
- $507 – $1,088
Fire risk 1/10 · Minimal
- Est. fire insurance / yr
- $717 – $1,331
Heat risk 3/10 · Minor
- Hot days now (above 104°F)
- 7 days/yr
- Hot days in 30 yrs
- 18 days/yr
Wind risk 2/10 · Minimal
- Chance of severe wind over 30 yrs
- 1.0%
Air-quality risk 2/10 · Minimal
- Unhealthy air days now
- 1 days/yr
- Unhealthy air days in 30 yrs
- 2 days/yr
Risk factors via First Street. Map © Google.
Why this score? — see what drove the B+ grade
The composite is a weighted blend of 9 inputs, each scored 0–100. Each bar is that input's sub-score; the figure is the points it added to the 100-point composite (weight × sub-score).
- Cash flow +30.0/30.0
- ARV discount +15.0/15.0
- 1% rule +10.0/10.0
- DSCR +10.0/10.0
- Schools +4.1/10.0
- Rent growth +2.5/5.0
- Condition / age +2.5/5.0
- Livability +2.1/5.0
- Appreciation +0.0/10.0
$70,000
🖨 Deal sheet (PDF) 📄 Offer letter ✓ Due diligence
Listing remarks MLS
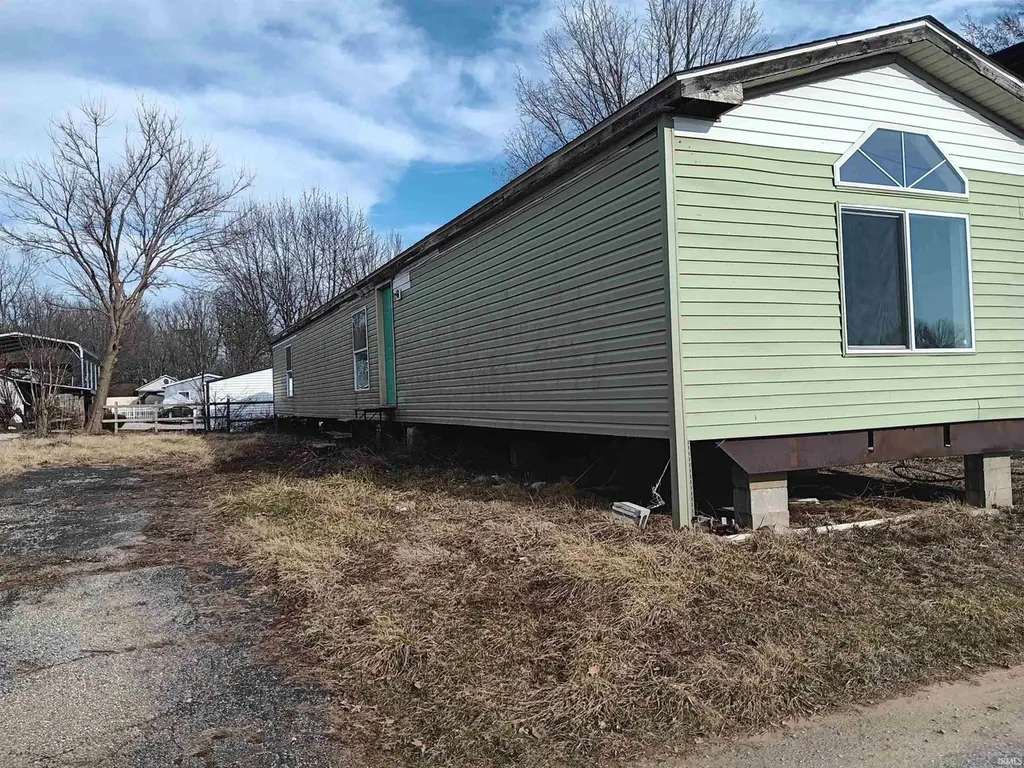
Located within The Van Bibber Lake Retreat/Recreational Area! Add your own floor coverings as you desire to make this 'permanent or seasonal vacation property' feel like home! Neat & clean, fresh property, finish as you desire. Master Bathroom 9 x 16, has Garden Bathtub Plus Separate Shower
Key facts
- Separate shower
- Garden bathtub
- 3,485 sq ft lot
Tags
Neighborhood map
What this means for you Summary
Snapshot
- This is a 3-bed/2.0-bath manufactured listed at $70k.
Deal economics
- At list price, monthly cash flow is $746 ($9k/yr) — positive.
- The deal already cash-flows at list — no discount required.
- Meets the 1% rule at list price ($1k rent vs $70k).
- Recommended offer: $62k (12.0% below list) — sets the bar for market timing.
Location & tenants
- Location reads 43/100 on livability (#670 in IN) — a working-class tenant base; expect higher turnover. Strengths: cost of living A+, crime A; Watch: employment D, amenities F, commute F.
- North Putnam Community Schools (rural): math 47% / reading 48% proficiency, ranked #73 of 301 in IN (top 24%) — families likely to look elsewhere, expect single-tenant / working-renter base with shorter leases.
- Zoned schools: Bainbridge Elementary School (math 62% / reading 47%, grade C, #197 of 994 statewide, top 22%, 419 students, 52% FRL); North Putnam Middle School (math 38% / reading 42%, grade F, #120 of 330 statewide, top 37%, 309 students, 52% FRL); North Putnam Sr High School (math 52% / reading 67%, grade C+, #49 of 369 statewide, top 16%, 437 students, 43% FRL).
- Market conditions: 99 active listings in the ZIP; 166 units permitted in Putnam County in 2024 (0 in 5+ unit buildings).
Forward outlook
- Local home prices are declining (-3.0%/yr); year-one equity from $484 of loan paydown is wiped out by about $2k of value loss. Plan a longer hold.
- Putnam County population projected to shrink 8% by 2050 — rents likely to lag national; underwrite the cash flow, not the appreciation.
- At projected returns (-3.0% appreciation + 3.0% rent growth), your $20k cash investment doubles in ~3 years — after that, you're playing with house money.
Negotiation context
- It's been on market 463 days — a 12% lower offer ($62k) is reasonable based on typical stale-listing flexibility.
Questions for the listing agent
- It's been on market 463 days. Have you received any prior offers? Is the seller open to a 12% concession, seller financing, or rate buy-down credit?
- Why hasn't it sold? Are there any deal-killer items the seller is aware of (foundation, flood, title, zoning, code violations)?
- Is there a deadline driving the sale (1031 exchange, divorce, estate, relocation)? That informs how much negotiation room exists.
- Schools are F-rated, which usually means shorter tenancies and higher turnover. Who's the typical renter profile here, and what's been the actual vacancy rate?
- What's the average days-on-market for RENTAL listings here right now (not sales)? A rising rental-DOM trend means longer vacancies and softer asking-rent achievability than the comps imply.
- What's the recent tenant-quality profile in this submarket — average credit score on applications, eviction rate, late-payment / NSF rate, and stable-employment percentage? A property-management company in the area should have these aggregated.
- How much new for-sale + rental construction is in the pipeline within 1–3 miles? Heavy new supply typically softens prices + rents 12–24 months out; constrained supply supports both.
Investment metrics
- 1% rule
- 2.13% ✓
- Cap rate
- 19.08%
- Cash-on-cash
- 45.66%
- DSCR
- 3.03
- GRM
- 3.9
CMA / ARV
- ARV (median comp)
- $130,253
- List price
- $70,000
- Delta
- -46.26%
- Verdict
- UNDERPRICED
- Comps
- 4 within 1.0 mi
Show comp detail 2 sales within ~0.75 mi
| Address | Dist | Beds/Ba | Sqft | Sold | Price | $/sf | Match |
|---|---|---|---|---|---|---|---|
| 3102 A Van Bibber Lake Est | 0.24mi | 2/2.0 (-1) | 1,292 (+6%) | 4mo | $130,000 | $101 | 70 |
| 3101 Van Bibber Lake Estate A-34 | 0.16mi | 3/2.0 | 1,106 (-9%) | 11mo | $176,000 | $159 | 68 |
Match score weights: distance 35% · size 25% · config 20% · recency 20%. Top-matched comps best support the ARV.
Projected returns pro-forma
-3.0% appreciation · 3.0% rent growth · sell at horizon
- IRR
- 42.8%
- Equity multiple
- 2.84×
- Total profit
- $36,145
- Equity at exit
- $10,437
- IRR
- 48.9%
- Equity multiple
- 5.72×
- Total profit
- $92,596
- Equity at exit
- $6,052
Cash invested: $19,600 (down + closing). Projections, not guarantees.
Landlord ↔ Tenant lean methodology
- Overall (STATE)
- 90 Strongly Landlord-Friendly
- State Indiana
- 90 Strongly Landlord-Friendly · R+11
- County
- — inherits STATE
- City
- — inherits STATE
ZIP-level market 46135
- Home prices YoY
- -20.8%
- Active inventory
- 99
- Price-to-rent
- 3.9×
Monthly cashflow live
- Estimated rent
- $1,490 medium interval (Pro) →
- Mortgage (P&I)
- −$367
- Tax from tax record
- −$35 /mo · $419/yr
- Insurance
- −$29
- HOA
- −$0
- Vacancy / Maint / Mgmt
- −$313
- Net cashflow
- $746
Break-even live
Sensitivity live
| Price | -10% $785 | -5% $766 | +0% $746 | +5% $726 | +10% $706 |
|---|---|---|---|---|---|
| Rent | -10% $628 | -5% $687 | +0% $746 | +5% $805 | +10% $863 |
| Rate | -1.0pp $781 | -0.5pp $764 | base $746 | +0.5pp $728 | +1.0pp $709 |
UW: 25.0% down · 7.5% · 30yr · 1.5% tax · 5.0% vac · 8.0% maint · 8.0% mgmt
Financing live
Cash to close
- Down payment
- $17,500
- Closing costs
- $2,100
- Reserves months
- —
- Total cash needed
- —
Loan-product check · same deal, 3 products live
Conventional
25% down · 7.5% · 30yr
- Down + closing
- —
- Monthly P&I
- —
- Monthly cashflow
- —
- DSCR
- —
- Eligible?
- —
Personal DTI + credit; lowest rate.
DSCR
20% down · 8.5% · 30yr
- Down + closing
- —
- Monthly P&I
- —
- Monthly cashflow
- —
- DSCR
- —
- Eligible?
- —
No personal income docs; deal must DSCR.
Hard money
10% down · 12.0% · 12mo
- Down + closing
- —
- Monthly P&I
- —
- Monthly cashflow
- —
- DSCR
- —
- Eligible?
- —
Short-term bridge; refi at stabilization.
Listing history 22 events
-
2026-06-22days on market $70,000 Active 463 DOM
-
2026-06-21days on market $70,000 Active 462 DOM
-
2026-06-21days on market $70,000 Active 461 DOM
-
2026-06-18days on market $70,000 Active 459 DOM
-
2026-06-17days on market $70,000 Active 458 DOM
-
2026-06-16days on market $70,000 Active 457 DOM
-
2026-06-15days on market $70,000 Active 456 DOM
-
2026-06-13days on market $70,000 Active 454 DOM
-
2026-06-12days on market $70,000 Active 453 DOM
-
2026-06-09days on market $70,000 Active 450 DOM
-
2026-06-08days on market $70,000 Active 449 DOM
-
2026-06-07days on market $70,000 Active 448 DOM
-
2026-06-05days on market $70,000 Active 446 DOM
-
2026-06-04days on market $70,000 Active 444 DOM
-
2026-06-02days on market $70,000 Active 443 DOM
-
2026-06-01days on market $70,000 Active 442 DOM
-
2026-05-31days on market $70,000 Active 441 DOM
-
2026-05-31days on market $70,000 Active 440 DOM
-
2026-03-23price $70,000 297-char remark
Show marketing remark (297 chars)
Located within The Van Bibber Lake Retreat/Recreational Area! Add your own floor coverings as you desire to make this 'permanent or seasonal vacation property' feel like home! Neat & clean, fresh property, finish as you desire. Master Bathroom 9 x 16, has Garden Bathtub Plus Separate Shower
-
2025-12-22price $75,404 297-char remark
Show marketing remark (297 chars)
Located within The Van Bibber Lake Retreat/Recreational Area! Add your own floor coverings as you desire to make this 'permanent or seasonal vacation property' feel like home! Neat & clean, fresh property, finish as you desire. Master Bathroom 9 x 16, has Garden Bathtub Plus Separate Shower
-
2025-09-05price $75,905 297-char remark
Show marketing remark (297 chars)
Located within The Van Bibber Lake Retreat/Recreational Area! Add your own floor coverings as you desire to make this 'permanent or seasonal vacation property' feel like home! Neat & clean, fresh property, finish as you desire. Master Bathroom 9 x 16, has Garden Bathtub Plus Separate Shower
-
2025-03-17$79,900 Active 297-char remark
Show marketing remark (297 chars)
Located within The Van Bibber Lake Retreat/Recreational Area! Add your own floor coverings as you desire to make this 'permanent or seasonal vacation property' feel like home! Neat & clean, fresh property, finish as you desire. Master Bathroom 9 x 16, has Garden Bathtub Plus Separate Shower
ⓘ Source: listings_history table (triggers on properties + properties_extension) + one-shot
backfill from property_details.listing_events for pre-trigger history.
Tax reassessment forecast IN · Partial reset (capped growth)
- Current annual tax
- $419 · $35/mo
- Projected year-2 tax
- $507 · $42/mo
- Expected delta
- +$88/yr (+$7/mo · 21.0%)
ⓘ Screening estimate from a state-policy table — verify with the county assessor before closing.
Climate risk First Street
- Flood 1/10 Low FEMA zone X (unshaded) · 0% chance over 30 yrs
- Wildfire 1/10 Low
- Heat 3/10 Moderate 7 d/yr ≥104°F today · 18 d/yr by 30 yrs out
- Wind 2/10 Low 100% chance of damaging wind over 30 yrs
- Air quality 2/10 Low 1 unhealthy d/yr today · 2 by 30 yrs out
Nearby sold comps map
Loading sold comps map…
Walkable amenities ~0.75 mi
Loading nearby amenities…
Taxation est. · year 1
- Rental income
- $17,878
- − Mortgage interest
- −$3,921
- − Property taxes
- −$419
- − Insurance
- −$350
- − Repairs & maintenance
- −$1,430
- − Management
- −$1,430
- − Depreciation
- −$2,036
- Taxable income
- $8,291
- Est. tax owed @ 24.0%
- −$1,990
- After-tax cash flow
- $6,959/yr
For passive investors: Depreciation is non-cash, so a rental often shows a tax loss while cash-flowing — sheltering income. Rental losses are passive: they offset passive income freely, and up to $25,000/yr can offset ordinary (W-2) income if you actively participate and your MAGI is under $100k (phasing out to $0 by $150k); unused losses carry forward. On sale, claimed depreciation is recaptured at up to 25%, and gains may owe capital-gains tax (a 1031 exchange can defer both). Figures are a year-1 estimate at your 24.0% rate — not tax advice; consult a CPA.
Schools (NCES district)
- District
- North Putnam Community Schools
- NCES district ID
- 1807980
- Math proficiency
- 47% ▼ -12.00%
- Reading proficiency
- 48% ▼ -8.00%
- Median HH income
- $54,825
- Composite
- 41.18/100
- National rank
- #3549
- State rank
- #73 of 301 in IN
Livability — Van Bibber Lake
- Score
- 43/100
- State rank
- #670
- US rank
- #26940
Category grades
Schools grade is shown separately in the Schools card above.
Census & demographics
- Census place
- Van Bibber Lake, IN
- Population (ZIP)
- 19,639
Population outlook (Putnam County) Hauer SSP2
- Today (2025)
- 37,226 people
- By 2030
- 36,723 · -1.4%
- By 2040
- 35,407 · -4.9%
- By 2050
- 34,177 · -8.2%
- By 2075
- 32,038 · -13.9%
- By 2100
- 28,380 · -23.8%
Race, ethnicity, and origin ACS 2023
- Neighborhood character
- Predominantly White (86%)
- Race & ethnicity
- White 86% Black 6% Two or more races 4% Hispanic / Latino 3% Asian 2%
- Common ancestry
- Italian 2% Slovak 2% Lithuanian 1%
- Foreign-born
- 4% · China, Canada
- Languages at home
- 96% English-only · Spanish 1% French/Haitian/Cajun 1% Other Indo-European 1%
Political lean MEDSL · Putnam
- 2024 margin
- Solid R (+52.0) · D 23.1% · R 75.1% · Other 1.8%
- 2008→2024 swing
- -40.0pp toward R · 2008: -12.0pp · 2024: -52.0pp
- All cycles
- 2024: R+52.0 2020: R+50.2 2016: R+49.6 2012: R+32.6 2008: R+12.0
Not yet ingested
- Civics
- —
Market trends
- HPI YoY
- ▼ -58.66%
- Current HPI
- 222.8815
- Rent YoY
- —
- Metro
- —
- State GDP YoY
- ▲ 2.90%
- F500 in state
- 18
Industry mix (Fortune 500 HQ in IN)
| Industry | F500 HQs | Revenue |
|---|---|---|
| Industrial Machinery | 2 | $37B |
|
||
| Healthcare | 1 | $177B |
|
||
| Pharmaceuticals | 1 | $45B |
|
||
| Metals / Steel | 1 | $18B |
|
||
| Agriculture | 1 | $17B |
|
||
| Packaging | 1 | $12B |
|
||
Price history
-12.4% since first listed4 events — show timeline
- 2026-03-23 Price Changed $70,000 IRMLS
- 2025-12-22 Price Changed $75,404 IRMLS
- 2025-09-05 Price Changed $75,905 IRMLS
- 2025-03-17 Listed $79,900 IRMLS
Property tax history
+4.5%/yrLatest (2024): $419 · +5.4% YoY. Source: county tax records.
Cash-flow waterfall
monthlySold comps — $/sqft
last 12 mo · ≤1 miLoading sold comps…