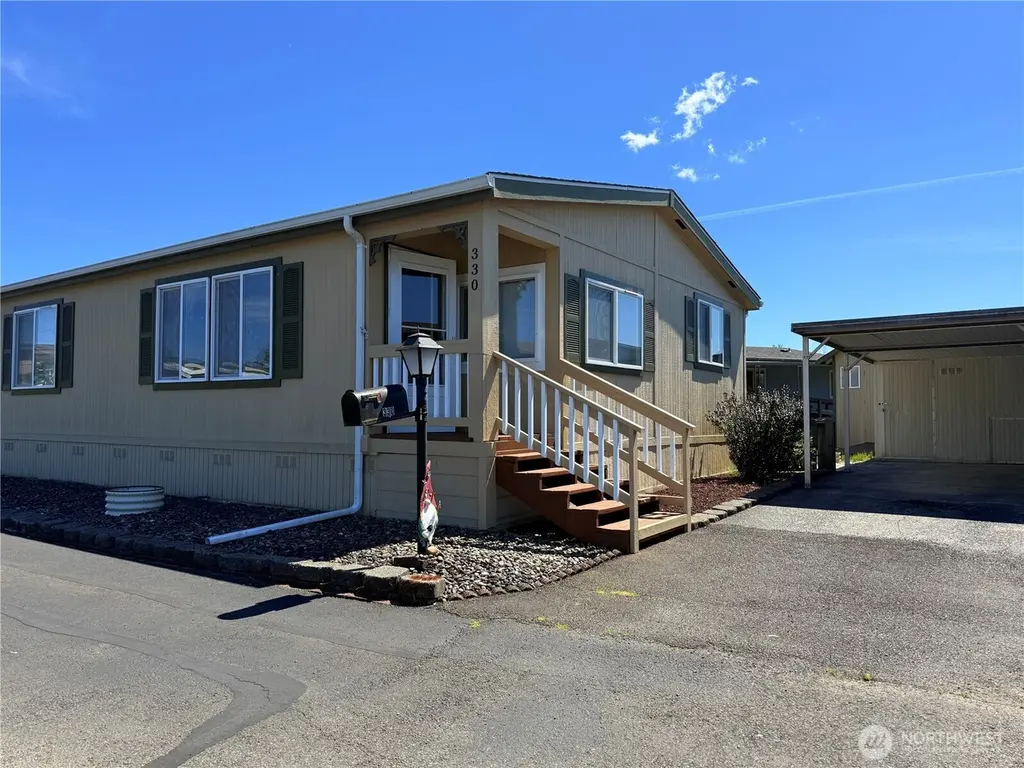
330 Carefree Cir · Aberdeen, WA
Flood risk 4/10 · Minor
- FEMA flood zone
- X
- Chance of flooding over 30 yrs
- 0.22%
- Est. flood insurance / yr
- $507 – $1,088
Fire risk 1/10 · Minimal
- Est. fire insurance / yr
- $604 – $1,122
Heat risk 1/10 · Minimal
- Hot days now (above 78°F)
- 8 days/yr
- Hot days in 30 yrs
- 18 days/yr
Wind risk 1/10 · Minimal
- Chance of severe wind over 30 yrs
- —
Air-quality risk 6/10 · Moderate
- Unhealthy air days now
- 7 days/yr
- Unhealthy air days in 30 yrs
- 7 days/yr
Risk factors via First Street. Map © Google.
Why this score? — see what drove the C+ grade
The composite is a weighted blend of 9 inputs, each scored 0–100. Each bar is that input's sub-score; the figure is the points it added to the 100-point composite (weight × sub-score).
- Cash flow +30.0/30.0
- 1% rule +10.0/10.0
- DSCR +10.0/10.0
- Livability +4.0/5.0
- Rent growth +3.6/5.0
- Schools +3.6/10.0
- Condition / age +2.5/5.0
- ARV discount +0.0/15.0
- Appreciation +0.0/10.0
$79,500
🖨 Deal sheet (PDF) 📄 Offer letter ✓ Due diligence
Listing remarks
Did you know Leisure Manor Mobile Home Park is an all-age park? This well-maintained 1995 manufactured home is situated on a corner lot; you can enjoy as much or as little yard space as you’d like. Very nicely maintained this home features 2 bedrooms and 1.75 baths with a comfortable, open layout and spacious living areas. The vaulted ceilings add warmth and charm throughout the home. The large kitchen offers plenty of storage space, with the utility room close by with a walk out deck to BBQ. while the vaulted ceilings add warmth and charm throughout the home. All appliances you see are included, along with window coverings making this home move-in ready! The primary bedroom features
Key facts
- Walk out deck
- Extra storage
- Large kitchen
Tags
Property features AI
Finance
- Financial info: Listing terms: Cash or Conventional; Annual taxes reported
- HOA & community: Located in Leisure MHP with 172 homes; Park amenities include clubhouse and common area; Land lease: $750
Exterior
- Parking: Carport; Uncovered parking
- Utilities: Electric energy source; Public water (City of Aberdeen); Public sewer (City of Aberdeen); Power provided by Grays Harbor PUD; Internet: Xfinity
- Home design: Manufactured double-wide home (Marlette 42x28); One story; Faces west; Good condition
- Construction: Wood construction; Composition roof; Mobile home remains on site
- Exterior features: Wood exterior products; Paved lot; Has a view
Interior
- Kitchen: Dishwasher; Microwave; Refrigerator; Stove/Range
- Bedrooms: 2 bedrooms
- Flooring: Laminate; Vinyl; Carpet
- Bathrooms: 1 full bath; 1 three-quarter bath; 1 bathtub; 2 showers
- Heating & cooling: Forced air heating; No central cooling
- Interior features: Water heater (electric, located in closet); Drapes
- Laundry & utility: Washer
Neighborhood map
What this means for you Summary
Snapshot
- This is a 2-bed/2.0-bath manufactured listed at $80k.
Deal economics
- At list price, monthly cash flow is $585 ($7k/yr) — positive.
- The deal already cash-flows at list — no discount required.
- Meets the 1% rule at list price ($1k rent vs $80k).
- Recommended offer: $77k (3.0% below list) — sets the bar for market timing.
- Cap rate 15.1% vs local median 4.1% in Aberdeen — top-decile yield for the area; either an underpriced asset or a hidden risk that comps aren't pricing in. Stress-test before assuming the spread holds.
Location & tenants
- Location reads 81/100 on livability (#73 in WA, #1,320 nationally) — a professional / high-income tenant draw. Strengths: amenities A+, commute A+, cost of living A+; Watch: crime D-, employment F.
- Aberdeen School District (town): math 35% / reading 45% proficiency, ranked #222 of 291 in WA (top 76%) — families likely to look elsewhere, expect single-tenant / working-renter base with shorter leases; 61% free/reduced lunch — lower-income household profile, screen leases tightly.
- Zoned schools: J M Weatherwax High School (916 students, 63% FRL) — zoned schools at 63% FRL track the district average.
- Market conditions: Rents rising fast (+4.3%/yr); 257 active listings in the ZIP; 5 comparable units currently listed for rent nearby; rentals lingering (median 45d on market — plan ~5-8 weeks vacancy on turnover, expect pricing pressure); 100% of comp listings sitting > 30 days — soft ceiling on asking rent; 297 units permitted in Grays Harbor County in 2024 (17 in 5+ unit buildings).
Forward outlook
- Local home prices are declining (-3.0%/yr); year-one equity from $550 of loan paydown is wiped out by about $2k of value loss. Plan a longer hold.
- Grays Harbor County population projected at -24% by 2050 — secular population decline; favor cash flow + early exit over multi-decade hold.
- At projected returns (-3.0% appreciation + 4.3% rent growth), your $22k cash investment doubles in ~4 years — after that, you're playing with house money.
Negotiation context
- It's been on market 32 days — a 3% lower offer ($77k) is reasonable based on typical stale-listing flexibility.
- 5 sale attempts since 10y ago with the ask held roughly flat each time — persistent listings suggest the price (not the market) is what's stuck; bring a comps-based counter.
- Current owner paid $67k; 18% above their basis — modest negotiation headroom, anchor on the comps not their cost.
Questions for the listing agent
- It's been on market 32 days. Have you received any prior offers? Is the seller open to a 3% concession, seller financing, or rate buy-down credit?
- Is there a deadline driving the sale (1031 exchange, divorce, estate, relocation)? That informs how much negotiation room exists.
- Schools are D-rated, which usually means shorter tenancies and higher turnover. Who's the typical renter profile here, and what's been the actual vacancy rate?
- Crime grade is D in this area — have there been break-ins, vandalism, or insurance claims at this property in the last 3 years? What carrier currently insures it and at what premium?
- What's the average days-on-market for RENTAL listings here right now (not sales)? A rising rental-DOM trend means longer vacancies and softer asking-rent achievability than the comps imply.
- What's the recent tenant-quality profile in this submarket — average credit score on applications, eviction rate, late-payment / NSF rate, and stable-employment percentage? A property-management company in the area should have these aggregated.
- How much new for-sale + rental construction is in the pipeline within 1–3 miles? Heavy new supply typically softens prices + rents 12–24 months out; constrained supply supports both.
Investment metrics
- 1% rule
- 1.72% ✓
- Cap rate
- 15.12%
- Cash-on-cash
- 31.53%
- DSCR
- 2.40
- GRM
- 4.9
CMA / ARV
- ARV (median comp)
- $55,000
- List price
- $79,500
- Delta
- 44.55%
- Verdict
- OVERPRICED
- Comps
- 15 within 1.0 mi
Show comp detail 7 sales within ~0.75 mi
| Address | Dist | Beds/Ba | Sqft | Sold | Price | $/sf | Match |
|---|---|---|---|---|---|---|---|
| 201 Ho Hum Ln | 0.10mi | 2/1.0 | 1,135 (-4%) | 3mo | $55,000 | $48 | 83 |
| 25 Meander Way | 0.04mi | 3/2.0 (+1) | 1,120 (-5%) | 11mo | $72,500 | $65 | 76 |
| 402 Carefree Cir | 0.12mi | 3/2.0 (+1) | 1,344 (+14%) | 1mo | $82,000 | $61 | 65 |
| 511 Leisure Cir | 0.04mi | 3/2.0 (+1) | 1,344 (+14%) | 10mo | $52,000 | $39 | 60 |
| 1504 S Evans St | 0.59mi | 2/2.0 | 1,142 (-3%) | 10mo | $175,000 | $153 | 59 |
| 115 E Mohler | 0.46mi | 3/2.0 (+1) | 1,080 (-8%) | 7mo | $279,500 | $259 | 54 |
| 1212 S Evans St | 0.45mi | 3/2.0 (+1) | 1,296 (+10%) | 23mo | $304,784 | $235 | 38 |
Match score weights: distance 35% · size 25% · config 20% · recency 20%. Top-matched comps best support the ARV.
Projected returns pro-forma
-3.0% appreciation · 4.35% rent growth · sell at horizon
- IRR
- 27.8%
- Equity multiple
- 2.18×
- Total profit
- $26,229
- Equity at exit
- $11,854
- IRR
- 36.1%
- Equity multiple
- 4.53×
- Total profit
- $78,662
- Equity at exit
- $6,874
Cash invested: $22,260 (down + closing). Projections, not guarantees.
Landlord ↔ Tenant lean methodology
- Overall (STATE)
- 28 Tenant-Leaning
- State Washington
- 28 Tenant-Leaning · D+8
- County
- — inherits STATE
- City
- — inherits STATE
ZIP-level market 98520
- Rents YoY
- 4.3%
- Active inventory
- 257
- Price-to-rent
- 4.9×
Monthly cashflow live
- Estimated rent
- $1,364 high interval (Pro) →
- Mortgage (P&I)
- −$417
- Tax from tax record
- −$42 /mo · $509/yr
- Insurance
- −$33
- HOA
- −$0
- Vacancy / Maint / Mgmt
- −$286
- Net cashflow
- $585
Break-even live
Sensitivity live
| Price | -10% $630 | -5% $607 | +0% $585 | +5% $562 | +10% $540 |
|---|---|---|---|---|---|
| Rent | -10% $477 | -5% $531 | +0% $585 | +5% $639 | +10% $693 |
| Rate | -1.0pp $625 | -0.5pp $605 | base $585 | +0.5pp $564 | +1.0pp $543 |
UW: 25.0% down · 7.5% · 30yr · 1.5% tax · 5.0% vac · 8.0% maint · 8.0% mgmt
Financing live
Cash to close
- Down payment
- $19,875
- Closing costs
- $2,385
- Reserves months
- —
- Total cash needed
- —
Loan-product check · same deal, 3 products live
Conventional
25% down · 7.5% · 30yr
- Down + closing
- —
- Monthly P&I
- —
- Monthly cashflow
- —
- DSCR
- —
- Eligible?
- —
Personal DTI + credit; lowest rate.
DSCR
20% down · 8.5% · 30yr
- Down + closing
- —
- Monthly P&I
- —
- Monthly cashflow
- —
- DSCR
- —
- Eligible?
- —
No personal income docs; deal must DSCR.
Hard money
10% down · 12.0% · 12mo
- Down + closing
- —
- Monthly P&I
- —
- Monthly cashflow
- —
- DSCR
- —
- Eligible?
- —
Short-term bridge; refi at stabilization.
Rent comps 5 comps
| Address | Beds | Baths | Sqft | Rent | $/sqft | DOM | Units | Dist |
|---|---|---|---|---|---|---|---|---|
| 100 W Curtis St Aberdeen, WA | 2.0 | 2.0 | 900 | $1,500 | $1.67 | 44d | 1 | 0.53mi |
| 1200 W Huntley St Unit 3 Aberdeen, WA | 2.0 | 1.0 | 850 | $1,400 | $1.65 | 44d | 1 | 0.69mi |
| 1731 S Boone St Unit 303 Aberdeen, WA | 2.0 | 1.0 | 1100 | $1,250 | $1.14 | 44d | 1 | 0.88mi |
| 109 S Park St Apt 1 Aberdeen, WA | 2.0 | 1.0 | 800 | $1,375 | $1.72 | 45d | 1 | 1.41mi |
| 109 S Park St Apt 2 Aberdeen, WA | 3.0 | 1.0 | 950 | $1,450 | $1.53 | 44d | 1 | 1.41mi |
Listing history 26 events
-
2026-06-19days on market $79,500 Active 32 DOM
-
2026-06-18days on market $79,500 Active 31 DOM
-
2026-06-17days on market $79,500 Active 30 DOM
-
2026-06-16days on market $79,500 Active 29 DOM
-
2026-06-15days on market $79,500 Active 28 DOM
-
2026-06-14days on market $79,500 Active 26 DOM
-
2026-06-12days on market $79,500 Active 25 DOM
-
2026-06-09days on market $79,500 Active 22 DOM
-
2026-06-08days on market $79,500 Active 21 DOM
-
2026-06-07days on market $79,500 Active 20 DOM
-
2026-06-03days on market $79,500 Active 16 DOM
-
2026-06-02days on market $79,500 Active 15 DOM
-
2026-06-01days on market $79,500 Active 14 DOM
-
2026-05-31days on market $79,500 Active 13 DOM
-
2026-05-30days on market $79,500 Active 12 DOM
-
2026-05-15$79,500 Active
-
2025-02-13soldstatus $67,450 Closed
-
2025-01-29status Pending
-
2024-12-31$69,900 Active
-
2020-08-28soldstatus $31,000 Sold
-
2020-08-02status Pending
-
2020-07-27status Pending Inspection
-
2020-07-24$35,000 Active
-
2017-01-13soldstatus $25,000 Sold
-
2017-01-03status Pending
-
2016-11-29$25,000 Active
ⓘ Source: listings_history table (triggers on properties + properties_extension) + one-shot
backfill from property_details.listing_events for pre-trigger history.
Tax reassessment forecast WA · Resets to sale price
- Current annual tax
- $509 · $42/mo
- Projected year-2 tax
- $779 · $65/mo
- Expected delta
- +$270/yr (+$23/mo · 53.1%)
ⓘ Screening estimate from a state-policy table — verify with the county assessor before closing.
Climate risk First Street
- Flood 4/10 Moderate FEMA zone X · 22% chance over 30 yrs
- Wildfire 1/10 Low
- Heat 1/10 Low 8 d/yr ≥78°F today · 18 d/yr by 30 yrs out
- Wind 1/10 Low
- Air quality 6/10 Major 7 unhealthy d/yr today · 7 by 30 yrs out
Nearby sold comps map
Loading sold comps map…
Walkable amenities ~0.75 mi
Loading nearby amenities…
Taxation est. · year 1
- Rental income
- $16,364
- − Mortgage interest
- −$4,453
- − Property taxes
- −$509
- − Insurance
- −$398
- − Repairs & maintenance
- −$1,309
- − Management
- −$1,309
- − Depreciation
- −$2,313
- Taxable income
- $6,073
- Est. tax owed @ 24.0%
- −$1,458
- After-tax cash flow
- $5,560/yr
For passive investors: Depreciation is non-cash, so a rental often shows a tax loss while cash-flowing — sheltering income. Rental losses are passive: they offset passive income freely, and up to $25,000/yr can offset ordinary (W-2) income if you actively participate and your MAGI is under $100k (phasing out to $0 by $150k); unused losses carry forward. On sale, claimed depreciation is recaptured at up to 25%, and gains may owe capital-gains tax (a 1031 exchange can defer both). Figures are a year-1 estimate at your 24.0% rate — not tax advice; consult a CPA.
Schools (NCES district)
- District
- Aberdeen School District
- NCES district ID
- 5300030
- Math proficiency
- 35% ▼ -1.00%
- Reading proficiency
- 45% ▬ 0.00%
- Median HH income
- $41,896
- Composite
- 36.13/100
- National rank
- #9477
- State rank
- #222 of 291 in WA
Livability — Aberdeen
- Score
- 81/100
- State rank
- #73
- US rank
- #1320
Category grades
Schools grade is shown separately in the Schools card above.
Census & demographics
- Census place
- Aberdeen, WA
- County
- Grays Harbor County · 44,693 people
- City population
- 24,888
- Metro
- Aberdeen, WA
- Population (ZIP)
- 24,888
- Household income
- $58,153
- Rent vs Own
- Severe rent burden
- 635.0
Population outlook (Grays Harbor County) Hauer SSP2
- Today (2025)
- 66,443 people
- By 2030
- 63,255 · -4.8%
- By 2040
- 56,466 · -15.0%
- By 2050
- 50,516 · -24.0%
- By 2075
- 39,296 · -40.9%
- By 2100
- 31,142 · -53.1%
Race, ethnicity, and origin ACS 2023
- Neighborhood character
- Predominantly White (70%)
- Race & ethnicity
- White 70% Hispanic / Latino 16% Two or more races 9% Black 4% Native American 3% Asian 1% Pacific Islander 1%
- Hispanic origin (detail)
- Mexican 11%
- Common ancestry
- Portuguese 4% Italian 3% Lithuanian 2%
- Foreign-born
- 7% · Canada
- Languages at home
- 87% English-only · Spanish 10% Other Asian/Pacific 1% German/W. Germanic 1%
Political lean MEDSL · Grays Harbor
- 2024 margin
- Lean R (+6.0) · D 45.6% · R 51.6% · Other 2.8%
- 2008→2024 swing
- -20.6pp toward R · 2008: 14.6pp · 2024: -6.0pp
- All cycles
- 2024: R+6.0 2020: R+6.6 2016: R+7.1 2012: D+14.0 2008: D+14.6
Not yet ingested
- Civics
- —
Market trends
- HPI YoY
- ▼ -138.75%
- Current HPI
- 207.7393
- Rent YoY
- ▲ 4.35%
- Metro
- Aberdeen, WA
- State GDP YoY
- ▲ 4.65%
- F500 in state
- 22
Industry mix (Fortune 500 HQ in WA)
| Industry | F500 HQs | Revenue |
|---|---|---|
| Retail | 2 | $269B |
|
||
| Technology / Retail | 1 | $638B |
|
||
| Technology | 1 | $245B |
|
||
| Telecommunications | 1 | $38B |
|
||
| Food / Beverage | 1 | $36B |
|
||
| Automotive / Trucks | 1 | $34B |
|
||
Price history
+218.0% since first listed13 events — show timeline
- 2026-05-29 Relisted — NWMLS as Distributed by MLS Grid
- 2026-05-26 Pending — NWMLS as Distributed by MLS Grid
- 2026-05-15 Listed $79,500 NWMLS as Distributed by MLS Grid
- 2025-02-13 Sold (MLS) $67,450 NWMLS as Distributed by MLS Grid
- 2025-01-29 Pending — NWMLS as Distributed by MLS Grid
- 2024-12-31 Listed $69,900 NWMLS as Distributed by MLS Grid
- 2020-08-28 Sold (MLS) $31,000 NWMLS as Distributed by MLS Grid
- 2020-08-02 Pending — NWMLS as Distributed by MLS Grid
- 2020-07-27 Pending — NWMLS as Distributed by MLS Grid
- 2020-07-24 Listed $35,000 NWMLS as Distributed by MLS Grid
- 2017-01-13 Sold (MLS) $25,000 NWMLS as Distributed by MLS Grid
- 2017-01-03 Pending — NWMLS as Distributed by MLS Grid
- 2016-11-29 Listed $25,000 NWMLS as Distributed by MLS Grid
Property tax history
+3.0%/yrLatest (2026): $509 · +66.7% YoY. Source: county tax records.
Cash-flow waterfall
monthlySold comps — $/sqft
last 12 mo · ≤1 miLoading sold comps…