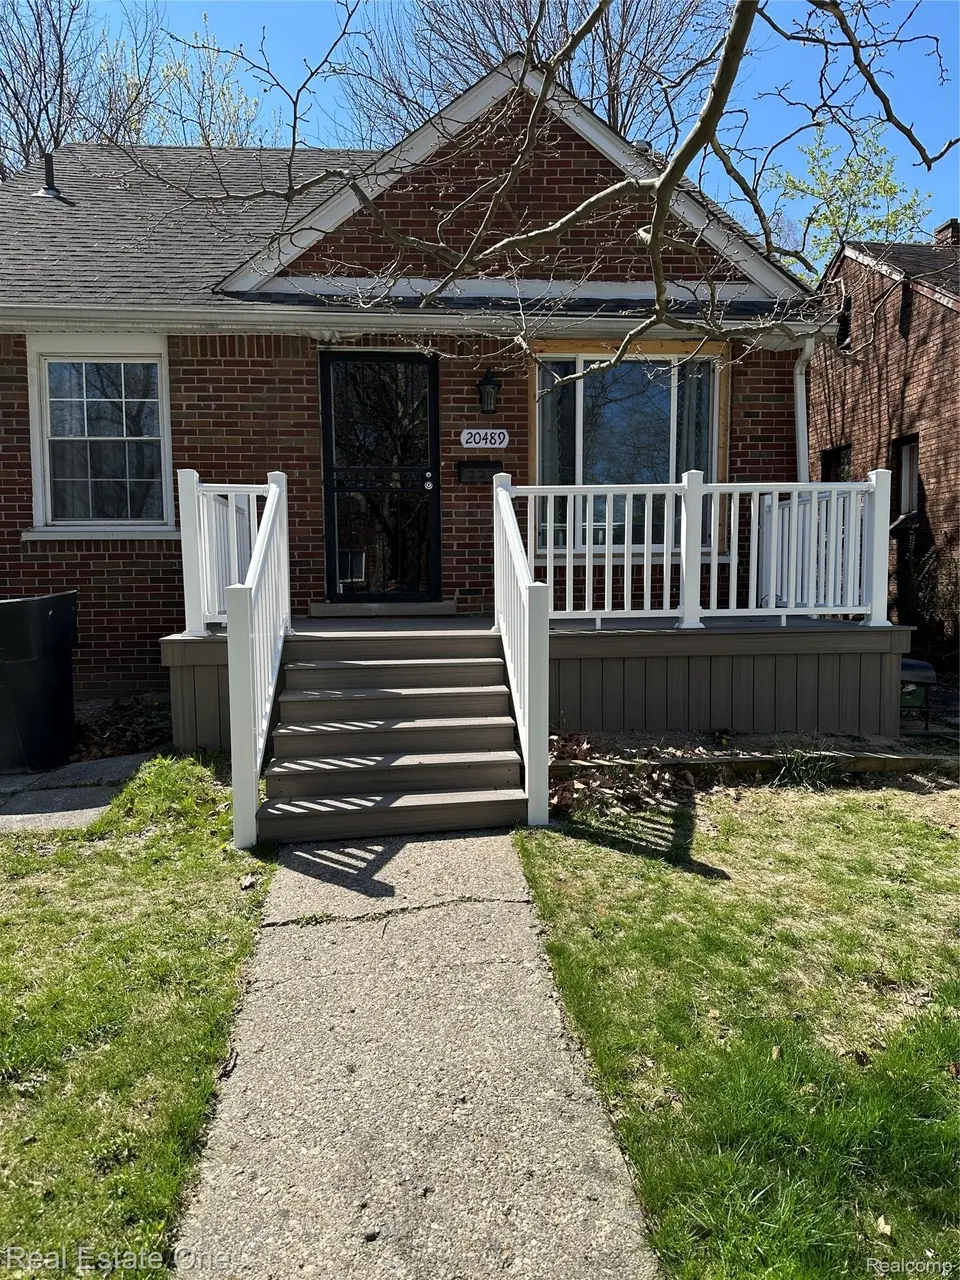
20489 Andover St · Detroit, MI
Flood risk 4/10 · Minor
- FEMA flood zone
- X (unshaded)
- Chance of flooding over 30 yrs
- 0.22%
- Est. flood insurance / yr
- $473 – $860
Fire risk 1/10 · Minimal
- Est. fire insurance / yr
- $784 – $1,456
Heat risk 3/10 · Minor
- Hot days now (above 97°F)
- 7 days/yr
- Hot days in 30 yrs
- 15 days/yr
Wind risk 2/10 · Minimal
- Chance of severe wind over 30 yrs
- —
Air-quality risk 4/10 · Minor
- Unhealthy air days now
- 4 days/yr
- Unhealthy air days in 30 yrs
- 6 days/yr
Risk factors via First Street. Map © Google.
Why this score? — see what drove the B- grade
The composite is a weighted blend of 9 inputs, each scored 0–100. Each bar is that input's sub-score; the figure is the points it added to the 100-point composite (weight × sub-score).
- Cash flow +30.0/30.0
- 1% rule +10.0/10.0
- DSCR +10.0/10.0
- ARV discount +7.5/15.0
- Livability +3.7/5.0
- Rent growth +2.5/5.0
- Condition / age +2.5/5.0
- Schools +1.3/10.0
- Appreciation +0.0/10.0
$65,000
🖨 Deal sheet (PDF) 📄 Offer letter ✓ Due diligence
Listing remarks MLS
Welcome home to a property full of character, major updates, and incredible potential! This spacious 3-bedroom home has seen extensive improvements throughout, making it a fantastic opportunity for an owner-occupant or investor alike. All three bedrooms have now been fully remodeled with updated flooring, refreshed walls, newer windows, modern light fixtures, and updated electrical outlets/switches, creating bright and comfortable living spaces throughout the home. The interior also features beautifully rebuilt staircases with quality craftsmanship and a layout filled with charm and natural light. Outside, enjoy a completely rebuilt front porch - perfect for relaxing mornings or evening downtime. Major exterior improvements have also been completed, including replacement of the rear section of the roof, while the front section remains in solid condition. The home includes a beautiful kitchen appliance package featuring a refrigerator, stove, washer, and dryer, adding immediate value and convenience for the next owner. Property is being sold as-is and presents an excellent opportunity to complete the remaining finishing touches while building equity. Whether you're looking for your next home or your next investment project, this property offers strong upside with many big-ticket updates already completed. Schedule your showing today and come see the progress and potential for yourself!
Key facts
- Rebuilt staircases
- Newer windows
- Updated flooring
Tags
Property features AI
Finance
- Other: Lot roughly 35 x 100 (0.08 acres)
Exterior
- Parking: No garage
- Utilities: Public water; Public sewer
- Home design: Single-family residence; One-and-one-half stories; Ground-level entry with steps; Brick exterior
- Construction: Built with brick construction; Block foundation
- Exterior features: Porch; Paved road access
Interior
- Kitchen: Free-standing electric range; Free-standing refrigerator; Dishwasher not listed
- Bathrooms: 1 full bathroom
- Heating & cooling: Forced air heating (natural gas); No cooling
- Interior features: Electric water heater; Full unfinished basement with sump pump; Lighting
- Laundry & utility: Washer hookup; Electric dryer hookup; Laundry room; Washer; Dryer
Neighborhood map
What this means for you Summary
Snapshot
- This is a 3-bed/1.0-bath single-family listed at $65k.
Deal economics
- At list price, monthly cash flow is $744 ($9k/yr) — positive.
- The deal already cash-flows at list — no discount required.
- Meets the 1% rule at list price ($1k rent vs $65k).
- Recommended offer: $64k (1.5% below list) — sets the bar for market timing.
- Cap rate 20.0% vs local median 10.0% in Detroit — top-decile yield for the area; either an underpriced asset or a hidden risk that comps aren't pricing in. Stress-test before assuming the spread holds.
Location & tenants
- Location reads 73/100 on livability (#218 in MI) — a middle-class / working-renter tenant base. Strengths: amenities A+, commute A+, cost of living A+; Watch: crime F, employment F.
- Detroit Public Schools Community District (urban): math 10% / reading 24% proficiency, ranked #499 of 540 in MI (top 92%) — low school quality limits family demand, transient renter base, plan for 1-2y turnover; 90% free/reduced lunch — lower-income household profile, screen leases tightly.
- Zoned schools: Nolan Elementarymiddle School (math 5% / reading 5%, grade F, #1,325 of 1,397 statewide, top 99%, 449 students, 95% FRL); Pershing High School (math 10% / reading 10%, grade F, #659 of 713 statewide, top 97%, 408 students, 89% FRL) — zoned schools at 92% FRL track the district average.
- Market conditions: 219 active listings in the ZIP; 31 comparable units currently listed for rent nearby; rentals at typical pace (median 27d on market — plan ~3-4 weeks tenant-placement turnaround); lower-income renter base — watch delinquency; 2,639 units permitted in Wayne County in 2024 (1,216 in 5+ unit buildings).
- At $1,471/mo this rent would consume 46% of the median local household income ($38k/yr) (locally 1192% of renters already pay >50% of income on rent) — very limited rent-growth headroom before tenants either downsize or default.
Forward outlook
- Local home prices are declining (-3.0%/yr); year-one equity from $449 of loan paydown is wiped out by about $2k of value loss. Plan a longer hold.
- Wayne County population projected at -17% by 2050 — secular population decline; favor cash flow + early exit over multi-decade hold.
- At projected returns (-3.0% appreciation + 3.0% rent growth), your $18k cash investment doubles in ~3 years — after that, you're playing with house money.
Negotiation context
- It's been on market 21 days — a 2% lower offer ($64k) is reasonable based on typical stale-listing flexibility.
- 5 sale attempts since 24y ago with the ask held roughly flat each time — persistent listings suggest the price (not the market) is what's stuck; bring a comps-based counter.
Risks & watch-outs
- Watch-outs: built in 1951 — expect roof / HVAC / electrical / plumbing capex.
Questions for the listing agent
- Built in 1951 — when were the roof, HVAC, electrical panel, plumbing, and water heater last replaced?
- Is there a deadline driving the sale (1031 exchange, divorce, estate, relocation)? That informs how much negotiation room exists.
- Schools are F-rated, which usually means shorter tenancies and higher turnover. Who's the typical renter profile here, and what's been the actual vacancy rate?
- Crime grade is F in this area — have there been break-ins, vandalism, or insurance claims at this property in the last 3 years? What carrier currently insures it and at what premium?
- What's the average days-on-market for RENTAL listings here right now (not sales)? A rising rental-DOM trend means longer vacancies and softer asking-rent achievability than the comps imply.
- What's the recent tenant-quality profile in this submarket — average credit score on applications, eviction rate, late-payment / NSF rate, and stable-employment percentage? A property-management company in the area should have these aggregated.
- How much new for-sale + rental construction is in the pipeline within 1–3 miles? Heavy new supply typically softens prices + rents 12–24 months out; constrained supply supports both.
Investment metrics
- 1% rule
- 2.26% ✓
- Cap rate
- 20.04%
- Cash-on-cash
- 49.09%
- DSCR
- 3.18
- GRM
- 3.7
CMA / ARV
- ARV (on-the-fly)
- $175,599
- Comps found
- 12
Show comp detail 12 sales within ~0.75 mi
| Address | Dist | Beds/Ba | Sqft | Sold | Price | $/sf | Match |
|---|---|---|---|---|---|---|---|
| 128 W Muir Ave | 0.32mi | 3/1.0 | 966 (-2%) | 2mo | $132,500 | $137 | 81 |
| 20747 Caledonia Ave | 0.17mi | 3/1.0 | 909 (-7%) | 2mo | $144,900 | $159 | 78 |
| 145 W Bernhard Ave | 0.45mi | 2/1.0 (-1) | 968 (-1%) | 2mo | $60,000 | $62 | 70 |
| 1218 E Milton Ave | 0.50mi | 3/1.0 | 1,021 (+4%) | 1mo | $155,000 | $152 | 69 |
| 1448 E Webster St | 0.66mi | 3/1.0 | 985 (+0%) | 0mo | $205,000 | $208 | 68 |
| 1107 E Muir Ave | 0.38mi | 3/1.0 | 1,081 (+10%) | 1mo | $147,900 | $137 | 64 |
| 20401 Greeley St | 0.59mi | 3/1.0 | 928 (-5%) | 1mo | $55,000 | $59 | 63 |
| 21330 Caledonia Ave | 0.45mi | 3/1.5 | 898 (-8%) | 1mo | $175,000 | $195 | 62 |
| 1491 E Webster St | 0.66mi | 3/1.0 | 908 (-7%) | 2mo | $180,000 | $198 | 56 |
| 750 E Hayes Ave | 0.29mi | 4/1.5 (+1) | 1,125 (+15%) | 2mo | $212,500 | $189 | 53 |
| 1032 E Maxlow Ave | 0.54mi | 2/1.5 (-1) | 867 (-12%) | 1mo | $185,000 | $213 | 48 |
| 720 E Granet Ave | 0.66mi | 2/1.0 (-1) | 891 (-9%) | 3mo | $159,900 | $179 | 46 |
Match score weights: distance 35% · size 25% · config 20% · recency 20%. Top-matched comps best support the ARV.
Projected returns pro-forma
-3.0% appreciation · 3.0% rent growth · sell at horizon
- IRR
- 46.7%
- Equity multiple
- 3.03×
- Total profit
- $36,888
- Equity at exit
- $9,692
- IRR
- 52.4%
- Equity multiple
- 6.12×
- Total profit
- $93,190
- Equity at exit
- $5,620
Cash invested: $18,200 (down + closing). Projections, not guarantees.
Landlord ↔ Tenant lean methodology
- Overall (STATE)
- 62 Landlord-Friendly
- State Michigan
- 62 Landlord-Friendly · EVEN
- County
- — inherits STATE
- City
- — inherits STATE
ZIP-level market 48203
- Home prices YoY
- -23.3%
- Active inventory
- 219
- Price-to-rent
- 3.7×
Monthly cashflow live
- Estimated rent
- $1,471 high interval (Pro) →
- Mortgage (P&I)
- −$341
- Tax from tax record
- −$50 /mo · $599/yr
- Insurance
- −$27
- HOA
- −$0
- Vacancy / Maint / Mgmt
- −$309
- Net cashflow
- $744
Break-even live
Sensitivity live
| Price | -10% $781 | -5% $763 | +0% $744 | +5% $726 | +10% $708 |
|---|---|---|---|---|---|
| Rent | -10% $628 | -5% $686 | +0% $744 | +5% $803 | +10% $861 |
| Rate | -1.0pp $777 | -0.5pp $761 | base $744 | +0.5pp $728 | +1.0pp $711 |
UW: 25.0% down · 7.5% · 30yr · 1.5% tax · 5.0% vac · 8.0% maint · 8.0% mgmt
Financing live
Cash to close
- Down payment
- $16,250
- Closing costs
- $1,950
- Reserves months
- —
- Total cash needed
- —
Loan-product check · same deal, 3 products live
Conventional
25% down · 7.5% · 30yr
- Down + closing
- —
- Monthly P&I
- —
- Monthly cashflow
- —
- DSCR
- —
- Eligible?
- —
Personal DTI + credit; lowest rate.
DSCR
20% down · 8.5% · 30yr
- Down + closing
- —
- Monthly P&I
- —
- Monthly cashflow
- —
- DSCR
- —
- Eligible?
- —
No personal income docs; deal must DSCR.
Hard money
10% down · 12.0% · 12mo
- Down + closing
- —
- Monthly P&I
- —
- Monthly cashflow
- —
- DSCR
- —
- Eligible?
- —
Short-term bridge; refi at stabilization.
Rent comps 31 comps
| Address | Beds | Baths | Sqft | Rent | $/sqft | DOM | Units | Dist |
|---|---|---|---|---|---|---|---|---|
| 407 E Hayes Ave Hazel Park, MI | 3.0 | 1.0 | 1000 | $1,750 | $1.75 | 26d | 1 | 0.25mi |
| 429 E Milton Ave Hazel Park, MI | 3.0 | 2.0 | 1075 | $1,595 | $1.48 | 1d | 1 | 0.30mi |
| 155 W George Ave Hazel Park, MI | 2.0 | 1.0 | 725 | $1,000 | $1.38 | 26d | 1 | 0.35mi |
| 1019 E Hayes Ave Unit 1032331P Hazel Park, MI | 3.0 | 1.0 | 1033 | $5,281 | $5.11 | 0d | 1 | 0.41mi |
| 19703 Keating St Highland Park, MI | 3.0 | 1.0 | 1000 | $1,200 | $1.20 | 19d | 1 | 0.50mi |
| 1211 E Bernhard Ave Hazel Park, MI | 2.0 | 1.0 | 721 | $1,500 | $2.08 | 26d | 1 | 0.54mi |
| 1561 E Webster St Ferndale, MI | 2.0 | 1.0 | 939 | $1,600 | $1.70 | 26d | 1 | 0.62mi |
| 90 W Meyers Ave Hazel Park, MI | 2.0 | 1.0 | 831 | $1,800 | $2.17 | 26d | 1 | 0.66mi |
| 1326 E Evelyn Ave Unit 1032332P Hazel Park, MI | 3.0 | 2.0 | 1097 | $6,448 | $5.88 | 0d | 1 | 0.67mi |
| 1621 E Evelyn Ave Hazel Park, MI | 2.0 | 1.0 | 749 | $1,295 | $1.73 | 20d | 1 | 0.84mi |
| 2034 John B Ave Warren, MI | 3.0 | 1.0 | 920 | $1,261 | $1.37 | 46d | 1 | 0.96mi |
| 790 Jewell St Ferndale, MI | 2.0 | 1.0 | 800 | $1,445 | $1.81 | 26d | 1 | 1.01mi |
| 266 W Goulson Ave Hazel Park, MI | 3.0 | 1.0 | 942 | $1,600 | $1.70 | 24d | 1 | 1.03mi |
| 21516 Dequindre Rd Warren, MI | 1.0–2.0 | 1.0 | 837 | $1,375 | $1.64 | 24d | 1 | 1.03mi |
| 2023 Ardmore Dr Ferndale, MI | 2.0 | 1.0 | 771 | $1,250 | $1.62 | 26d | 1 | 1.05mi |
| 1412 E Goulson Ave Hazel Park, MI | 3.0 | 2.0 | 1104 | $1,700 | $1.54 | 0d | 1 | 1.07mi |
| 1291 W State Fair Ave Detroit, MI | 1.0–2.0 | 1.0 | 700 | $950 | $1.36 | 14d | 2 | 1.08mi |
| 1731 E Pearl Ave Hazel Park, MI | 3.0 | 1.0 | 844 | $1,500 | $1.78 | 22d | 1 | 1.10mi |
| 23115 Tawas Ave Hazel Park, MI | 2.0 | 1.0 | 706 | $1,375 | $1.95 | 26d | 1 | 1.19mi |
| 404 W Golden Gate Highland Park, MI | 2.0 | 1.0 | 1050 | $1,100 | $1.05 | 46d | 1 | 1.22mi |
| 406 W Goldengate St Detroit, MI | 2.0 | 1.0 | 1050 | $1,100 | $1.05 | 46d | 1 | 1.23mi |
| 21155 Warner Ave Warren, MI | 2.0 | 1.0 | 756 | $1,029 | $1.36 | 26d | 1 | 1.24mi |
| 23345 Tawas Ave Hazel Park, MI | 3.0 | 1.0 | 1000 | $1,550 | $1.55 | 13d | 1 | 1.29mi |
| 18882 Marx St Highland Park, MI | 2.0 | 1.0 | 1000 | $1,300 | $1.30 | 46d | 1 | 1.29mi |
| 20255 Harned St Detroit, MI | 3.0 | 1.0 | 1000 | $1,374 | $1.37 | 19d | 1 | 1.31mi |
| 23077 Davey Ave Hazel Park, MI | 3.0 | 1.0 | 933 | $1,895 | $2.03 | 26d | 1 | 1.36mi |
| 2033 Wrenson St Ferndale, MI | 3.0 | 1.0 | 816 | $1,675 | $2.05 | 1d | 1 | 1.43mi |
| 23773 Hazelwood Ave Hazel Park, MI | 2.0 | 1.0 | 671 | $1,400 | $2.09 | 14d | 1 | 1.48mi |
| 224 Fielding St Ferndale, MI | 2.0 | 1.0 | 1000 | $1,800 | $1.80 | 26d | 1 | 1.49mi |
| 226 Fielding St Ferndale, MI | 2.0 | 1.0 | 1000 | $1,500 | $1.50 | 26d | 1 | 1.49mi |
| 18551 Saint Aubin St Detroit, MI | 3.0 | 1.0 | 962 | $1,200 | $1.25 | 19d | 1 | 1.50mi |
Listing history 14 events
-
2026-06-21days on market $65,000 Active 21 DOM
-
2026-06-18days on market $65,000 Active 18 DOM
-
2026-06-17days on market $65,000 Active 17 DOM
-
2026-06-15days on market $65,000 Active 15 DOM
-
2026-06-13days on market $65,000 Active 13 DOM
-
2026-06-13days on market $65,000 Active 12 DOM
-
2026-06-09days on market $65,000 Active 9 DOM
-
2026-06-08days on market $65,000 Active 8 DOM
-
2026-06-07days on market $65,000 Active 7 DOM
-
2026-06-04days on market $65,000 Active 4 DOM
-
2026-06-03days on market $65,000 Active 3 DOM
-
2026-06-02days on market $65,000 Active 2 DOM
-
2026-05-31remarks 693-char remark
-
2026-05-31$65,000 Active 1 DOM
ⓘ Source: listings_history table (triggers on properties + properties_extension) + one-shot
backfill from property_details.listing_events for pre-trigger history.
Tax reassessment forecast MI · Partial reset (capped growth)
- Current annual tax
- $599 · $50/mo
- Projected year-2 tax
- $800 · $67/mo
- Expected delta
- +$201/yr (+$17/mo · 33.6%)
ⓘ Screening estimate from a state-policy table — verify with the county assessor before closing.
Climate risk First Street
- Flood 4/10 Moderate FEMA zone X (unshaded) · 22% chance over 30 yrs
- Wildfire 1/10 Low
- Heat 3/10 Moderate 7 d/yr ≥97°F today · 15 d/yr by 30 yrs out
- Wind 2/10 Low
- Air quality 4/10 Moderate 4 unhealthy d/yr today · 6 by 30 yrs out
Nearby sold comps map
Loading sold comps map…
Walkable amenities ~0.75 mi
Loading nearby amenities…
Taxation est. · year 1
- Rental income
- $17,656
- − Mortgage interest
- −$3,641
- − Property taxes
- −$599
- − Insurance
- −$325
- − Repairs & maintenance
- −$1,412
- − Management
- −$1,412
- − Depreciation
- −$1,891
- Taxable income
- $8,375
- Est. tax owed @ 24.0%
- −$2,010
- After-tax cash flow
- $6,924/yr
For passive investors: Depreciation is non-cash, so a rental often shows a tax loss while cash-flowing — sheltering income. Rental losses are passive: they offset passive income freely, and up to $25,000/yr can offset ordinary (W-2) income if you actively participate and your MAGI is under $100k (phasing out to $0 by $150k); unused losses carry forward. On sale, claimed depreciation is recaptured at up to 25%, and gains may owe capital-gains tax (a 1031 exchange can defer both). Figures are a year-1 estimate at your 24.0% rate — not tax advice; consult a CPA.
Schools (NCES district)
- District
- Detroit Public Schools Community District
- NCES district ID
- 2601103
- Math proficiency
- 10% ▼ -2.00%
- Reading proficiency
- 24% ▲ 6.00%
- Median HH income
- $25,815
- Composite
- 13.06/100
- National rank
- #9564
- State rank
- #499 of 540 in MI
Livability — Detroit
- Score
- 73/100
- State rank
- #218
- US rank
- #5427
Category grades
Schools grade is shown separately in the Schools card above.
Census & demographics
- Census place
- Detroit, MI
- County
- Wayne County · 1,562,939 people
- City population
- 572,865
- Metro
- Detroit-Warren-Dearborn, MI
- Population (ZIP)
- 20,049
- Household income
- $38,404
- Rent vs Own
- Severe rent burden
- 1192.0
Population outlook (Wayne County) Hauer SSP2
- Today (2025)
- 1,675,273 people
- By 2030
- 1,620,300 · -3.3%
- By 2040
- 1,502,341 · -10.3%
- By 2050
- 1,384,039 · -17.4%
- By 2075
- 1,124,592 · -32.9%
- By 2100
- 881,193 · -47.4%
Race, ethnicity, and origin ACS 2023
- Neighborhood character
- Predominantly Black (85%)
- Race & ethnicity
- Black 85% White 8% Two or more races 5% Hispanic / Latino 2%
- Common ancestry
- Lithuanian 1%
- Foreign-born
- 2% · Canada
- Languages at home
- 95% English-only · Spanish 3% French/Haitian/Cajun 1%
Political lean MEDSL · Wayne
- 2024 margin
- Strong D (+29.0) · D 62.7% · R 33.7% · Other 3.6%
- 2008→2024 swing
- -20.5pp toward R · 2008: 49.5pp · 2024: 29.0pp
- All cycles
- 2024: D+29.0 2020: D+38.1 2016: D+37.3 2012: D+46.9 2008: D+49.5
Not yet ingested
- Civics
- —
Market trends
- HPI YoY
- ▼ -90.13%
- Current HPI
- 297.0176
- Rent YoY
- —
- Metro
- Detroit-Warren-Dearborn, MI
- State GDP YoY
- ▲ 1.37%
- F500 in state
- 28
Industry mix (Fortune 500 HQ in MI)
| Industry | F500 HQs | Revenue |
|---|---|---|
| Automotive Parts | 3 | $48B |
|
||
| Automotive | 2 | $372B |
|
||
| Chemicals | 1 | $45B |
|
||
| Automotive Retail | 1 | $29B |
|
||
| Healthcare / Medical Devices | 1 | $23B |
|
||
| Automotive Technology | 1 | $20B |
|
||
Price history
+8.3% since first listed8 events — show timeline
- 2026-05-24 Listed $65,000 REALCOMP
- 2026-05-24 Listed $65,000 MiRealSource-MiMLS
- 2025-05-12 Listing Removed — MiRealSource-MiMLS
- 2025-04-28 Listed $75,000 REALCOMP
- 2025-04-25 Listed $75,000 MiRealSource-MiMLS
- 2007-07-19 Sold (Public Records) $92,900 Public Records
- 2003-01-04 Listing Removed — REALCOMP
- 2002-10-04 Listed $60,000 REALCOMP
Property tax history
-4.6%/yrLatest (2025): $599 · -8.2% YoY. Source: county tax records.
Cash-flow waterfall
monthlySold comps — $/sqft
last 12 mo · ≤1 miLoading sold comps…