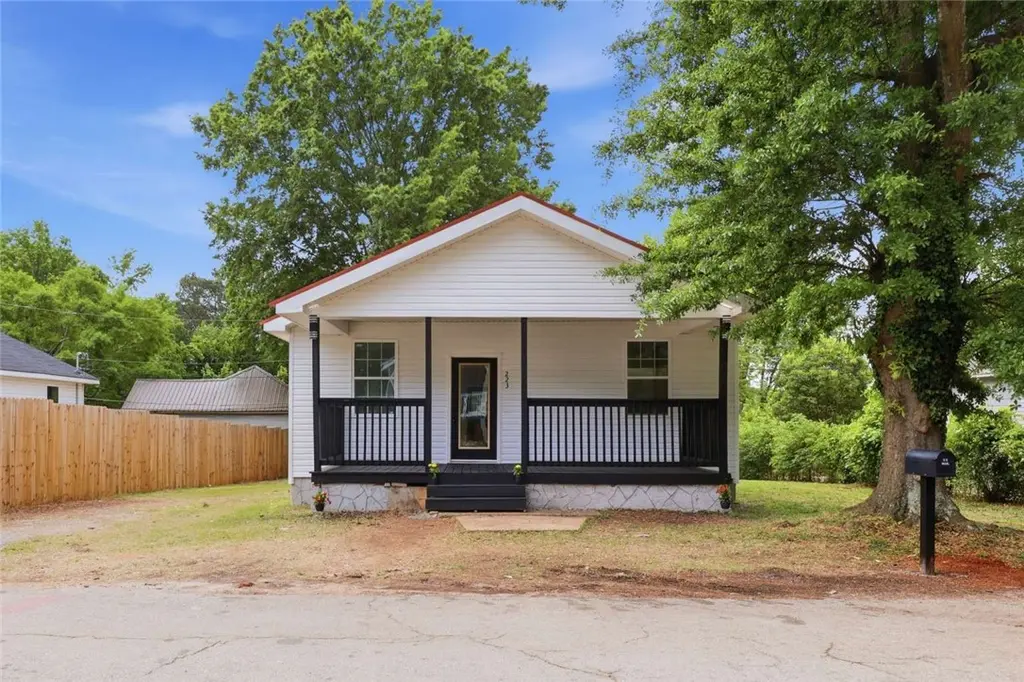
223 Foster St · Anderson, SC
Flood risk 1/10 · Minimal
- FEMA flood zone
- X (unshaded)
- Chance of flooding over 30 yrs
- 0.0%
- Est. flood insurance / yr
- $507 – $1,088
Fire risk 3/10 · Minor
- Est. fire insurance / yr
- $783 – $1,453
Heat risk 6/10 · Moderate
- Hot days now (above 105°F)
- 7 days/yr
- Hot days in 30 yrs
- 17 days/yr
Wind risk 2/10 · Minimal
- Chance of severe wind over 30 yrs
- 4.0%
Air-quality risk 3/10 · Minor
- Unhealthy air days now
- 3 days/yr
- Unhealthy air days in 30 yrs
- 3 days/yr
Risk factors via First Street. Map © Google.
Why this score? — see what drove the D grade
The composite is a weighted blend of 9 inputs, each scored 0–100. Each bar is that input's sub-score; the figure is the points it added to the 100-point composite (weight × sub-score).
- Cash flow +14.9/30.0
- ARV discount +7.5/15.0
- DSCR +4.5/10.0
- Schools +3.9/10.0
- Livability +3.4/5.0
- 1% rule +3.1/10.0
- Rent growth +2.7/5.0
- Condition / age +2.5/5.0
- Appreciation +0.0/10.0
$180,000
🖨 Deal sheet (PDF) 📄 Offer letter ✓ Due diligence
Listing remarks
This four-bedroom home is fully renovated and ready to live in right now. Walk in and you'll see modern finishes, solid systems, and a space that actually flows. The open kitchen and living areas connect naturally, so cooking dinner doesn't mean missing the conversation. The bedrooms give you real options. Primary suite, plus three more rooms for guests, a home office, whatever you need. & nbsp; Here's where it gets good. The front porch is your front row seat to the neighborhood. The back porch extends into a substantial backyard that's actually built for living in it. Grill with friends on a Saturday night. Play in your spacious yard or Gather around a fire pit. This is where life ha
Key facts
- Fully renovated
- Front porch
- Fire pit
Tags
Property features AI
Exterior
- Utilities: Public water; Public sewer
- Home design: Single-story home; Facing direction not specified
- Construction: Built within the last 11–20 years; Vinyl siding; Wood siding; Metal roof; Crawlspace foundation
- Exterior features: City lot; Not in a subdivision
Interior
- Bedrooms: 4 main-level bedrooms
- Bathrooms: 2 full bathrooms (both on the main level)
- Heating & cooling: Central heating (electric); Central air conditioning (electric)
- Interior features: Crawl space basement
Neighborhood map
What this means for you Summary
Snapshot
- This is a 3-bed/2.0-bath other listed at $180k.
Deal economics
- At list price, monthly cash flow is $52 ($623/yr) — positive.
- The deal already cash-flows at list — no discount required.
- To meet the 1% rule (rent ≥ 1% of price), the offer needs to be $145k (19.5% below list).
- Recommended offer: $145k (19.5% below list) — sets the bar for 1% rule.
- Cap rate 6.6% vs local median 3.2% in Anderson — top-decile yield for the area; either an underpriced asset or a hidden risk that comps aren't pricing in. Stress-test before assuming the spread holds.
Location & tenants
- Location reads 67/100 on livability (#98 in SC) — a middle-class / working-renter tenant base. Strengths: cost of living A+, health & safety A+, housing B+; Watch: amenities C-, crime F, commute F.
- Anderson 05 (suburban): math 44% / reading 49% proficiency, ranked #20 of 80 in SC (top 25%) — families likely to look elsewhere, expect single-tenant / working-renter base with shorter leases.
- Zoned schools: New Prospect Elementary (math 33% / reading 29%, grade F, #385 of 597 statewide, top 65%, 464 students, 100% FRL); Westside High (math 53% / reading 75%, grade B-, #92 of 196 statewide, top 48%, 1,769 students, 89% FRL) — zoned schools average 94% FRL vs 52% district-wide (43 pts higher); higher-poverty schools than district average — tighter screening recommended.
- Market conditions: Rents flat; 331 active listings in the ZIP; 7 comparable units currently listed for rent nearby; rentals at typical pace (median 23d on market — plan ~3-4 weeks tenant-placement turnaround); 1,255 units permitted in Anderson County in 2024 (0 in 5+ unit buildings).
Forward outlook
- Local home prices are declining (-3.0%/yr); year-one equity from $1k of loan paydown is wiped out by about $5k of value loss. Plan a longer hold.
- Anderson County population projected at +14% by 2050 — modest demand growth; plan on rents tracking national, not racing it.
Negotiation context
- It's been on market 24 days — a 2% lower offer ($177k) is reasonable based on typical stale-listing flexibility.
- 2 sale attempts with the ask held roughly flat each time — persistent listings suggest the price (not the market) is what's stuck; bring a comps-based counter.
- Current owner paid $45k; list at $180k implies a 300% gain — meaningful room to come down on a strong offer.
Risks & watch-outs
- Climate carrying-cost: extreme-heat days projected 7→17/yr by 2055 (HVAC capex compounding) — expect insurance premiums to compound above CPI over the hold.
Questions for the listing agent
- Is there a deadline driving the sale (1031 exchange, divorce, estate, relocation)? That informs how much negotiation room exists.
- Schools are D-rated, which usually means shorter tenancies and higher turnover. Who's the typical renter profile here, and what's been the actual vacancy rate?
- Crime grade is F in this area — have there been break-ins, vandalism, or insurance claims at this property in the last 3 years? What carrier currently insures it and at what premium?
- The area grade is low — what's the realistic commute time and amenity access for the typical tenant pool here? Any planned neighborhood developments (good or bad) we should know about?
- What's the average days-on-market for RENTAL listings here right now (not sales)? A rising rental-DOM trend means longer vacancies and softer asking-rent achievability than the comps imply.
- What's the recent tenant-quality profile in this submarket — average credit score on applications, eviction rate, late-payment / NSF rate, and stable-employment percentage? A property-management company in the area should have these aggregated.
- How much new for-sale + rental construction is in the pipeline within 1–3 miles? Heavy new supply typically softens prices + rents 12–24 months out; constrained supply supports both.
Investment metrics
- 1% rule
- 0.81% ✗
- Cap rate
- 6.64%
- Cash-on-cash
- 1.24%
- DSCR
- 1.05
- GRM
- 10.3
CMA / ARV
No comps found within radius.
Projected returns pro-forma
-3.0% appreciation · 0.75% rent growth · sell at horizon
- IRR
- -16.6%
- Equity multiple
- 0.42×
- Total profit
- $-29,143
- Equity at exit
- $26,839
- IRR
- -12.6%
- Equity multiple
- 0.33×
- Total profit
- $-33,999
- Equity at exit
- $15,563
Cash invested: $50,400 (down + closing). Projections, not guarantees.
Landlord ↔ Tenant lean methodology
- Overall (STATE)
- 90 Strongly Landlord-Friendly
- State South Carolina
- 90 Strongly Landlord-Friendly · R+6
- County
- — inherits STATE
- City
- — inherits STATE
ZIP-level market 29625
- Rents YoY
- 0.8%
- Active inventory
- 331
- Price-to-rent
- 10.3×
Monthly cashflow live
- Estimated rent
- $1,450 high interval (Pro) →
- Mortgage (P&I)
- −$944
- Tax from tax record
- −$74 /mo · $892/yr
- Insurance
- −$75
- HOA
- −$0
- Vacancy / Maint / Mgmt
- −$304
- Net cashflow
- $52
Break-even live
Sensitivity live
| Price | -10% $154 | -5% $103 | +0% $52 | +5% $1 | +10% $-50 |
|---|---|---|---|---|---|
| Rent | -10% $-63 | -5% $-5 | +0% $52 | +5% $109 | +10% $166 |
| Rate | -1.0pp $143 | -0.5pp $98 | base $52 | +0.5pp $5 | +1.0pp $-42 |
UW: 25.0% down · 7.5% · 30yr · 1.5% tax · 5.0% vac · 8.0% maint · 8.0% mgmt
Financing live
Cash to close
- Down payment
- $45,000
- Closing costs
- $5,400
- Reserves months
- —
- Total cash needed
- —
Loan-product check · same deal, 3 products live
Conventional
25% down · 7.5% · 30yr
- Down + closing
- —
- Monthly P&I
- —
- Monthly cashflow
- —
- DSCR
- —
- Eligible?
- —
Personal DTI + credit; lowest rate.
DSCR
20% down · 8.5% · 30yr
- Down + closing
- —
- Monthly P&I
- —
- Monthly cashflow
- —
- DSCR
- —
- Eligible?
- —
No personal income docs; deal must DSCR.
Hard money
10% down · 12.0% · 12mo
- Down + closing
- —
- Monthly P&I
- —
- Monthly cashflow
- —
- DSCR
- —
- Eligible?
- —
Short-term bridge; refi at stabilization.
Rent comps 7 comps
| Address | Beds | Baths | Sqft | Rent | $/sqft | DOM | Units | Dist |
|---|---|---|---|---|---|---|---|---|
| 1208 W Whitner St Anderson, SC | 3.0 | 2.0 | 1432 | $1,450 | $1.01 | 16d | 1 | 0.40mi |
| 7 O St Anderson, SC | 3.0 | 1.0 | 1100 | $1,275 | $1.16 | 16d | 1 | 0.44mi |
| 1206 Stephens St Anderson, SC | 3.0 | 1.0 | 1100 | $995 | $0.90 | 25d | 1 | 1.06mi |
| 201 S Murray Ave Anderson, SC | 1.0–2.0 | 1.0–2.0 | 1010 | $2,200 | $2.18 | 4d | 1 | 1.22mi |
| 611 Bonham Ct Unit A Anderson, SC | 2.0 | 1.0 | 963 | $1,150 | $1.19 | 25d | 1 | 1.39mi |
| 408 Central Ave Anderson, SC | 3.0 | 2.0 | 1694 | $1,795 | $1.06 | 25d | 1 | 1.43mi |
| 509 N Fant St Anderson, SC | 3.0 | 1.5 | 1500 | $1,450 | $0.97 | 23d | 1 | 1.45mi |
Listing history 10 events
-
2026-06-03statusdays on market $180,000 Pending 24 DOM
-
2026-06-03days on market $180,000 Active 23 DOM
-
2026-06-01days on market $180,000 Active 22 DOM
-
2026-05-31days on market $180,000 Active 21 DOM
-
2026-05-16status Active
-
2026-05-06status Pending
-
2026-04-30$180,000 Active
-
2025-12-12soldstatus $45,000
-
2008-08-13soldstatus $10,000
-
1997-10-10soldstatus $10,000
ⓘ Source: listings_history table (triggers on properties + properties_extension) + one-shot
backfill from property_details.listing_events for pre-trigger history.
Tax reassessment forecast SC · Resets to sale price
- Current annual tax
- $892 · $74/mo
- Projected year-2 tax
- $1,026 · $86/mo
- Expected delta
- +$134/yr (+$11/mo · 15.1%)
ⓘ Screening estimate from a state-policy table — verify with the county assessor before closing.
Climate risk First Street
- Flood 1/10 Low FEMA zone X (unshaded) · 0% chance over 30 yrs
- Wildfire 3/10 Moderate
- Heat 6/10 Major 7 d/yr ≥105°F today · 17 d/yr by 30 yrs out
- Wind 2/10 Low 4% chance of damaging wind over 30 yrs
- Air quality 3/10 Moderate 3 unhealthy d/yr today · 3 by 30 yrs out
Nearby sold comps map
Loading sold comps map…
Walkable amenities ~0.75 mi
Loading nearby amenities…
Taxation est. · year 1
- Rental income
- $17,394
- − Mortgage interest
- −$10,083
- − Property taxes
- −$892
- − Insurance
- −$900
- − Repairs & maintenance
- −$1,392
- − Management
- −$1,392
- − Depreciation
- −$5,236
- Taxable loss
- −$2,500
- Est. tax savings @ 24.0%
- +$600
- After-tax cash flow
- $1,223/yr
For passive investors: Depreciation is non-cash, so a rental often shows a tax loss while cash-flowing — sheltering income. Rental losses are passive: they offset passive income freely, and up to $25,000/yr can offset ordinary (W-2) income if you actively participate and your MAGI is under $100k (phasing out to $0 by $150k); unused losses carry forward. On sale, claimed depreciation is recaptured at up to 25%, and gains may owe capital-gains tax (a 1031 exchange can defer both). Figures are a year-1 estimate at your 24.0% rate — not tax advice; consult a CPA.
Schools (NCES district)
- District
- Anderson 05
- NCES district ID
- 4500900
- Math proficiency
- 44% ▼ -4.00%
- Reading proficiency
- 49% ▲ 2.00%
- Median HH income
- $39,718
- Composite
- 38.89/100
- National rank
- #4098
- State rank
- #20 of 80 in SC
Livability — Anderson
- Score
- 67/100
- State rank
- #98
- US rank
- #10772
Category grades
Schools grade is shown separately in the Schools card above.
Census & demographics
- County
- Anderson County · 99,076 people
- City population
- 87,992
- Metro
- Greenville-Anderson, SC
- Population (ZIP)
- 28,012
- Household income
- $61,960
- Rent vs Own
- Severe rent burden
- 773.0
Population outlook (Anderson County) Hauer SSP2
- Today (2025)
- 210,546 people
- By 2030
- 217,791 · +3.4%
- By 2040
- 230,643 · +9.5%
- By 2050
- 240,220 · +14.1%
- By 2075
- 259,518 · +23.3%
- By 2100
- 258,696 · +22.9%
Race, ethnicity, and origin ACS 2023
- Neighborhood character
- Predominantly White (75%)
- Race & ethnicity
- White 75% Black 15% Two or more races 6% Hispanic / Latino 4% Asian 1%
- Common ancestry
- Serbian 3% Slovak 2% Romanian 1%
- Foreign-born
- 4% · Canada, South Korea
- Languages at home
- 96% English-only · Spanish 2%
Political lean MEDSL · Anderson
- 2024 margin
- Solid R (+47.4) · D 25.7% · R 73.1% · Other 1.2%
- 2008→2024 swing
- -14.1pp toward R · 2008: -33.3pp · 2024: -47.4pp
- All cycles
- 2024: R+47.4 2020: R+42.0 2016: R+43.7 2012: R+36.4 2008: R+33.3
Not yet ingested
- Civics
- —
Market trends
- HPI YoY
- ▼ -186.36%
- Current HPI
- 307.3451
- Rent YoY
- ▲ 0.75%
- Metro
- Greenville-Anderson, SC
- State GDP YoY
- ▲ 4.51%
- F500 in state
- 2
Industry mix (Fortune 500 HQ in SC)
| Industry | F500 HQs | Revenue |
|---|---|---|
| Packaging | 1 | $7B |
|
||
Price history
+1700.0% since first listed6 events — show timeline
- 2026-05-16 Relisted — WUMLS
- 2026-05-06 Pending — WUMLS
- 2026-04-30 Listed $180,000 WUMLS
- 2025-12-12 Sold (Public Records) $45,000 Public Records
- 2008-08-13 Sold (Public Records) $10,000 Public Records
- 1997-10-10 Sold (Public Records) $10,000 Public Records
Property tax history
+3.6%/yrLatest (2025): $892 · +29.2% YoY. Source: county tax records.
Cash-flow waterfall
monthlySold comps — $/sqft
last 12 mo · ≤1 miLoading sold comps…