 🏗️ New Construction
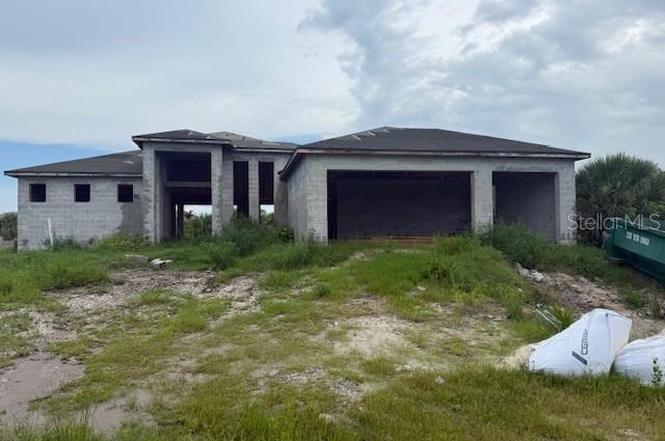
10510 Rainsville St · Rotonda, FL
Flood risk 8/10 · Major
- FEMA flood zone
- X (shaded)
- Chance of flooding over 30 yrs
- 0.98%
- Est. flood insurance / yr
- $507 – $1,088
Fire risk 1/10 · Minimal
- Est. fire insurance / yr
- $947 – $1,759
Heat risk 10/10 · Severe
- Hot days now (above 107°F)
- 7 days/yr
- Hot days in 30 yrs
- 28 days/yr
Wind risk 10/10 · Severe
- Chance of severe wind over 30 yrs
- 99.0%
Air-quality risk 2/10 · Minimal
- Unhealthy air days now
- 1 days/yr
- Unhealthy air days in 30 yrs
- 1 days/yr
Risk factors via First Street. Map © Google.
Why this score? — see what drove the C grade
The composite is a weighted blend of 9 inputs, each scored 0–100. Each bar is that input's sub-score; the figure is the points it added to the 100-point composite (weight × sub-score).
- Cash flow +22.7/30.0
- ARV discount +7.5/15.0
- DSCR +7.3/10.0
- 1% rule +5.2/10.0
- Schools +4.6/10.0
- Rent growth +3.8/5.0
- Livability +3.4/5.0
- Condition / age +2.5/5.0
- Appreciation +0.0/10.0
$299,900
🖨 Deal sheet (PDF) 📄 Offer letter ✓ Due diligence
Listing remarks MLS
Very popular and growing area of newer homes. Sailboat water, no fixed bridges. Waiting to be built on.
Key facts
- Direct gulf access
- Swimming pool
- Planned marinas
Tags
Property features AI
Finance
- Other: Lot cleared and paved; Lot about 0.23 acres; Asphalt/paved road access; Builder license: CGC1525166; Living area approx. 2,207 (builder), total building area approx. 3,210
- HOA & community: HOA available (optional) with annual fee of $125 (approximately $10.42/month); Association fee includes recreational facilities; Street lights in the community; Cats allowed
Exterior
- Parking: Attached garage with 3 spaces
- Utilities: Public water; Public sewer; Electricity available; Cable available; Broadband/High-speed internet available; Irrigation equipment
- Home design: Single-family residence; One story; New construction (projected completion Feb 2026); East-facing
- Construction: Block and stucco construction; Metal roof; Stem wall foundation; Built by Diamond Gulf Construction (model: Paradise 3); Under construction
- Exterior features: Outdoor kitchen; Sliding doors; Private heated in-ground pool and spa (gunite) with lighting, screen enclosure and self-cleaning; Seawall (concrete); Canal frontage with water access (brackish and saltwater), sailboat water, no fixed bridges
Interior
- Kitchen: Dishwasher; Microwave; Range; Refrigerator; Eat-in kitchen; Outdoor kitchen (exterior feature)
- Bedrooms: 4 bedrooms
- Flooring: Ceramic tile
- Bathrooms: 3 full baths; 1 half bath
- Heating & cooling: Central heating; Central air conditioning
- Interior features: Ceiling fans; Coffered and tray ceilings; Crown molding; High and vaulted ceilings; Open floor plan with kitchen/family room combo; Living room/dining room combo; Eat-in kitchen; Solid surface counters; Split bedroom layout; Walk-in closets; Insulated windows
- Laundry & utility: Laundry room inside with electric dryer hookup
Neighborhood map
What this means for you Summary
Snapshot
- This is a 4-bed/3.5-bath land listed at $300k.
Deal economics
- At list price, monthly cash flow is $451 ($5k/yr) — positive.
- The deal already cash-flows at list — no discount required.
- Meets the 1% rule at list price ($3k rent vs $300k).
- Recommended offer: $264k (12.0% below list) — sets the bar for market timing.
- Cap rate 8.4% vs local median 3.1% in Rotonda — top-decile yield for the area; either an underpriced asset or a hidden risk that comps aren't pricing in. Stress-test before assuming the spread holds.
Location & tenants
- Location reads 67/100 on livability (#548 in FL) — a middle-class / working-renter tenant base. Strengths: crime A+, housing A-, cost of living B+; Watch: schools D, amenities F, commute F.
- Charlotte (suburban): math 54% / reading 54% proficiency, ranked #22 of 73 in FL (top 30%) — acceptable for families but not a draw, mixed tenant base, ~2y average lease.
- Market conditions: Rents rising fast (+5.3%/yr); 2188 active listings in the ZIP; 15 comparable units currently listed for rent nearby; rentals at typical pace (median 22d on market — plan ~3-4 weeks tenant-placement turnaround); solid renter incomes; 4,585 units permitted in Charlotte County in 2024 (703 in 5+ unit buildings).
- This rent runs 43% of the median local income ($84k/yr) — at the standard rent-burdened threshold; future hikes will face affordability resistance.
Forward outlook
- Local home prices are declining (-3.0%/yr); year-one equity from $2k of loan paydown is wiped out by about $9k of value loss. Plan a longer hold.
- Charlotte County population projected at +24% by 2050 — long-run rental-demand tailwind backs the buy-and-hold thesis.
Negotiation context
- It's been on market 343 days — a 12% lower offer ($264k) is reasonable based on typical stale-listing flexibility.
- 4 sale attempts since 8y ago; this cycle's ask has dropped $160k (35%) from the opening price — seller is motivated, your offer sets the floor, not the list.
- Current owner paid $153k; list at $300k implies a 96% gain — meaningful room to come down on a strong offer.
Risks & watch-outs
- Watch-outs: flood insurance adds $66/mo.
- Climate carrying-cost: severe flood risk; severe wind risk, 99% chance of damaging wind over 30y; extreme-heat days projected 7→28/yr by 2055 (HVAC capex compounding) — expect insurance premiums to compound above CPI over the hold.
Questions for the listing agent
- It's been on market 343 days. Have you received any prior offers? Is the seller open to a 12% concession, seller financing, or rate buy-down credit?
- What's the actual annual flood-insurance premium (NFIP or private), and is the property in a SFHA with mandatory coverage?
- What does the HOA fee cover, when was the last increase, and are there any pending special assessments or reserve-fund shortfalls?
- Why hasn't it sold? Are there any deal-killer items the seller is aware of (foundation, flood, title, zoning, code violations)?
- Is there a deadline driving the sale (1031 exchange, divorce, estate, relocation)? That informs how much negotiation room exists.
- Schools are D-rated, which usually means shorter tenancies and higher turnover. Who's the typical renter profile here, and what's been the actual vacancy rate?
- This sits on a lake — are riparian / water-frontage rights deeded with the parcel? Any dock permits, shoreline easements, or HOA water-use restrictions?
- What's the documented flood / surge / shoreline-erosion history here (FEMA AND non-FEMA — e.g., storm surge, creek backup, septic-field saturation)?
- Any water-quality or seasonal algae-bloom issues that affect tenant satisfaction or short-term-rental demand?
- What's the average days-on-market for RENTAL listings here right now (not sales)? A rising rental-DOM trend means longer vacancies and softer asking-rent achievability than the comps imply.
- What's the recent tenant-quality profile in this submarket — average credit score on applications, eviction rate, late-payment / NSF rate, and stable-employment percentage? A property-management company in the area should have these aggregated.
- How much new for-sale + rental construction is in the pipeline within 1–3 miles? Heavy new supply typically softens prices + rents 12–24 months out; constrained supply supports both.
Investment metrics
- 1% rule
- 1.02% ✓
- Cap rate
- 8.36%
- Cash-on-cash
- 7.39%
- DSCR
- 1.33
- GRM
- 8.2
CMA / ARV
No comps found within radius.
Projected returns pro-forma
-3.0% appreciation · 5.29% rent growth · sell at horizon
- IRR
- -4.0%
- Equity multiple
- 0.85×
- Total profit
- $-12,732
- Equity at exit
- $44,716
- IRR
- 8.1%
- Equity multiple
- 1.67×
- Total profit
- $56,637
- Equity at exit
- $25,930
Cash invested: $83,972 (down + closing). Projections, not guarantees.
Landlord ↔ Tenant lean methodology
- Overall (STATE)
- 87 Strongly Landlord-Friendly
- State Florida
- 87 Strongly Landlord-Friendly · R+3
- County
- — inherits STATE
- City
- — inherits STATE
ZIP-level market 33981
- Home prices YoY
- -7.5%
- Rents YoY
- 5.3%
- Active inventory
- 2188
- Price-to-rent
- 8.2×
Monthly cashflow live
- Estimated rent
- $3,044 high interval (Pro) →
- Mortgage (P&I)
- −$1,573
- Tax from tax record
- −$180 /mo · $2,160/yr
- Insurance
- −$125
- Flood insurance flood zone
- −$66 /mo · $798/yr
- HOA
- −$10
- Vacancy / Maint / Mgmt
- −$639
- Net cashflow
- $451
Break-even live
Sensitivity live
| Price | -10% $621 | -5% $536 | +0% $451 | +5% $366 | +10% $281 |
|---|---|---|---|---|---|
| Rent | -10% $210 | -5% $331 | +0% $451 | +5% $571 | +10% $691 |
| Rate | -1.0pp $602 | -0.5pp $527 | base $451 | +0.5pp $373 | +1.0pp $294 |
UW: 25.0% down · 7.5% · 30yr · 1.5% tax · 5.0% vac · 8.0% maint · 8.0% mgmt
Financing live
Cash to close
- Down payment
- $74,975
- Closing costs
- $8,997
- Reserves months
- —
- Total cash needed
- —
Loan-product check · same deal, 3 products live
Conventional
25% down · 7.5% · 30yr
- Down + closing
- —
- Monthly P&I
- —
- Monthly cashflow
- —
- DSCR
- —
- Eligible?
- —
Personal DTI + credit; lowest rate.
DSCR
20% down · 8.5% · 30yr
- Down + closing
- —
- Monthly P&I
- —
- Monthly cashflow
- —
- DSCR
- —
- Eligible?
- —
No personal income docs; deal must DSCR.
Hard money
10% down · 12.0% · 12mo
- Down + closing
- —
- Monthly P&I
- —
- Monthly cashflow
- —
- DSCR
- —
- Eligible?
- —
Short-term bridge; refi at stabilization.
Rent comps 15 comps
| Address | Beds | Baths | Sqft | Rent | $/sqft | DOM | Units | Dist |
|---|---|---|---|---|---|---|---|---|
| 14142 Appleton Blvd Port Charlotte, FL | 4.0 | 2.0 | 1741 | $2,200 | $1.26 | 14d | 1 | 0.36mi |
| 14462 Fort Worth Cir Port Charlotte, FL | 4.0 | 2.5 | 2768 | $5,500 | $1.99 | 21d | 1 | 0.45mi |
| 15261 Brainbridge Cir Port Charlotte, FL | 4.0 | 2.5 | 1800 | $2,400 | $1.33 | 21d | 1 | 0.61mi |
| 10488 Van Wyck Ter Port Charlotte, FL | 3.0 | 2.0 | 1726 | $2,900 | $1.68 | 21d | 1 | 0.66mi |
| 10047 Greetings St Port Charlotte, FL | 4.0 | 2.0 | 2238 | $3,200 | $1.43 | 21d | 1 | 0.77mi |
| 10625 Ayear Rd Port Charlotte, FL | 4.0 | 2.0 | 2556 | $2,650 | $1.04 | 21d | 1 | 0.89mi |
| 10428 Port Everglades St Unit 10430 Port Charlotte, FL | 3.0 | 2.0 | 1429 | $1,697 | $1.19 | 21d | 1 | 0.91mi |
| 13305 Longville Ave Port Charlotte, FL | 3.0 | 2.0 | 1900 | $2,500 | $1.32 | 21d | 1 | 0.91mi |
| 15624 Hennipen Cir Port Charlotte, FL | 3.0 | 2.0 | 1922 | $4,000 | $2.08 | 21d | 1 | 1.17mi |
| 9458 Modesto Cir Port Charlotte, FL | 3.0 | 2.0 | 2153 | $2,750 | $1.28 | 21d | 1 | 1.28mi |
| 15419 Appleton Blvd Port Charlotte, FL | 3.0 | 2.0 | 1756 | $4,500 | $2.56 | 21d | 1 | 1.33mi |
| 9474 Melody Cir Port Charlotte, FL | 4.0 | 4.5 | 3000 | $10,500 | $3.50 | 21d | 1 | 1.36mi |
| 10070 Flat River St Port Charlotte, FL | 4.0 | 3.0 | 1904 | $2,400 | $1.26 | 21d | 1 | 1.37mi |
| 10125 Amicola St Unit 10127 Port Charlotte, FL | 3.0 | 2.0 | 1429 | $1,697 | $1.19 | 21d | 1 | 1.41mi |
| 9379 Snapper Cir Port Charlotte, FL | 4.0 | 2.0 | 2013 | $2,690 | $1.34 | 14d | 1 | 1.48mi |
HOA detail
- Monthly dues
- $10 · $120/yr
- Likely covers
- water
Listing history 40 events
-
2026-06-18days on market $299,900 Active 343 DOM
-
2026-06-17days on market $299,900 Active 342 DOM
-
2026-06-16days on market $299,900 Active 341 DOM
-
2026-06-15days on market $299,900 Active 340 DOM
-
2026-06-14days on market $299,900 Active 338 DOM
-
2026-06-13days on market $299,900 Active 337 DOM
-
2026-06-10days on market $299,900 Active 335 DOM
-
2026-06-09days on market $299,900 Active 334 DOM
-
2026-06-08days on market $299,900 Active 333 DOM
-
2026-06-05days on market $299,900 Active 329 DOM
-
2026-06-02days on market $299,900 Active 327 DOM
-
2026-06-01days on market $299,900 Active 326 DOM
-
2026-05-31days on market $299,900 Active 325 DOM
-
2026-05-30days on market $299,900 Active 324 DOM
-
2026-04-07price $299,900
-
2025-12-15price $310,000
-
2025-12-10price $349,000
-
2025-11-16price $374,000
-
2025-11-04price $375,000
-
2025-10-20price $395,000
-
2025-10-09price $410,000
-
2025-07-10$460,000 Active
-
2022-02-22soldstatus $153,000
-
2021-09-17status Pending
-
2021-09-17historical
-
2021-08-04soldstatus $84,000
-
2020-12-06price $550,000
-
2020-12-06status Active
-
2020-11-13historical
-
2020-10-14price $530,000
-
2020-05-20price $500,000
-
2020-04-27price $450,000
-
2020-01-20price $547,500
-
2019-08-15$542,500 Active
-
2018-10-30soldstatus $54,000
-
2018-10-28soldstatus $54,000 Sold 103-char remark
Show marketing remark (103 chars)
Very popular and growing area of newer homes. Sailboat water, no fixed bridges. Waiting to be built on.
-
2018-09-11status Pending 103-char remark
Show marketing remark (103 chars)
Very popular and growing area of newer homes. Sailboat water, no fixed bridges. Waiting to be built on.
-
2018-02-04$59,500 Active 103-char remark
Show marketing remark (103 chars)
Very popular and growing area of newer homes. Sailboat water, no fixed bridges. Waiting to be built on.
-
2005-11-18soldstatus $309,000
-
2005-06-06soldstatus $123,000
ⓘ Source: listings_history table (triggers on properties + properties_extension) + one-shot
backfill from property_details.listing_events for pre-trigger history.
Tax reassessment forecast FL · Resets to sale price
- Current annual tax
- $2,160 · $180/mo
- Projected year-2 tax
- $2,489 · $207/mo
- Expected delta
- +$329/yr (+$27/mo · 15.2%)
ⓘ Screening estimate from a state-policy table — verify with the county assessor before closing.
Climate risk First Street
- Flood 8/10 Severe FEMA zone X (shaded) · 98% chance over 30 yrs
- Wildfire 1/10 Low
- Heat 10/10 Extreme 7 d/yr ≥107°F today · 28 d/yr by 30 yrs out
- Wind 10/10 Extreme 99% chance of damaging wind over 30 yrs
- Air quality 2/10 Low 1 unhealthy d/yr today · 1 by 30 yrs out
Nearby sold comps map
Loading sold comps map…
Walkable amenities ~0.75 mi
Loading nearby amenities…
Taxation est. · year 1
- Rental income
- $36,532
- − Mortgage interest
- −$16,799
- − Property taxes
- −$2,160
- − Insurance
- −$2,297
- − Repairs & maintenance
- −$2,923
- − Management
- −$2,923
- − HOA
- −$120
- − Depreciation
- −$8,724
- Taxable income
- $586
- Est. tax owed @ 24.0%
- −$141
- After-tax cash flow
- $5,270/yr
For passive investors: Depreciation is non-cash, so a rental often shows a tax loss while cash-flowing — sheltering income. Rental losses are passive: they offset passive income freely, and up to $25,000/yr can offset ordinary (W-2) income if you actively participate and your MAGI is under $100k (phasing out to $0 by $150k); unused losses carry forward. On sale, claimed depreciation is recaptured at up to 25%, and gains may owe capital-gains tax (a 1031 exchange can defer both). Figures are a year-1 estimate at your 24.0% rate — not tax advice; consult a CPA.
Schools (NCES district)
- District
- Charlotte
- NCES district ID
- 1200240
- Math proficiency
- 54% ▼ -6.00%
- Reading proficiency
- 54% ▼ -1.00%
- Median HH income
- $44,864
- Composite
- 45.62/100
- National rank
- #2586
- State rank
- #22 of 73 in FL
Livability — Rotonda
- Score
- 67/100
- State rank
- #548
- US rank
- #10359
Category grades
Schools grade is shown separately in the Schools card above.
Census & demographics
- County
- Charlotte County · 196,994 people
- City population
- 10,490
- Metro
- Punta Gorda, FL
- Population (ZIP)
- 15,622
- Household income
- $84,098
- Rent vs Own
- Severe rent burden
- 105.0
Population outlook (Charlotte County) Hauer SSP2
- Today (2025)
- 198,646 people
- By 2030
- 210,507 · +6.0%
- By 2040
- 230,857 · +16.2%
- By 2050
- 247,148 · +24.4%
- By 2075
- 281,777 · +41.8%
- By 2100
- 293,609 · +47.8%
Race, ethnicity, and origin ACS 2023
- Neighborhood character
- Predominantly White (89%)
- Race & ethnicity
- White 89% Two or more races 4% Hispanic / Latino 4% Black 2% Asian 1%
- Common ancestry
- Romanian 4% Lithuanian 3% Italian 2%
- Foreign-born
- 6% · Canada
- Languages at home
- 96% English-only · Spanish 1% German/W. Germanic 1% Tagalog/Filipino 1%
Political lean MEDSL · Charlotte
- 2024 margin
- Solid R (+34.0) · D 32.7% · R 66.7%
- 2008→2024 swing
- -26.7pp toward R · 2008: -7.2pp · 2024: -34.0pp
- All cycles
- 2024: R+34.0 2020: R+26.6 2016: R+27.8 2012: R+14.3 2008: R+7.2
Not yet ingested
- Civics
- —
Market trends
- HPI YoY
- ▼ -28.09%
- Current HPI
- 346.5247
- Rent YoY
- ▲ 5.29%
- Metro
- Punta Gorda, FL
- State GDP YoY
- ▲ 3.28%
- F500 in state
- 36
Industry mix (Fortune 500 HQ in FL)
| Industry | F500 HQs | Revenue |
|---|---|---|
| Industrial Technology | 2 | $29B |
|
||
| Insurance | 2 | $17B |
|
||
| Retail | 1 | $60B |
|
||
| Technology Distribution | 1 | $58B |
|
||
| Homebuilding | 1 | $35B |
|
||
| Technology Manufacturing | 1 | $35B |
|
||
Price history
+143.8% since first listed26 events — show timeline
- 2026-04-07 Price Changed $299,900 Stellar MLS as Distributed by MLS Grid
- 2025-12-15 Price Changed $310,000 Stellar MLS as Distributed by MLS Grid
- 2025-12-10 Price Changed $349,000 Stellar MLS as Distributed by MLS Grid
- 2025-11-16 Price Changed $374,000 Stellar MLS as Distributed by MLS Grid
- 2025-11-04 Price Changed $375,000 Stellar MLS as Distributed by MLS Grid
- 2025-10-20 Price Changed $395,000 Stellar MLS as Distributed by MLS Grid
- 2025-10-09 Price Changed $410,000 Stellar MLS as Distributed by MLS Grid
- 2025-07-10 Listed $460,000 Stellar MLS as Distributed by MLS Grid
- 2022-02-22 Sold (Public Records) $153,000 Public Records
- 2021-09-17 Pending — Stellar MLS as Distributed by MLS Grid
- 2021-09-17 Listing Removed — Stellar MLS as Distributed by MLS Grid
- 2021-08-04 Sold (Public Records) $84,000 Public Records
- 2020-12-06 Price Changed $550,000 Stellar MLS as Distributed by MLS Grid
- 2020-12-06 Relisted — Stellar MLS as Distributed by MLS Grid
- 2020-11-13 Listing Removed — Stellar MLS as Distributed by MLS Grid
- 2020-10-14 Price Changed $530,000 Stellar MLS as Distributed by MLS Grid
- 2020-05-20 Price Changed $500,000 Stellar MLS as Distributed by MLS Grid
- 2020-04-27 Price Changed $450,000 Stellar MLS as Distributed by MLS Grid
- 2020-01-20 Price Changed $547,500 Stellar MLS as Distributed by MLS Grid
- 2019-08-15 Listed $542,500 Stellar MLS as Distributed by MLS Grid
- 2018-10-30 Sold (Public Records) $54,000 Public Records
- 2018-10-28 Sold (MLS) $54,000 Stellar MLS as Distributed by MLS Grid
- 2018-09-11 Pending — Stellar MLS as Distributed by MLS Grid
- 2018-02-04 Listed $59,500 Stellar MLS as Distributed by MLS Grid
- 2005-11-18 Sold (Public Records) $309,000 Public Records
- 2005-06-06 Sold (Public Records) $123,000 Public Records
Property tax history
+8.8%/yrLatest (2025): $2,160 · +21.4% YoY. Source: county tax records.
Cash-flow waterfall
monthlySold comps — $/sqft
last 12 mo · ≤1 miLoading sold comps…