 Triplex
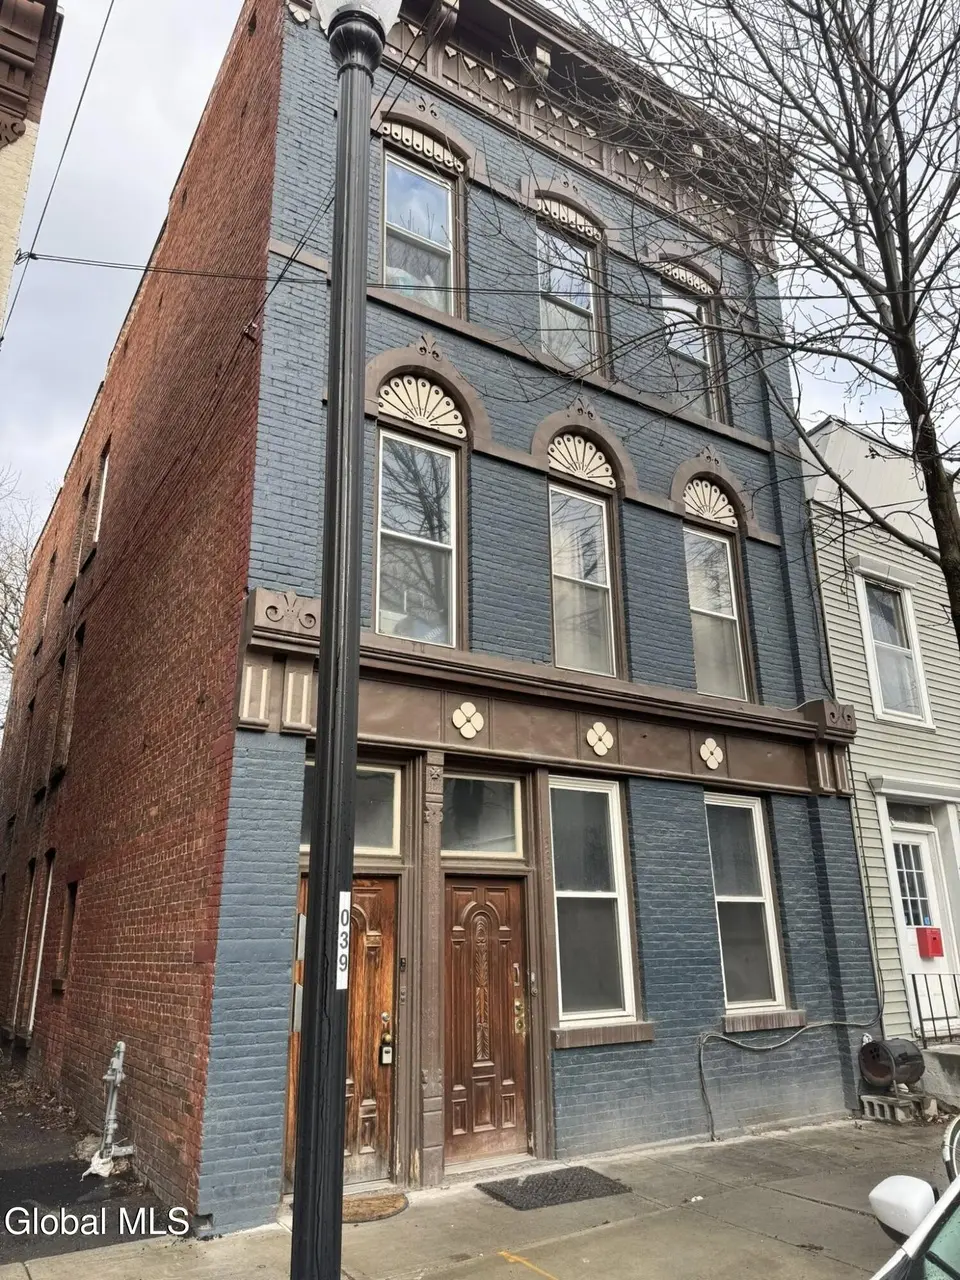
335 1st St · Troy, NY
Flood risk 9/10 · Severe
- FEMA flood zone
- AE
- Chance of flooding over 30 yrs
- 0.99%
- Est. flood insurance / yr
- $2,026 – $9,024
Fire risk 1/10 · Minimal
- Est. fire insurance / yr
- $691 – $1,283
Heat risk 4/10 · Minor
- Hot days now (above 96°F)
- 7 days/yr
- Hot days in 30 yrs
- 17 days/yr
Wind risk 3/10 · Minor
- Chance of severe wind over 30 yrs
- 6.0%
Air-quality risk 2/10 · Minimal
- Unhealthy air days now
- 0 days/yr
- Unhealthy air days in 30 yrs
- 1 days/yr
Risk factors via First Street. Map © Google.
Why this score? — see what drove the B+ grade
The composite is a weighted blend of 9 inputs, each scored 0–100. Each bar is that input's sub-score; the figure is the points it added to the 100-point composite (weight × sub-score).
- Cash flow +30.0/30.0
- ARV discount +15.0/15.0
- 1% rule +10.0/10.0
- DSCR +10.0/10.0
- Livability +4.0/5.0
- Schools +3.8/10.0
- Rent growth +3.7/5.0
- Condition / age +2.5/5.0
- Appreciation +0.0/10.0
$359,999
🖨 Deal sheet 📄 Offer letter ✓ Due diligence
Multi-family units
County records classify this as Multi-Family (2-4 Unit). Listing-text estimate: 3 units. confirmed
Listing remarks MLS
335 1st St in South Troy - $359,000 Brick 3 Family For Sale All separate utilities. Three bedrooms per flat Backyard, off street parking (rear of building) 1st Floor - Vacant (perfect for an owner occupied buyer) or rent it for $1400 2nd Floor - Rented - $850 3rd Floor - Rented - $1275
Key facts
- 3,049 sq ft lot
- 2 parking spots
- Built 1930
Neighborhood map
What this means for you Summary
Snapshot
- This is a 3 × 3-bed/1.0-bath units multifamily listed at $360k.
Deal economics
- At list price, monthly cash flow is $1k ($17k/yr) — positive. Per door: $485/mo.
- The deal already cash-flows at list — no discount required.
- Meets the 1% rule at list price ($6k rent vs $360k).
- Recommended offer: $338k (6.0% below list) — sets the bar for market timing.
- Cap rate 12.7% vs local median 5.3% in Troy — top-decile yield for the area; either an underpriced asset or a hidden risk that comps aren't pricing in. Stress-test before assuming the spread holds.
Location & tenants
- Location reads 81/100 on livability (#88 in NY, #1,350 nationally) — a professional / high-income tenant draw. Strengths: amenities A+, commute A+, housing A+; Watch: schools C-, employment C-, crime F.
- Troy City School District (urban): math 44% / reading 46% proficiency, ranked #467 of 590 in NY (top 79%) — families likely to look elsewhere, expect single-tenant / working-renter base with shorter leases; 62% free/reduced lunch — lower-income household profile, screen leases tightly.
- Market conditions: Rents rising fast (+4.9%/yr); 220 active listings in the ZIP; solid renter incomes; 405 units permitted in Rensselaer County in 2024 (224 in 5+ unit buildings).
- At $5,612/mo this rent would consume 89% of the median local household income ($76k/yr) (locally 2698% of renters already pay >50% of income on rent) — very limited rent-growth headroom before tenants either downsize or default.
Forward outlook
- Local home prices are declining (-3.0%/yr); year-one equity from $2k of loan paydown is wiped out by about $11k of value loss. Plan a longer hold.
- Rensselaer County population projected to shrink 6% by 2050 — rents likely to lag national; underwrite the cash flow, not the appreciation.
- At projected returns (-3.0% appreciation + 4.9% rent growth), your $101k cash investment doubles in ~7 years — after that, you're playing with house money.
Negotiation context
- It's been on market 72 days — a 6% lower offer ($338k) is reasonable based on typical stale-listing flexibility.
- 6 sale attempts since 24y ago with the ask held roughly flat each time — persistent listings suggest the price (not the market) is what's stuck; bring a comps-based counter.
- Current owner paid $240k; 50% above their basis — modest negotiation headroom, anchor on the comps not their cost.
Risks & watch-outs
- Watch-outs: flood insurance adds $460/mo; built in 1930 — expect roof / HVAC / electrical / plumbing capex.
- Climate carrying-cost: in FEMA flood zone AE (mandatory federal flood insurance) — expect insurance premiums to compound above CPI over the hold.
Questions for the listing agent
- It's been on market 72 days. Have you received any prior offers? Is the seller open to a 6% concession, seller financing, or rate buy-down credit?
- Can we see the unit-by-unit rent roll, current vacancy, and any below-market leases? What's the average tenancy length?
- What capital expenditures (roof, boiler, parking lot, exteriors) have been made in the last 5 years, and what's planned in the next 2?
- Built in 1930 — when were the roof, HVAC, electrical panel, plumbing, and water heater last replaced?
- What's the actual annual flood-insurance premium (NFIP or private), and is the property in a SFHA with mandatory coverage?
- Why hasn't it sold? Are there any deal-killer items the seller is aware of (foundation, flood, title, zoning, code violations)?
- Is there a deadline driving the sale (1031 exchange, divorce, estate, relocation)? That informs how much negotiation room exists.
- Crime grade is F in this area — have there been break-ins, vandalism, or insurance claims at this property in the last 3 years? What carrier currently insures it and at what premium?
- What's the average days-on-market for RENTAL listings here right now (not sales)? A rising rental-DOM trend means longer vacancies and softer asking-rent achievability than the comps imply.
- What's the recent tenant-quality profile in this submarket — average credit score on applications, eviction rate, late-payment / NSF rate, and stable-employment percentage? A property-management company in the area should have these aggregated.
- How much new apartment / multifamily construction is in the pipeline within 1–3 miles? Heavy new supply (>2% of stock underway) typically softens rents 12–24 months out; light construction supports rent growth.
Investment metrics
- 1% rule
- 1.56% ✓
- Cap rate
- 12.67%
- Cash-on-cash
- 22.79%
- DSCR
- 2.01
- GRM
- 5.3
CMA / ARV
- ARV (median comp)
- $490,446
- List price
- $359,999
- Delta
- -26.60%
- Verdict
- UNDERPRICED
- Comps
- 20 within 1.0 mi
Show comp detail 8 sales within ~0.75 mi
| Address | Dist | Beds/Ba | Sqft | Sold | Price | $/sf | Match |
|---|---|---|---|---|---|---|---|
| 429 1st St | 0.26mi | 7/2.0 (+1) | 3,576 (-0%) | 6mo | $285,000 | $80 | 71 |
| 231 2nd St | 0.36mi | 6/3.0 | 3,825 (+6%) | 9mo | $316,000 | $83 | 63 |
| 78 Hill St | 0.49mi | 7/4.0 (+1) | 3,474 (-3%) | 6mo | $449,000 | $129 | 60 |
| 12 Tyler St | 0.46mi | 7/3.0 (+1) | 3,333 (-7%) | 6mo | $310,000 | $93 | 55 |
| 229 2nd St | 0.36mi | 6/6.0 | 3,840 (+7%) | 15mo | $450,000 | $117 | 49 |
| 425 1st St | 0.25mi | 6/2.0 | 3,216 (-10%) | 23mo | $225,000 | $70 | 45 |
| 536 3rd Ave | 0.68mi | 5/4.0 (-1) | 3,214 (-10%) | 18mo | $315,000 | $98 | 29 |
| 181 4th St | 0.68mi | 6/4.0 | 3,100 (-14%) | 21mo | $535,000 | $173 | 26 |
Match score weights: distance 35% · size 25% · config 20% · recency 20%. Top-matched comps best support the ARV.
Projected returns pro-forma
-3.0% appreciation · 4.88% rent growth · sell at horizon
- IRR
- 11.1%
- Equity multiple
- 1.45×
- Total profit
- $45,442
- Equity at exit
- $53,677
- IRR
- 21.8%
- Equity multiple
- 3.05×
- Total profit
- $206,463
- Equity at exit
- $31,126
Cash invested: $100,800 (down + closing). Projections, not guarantees.
Landlord ↔ Tenant lean methodology
- Overall (STATE)
- 15 Strongly Tenant-Friendly
- State New York
- 15 Strongly Tenant-Friendly · D+10
- County
- — inherits STATE
- City
- — inherits STATE
ZIP-level market 12180
- Home prices YoY
- -33.3%
- Rents YoY
- 4.9%
- Active inventory
- 220
- Price-to-rent
- 16.0×
Monthly cashflow live
- Estimated rent
- $5,612 high interval (Pro) →
- Mortgage (P&I)
- −$1,888
- Tax from tax record
- −$482 /mo · $5,780/yr
- Insurance
- −$150
- Flood insurance flood zone
- −$460 /mo · $5,525/yr
- HOA
- −$0
- Vacancy / Maint / Mgmt
- −$1,179
- Net cashflow
- $1,454
Break-even live
3-unit breakdown (identical units grouped — click to expand)
| Units | Beds | Baths | Est. rent |
|---|---|---|---|
| 3× units | 3 | 1 | $5,613 |
| #1 | 3 | 1 | $1,871 |
| #2 | 3 | 1 | $1,871 |
| #3 | 3 | 1 | $1,871 |
| Total (3 units) | $5,612 | ||
UW: 25.0% down · 7.5% · 30yr · 1.5% tax · 5.0% vac · 8.0% maint · 8.0% mgmt
Financing live
Cash to close
- Down payment
- $90,000
- Closing costs
- $10,800
- Reserves months
- —
- Total cash needed
- —
Loan-product check · same deal, 3 products live
Conventional
25% down · 7.5% · 30yr
- Down + closing
- —
- Monthly P&I
- —
- Monthly cashflow
- —
- DSCR
- —
- Eligible?
- —
Personal DTI + credit; lowest rate.
DSCR
20% down · 8.5% · 30yr
- Down + closing
- —
- Monthly P&I
- —
- Monthly cashflow
- —
- DSCR
- —
- Eligible?
- —
No personal income docs; deal must DSCR.
Hard money
10% down · 12.0% · 12mo
- Down + closing
- —
- Monthly P&I
- —
- Monthly cashflow
- —
- DSCR
- —
- Eligible?
- —
Short-term bridge; refi at stabilization.
Listing history 39 events
-
2026-06-18days on market $359,999 Active 72 DOM
-
2026-06-17days on market $359,999 Active 71 DOM
-
2026-06-16days on market $359,999 Active 70 DOM
-
2026-06-15days on market $359,999 Active 69 DOM
-
2026-06-14days on market $359,999 Active 67 DOM
-
2026-06-13days on market $359,999 Active 66 DOM
-
2026-06-10days on market $359,999 Active 64 DOM
-
2026-06-09days on market $359,999 Active 63 DOM
-
2026-06-08days on market $359,999 Active 62 DOM
-
2026-06-07days on market $359,999 Active 61 DOM
-
2026-06-03days on market $359,999 Active 57 DOM
-
2026-06-02days on market $359,999 Active 56 DOM
-
2026-06-01days on market $359,999 Active 55 DOM
-
2026-05-31days on market $359,999 Active 54 DOM
-
2026-05-31days on market $359,999 Active 53 DOM
-
2026-04-07$359,999 Active 299-char remark
Show marketing remark (299 chars)
335 1st St in South Troy - $359,000 Brick 3 Family For Sale All separate utilities. Three bedrooms per flat Backyard, off street parking (rear of building) 1st Floor - Vacant (perfect for an owner occupied buyer) or rent it for $1400 2nd Floor - Rented - $850 3rd Floor - Rented - $1275
-
2022-07-28price $1,395
-
2022-03-10soldstatus $240,000
-
2021-12-14status Pending 422-char remark
Show marketing remark (422 chars)
This multifamily home could be a great investment opportunity. Close to downtown Troy, schools, attractions and adjacent to the (2 Family home 337 1st St, also for sale). Featuring a large newly fenced in back yard with parking, an additional access road. The first-floor unit is newly updated with laundry and a breakfast-nook, and the upper two floors have similar potential, and are well maintained. Very Good Condition
-
2021-12-07status Pend (Under Cntr) 422-char remark
Show marketing remark (422 chars)
This multifamily home could be a great investment opportunity. Close to downtown Troy, schools, attractions and adjacent to the (2 Family home 337 1st St, also for sale). Featuring a large newly fenced in back yard with parking, an additional access road. The first-floor unit is newly updated with laundry and a breakfast-nook, and the upper two floors have similar potential, and are well maintained. Very Good Condition
-
2021-11-24price $255,000 422-char remark
Show marketing remark (422 chars)
This multifamily home could be a great investment opportunity. Close to downtown Troy, schools, attractions and adjacent to the (2 Family home 337 1st St, also for sale). Featuring a large newly fenced in back yard with parking, an additional access road. The first-floor unit is newly updated with laundry and a breakfast-nook, and the upper two floors have similar potential, and are well maintained. Very Good Condition
-
2021-10-21price $265,000 422-char remark
Show marketing remark (422 chars)
This multifamily home could be a great investment opportunity. Close to downtown Troy, schools, attractions and adjacent to the (2 Family home 337 1st St, also for sale). Featuring a large newly fenced in back yard with parking, an additional access road. The first-floor unit is newly updated with laundry and a breakfast-nook, and the upper two floors have similar potential, and are well maintained. Very Good Condition
-
2021-10-07$275,000 New 422-char remark
Show marketing remark (422 chars)
This multifamily home could be a great investment opportunity. Close to downtown Troy, schools, attractions and adjacent to the (2 Family home 337 1st St, also for sale). Featuring a large newly fenced in back yard with parking, an additional access road. The first-floor unit is newly updated with laundry and a breakfast-nook, and the upper two floors have similar potential, and are well maintained. Very Good Condition
-
2020-09-16soldstatus $215,000
-
2020-09-09status Pend (Under Cntr)
-
2020-09-08price $225,000
-
2020-09-08price $215,000
-
2020-09-07status Price Change
-
2020-09-03soldstatus $215,000 Closed (Final Sale)
-
2020-07-01status Pend (Under Cntr)
-
2020-06-23$225,000 New
-
2007-03-26soldstatus $107,916
-
2007-03-14soldstatus $108,000
-
2007-02-01historical
-
2007-01-03$114,900
-
2003-01-08soldstatus $50,000
-
2002-12-31soldstatus $50,000
-
2002-10-28historical
-
2002-10-18$49,000
ⓘ Source: listings_history table (triggers on properties + properties_extension) + one-shot
backfill from property_details.listing_events for pre-trigger history.
Tax reassessment forecast NY · Partial reset (capped growth)
- Current annual tax
- $5,780 · $482/mo
- Projected year-2 tax
- $5,932 · $494/mo
- Expected delta
- +$152/yr (+$13/mo · 2.6%)
ⓘ Screening estimate from a state-policy table — verify with the county assessor before closing.
Climate risk First Street
- Flood 9/10 Extreme FEMA zone AE · 99% chance over 30 yrs
- Wildfire 1/10 Low
- Heat 4/10 Moderate 7 d/yr ≥96°F today · 17 d/yr by 30 yrs out
- Wind 3/10 Moderate 6% chance of damaging wind over 30 yrs
- Air quality 2/10 Low 0 unhealthy d/yr today · 1 by 30 yrs out
Nearby sold comps map
Loading sold comps map…
Walkable amenities ~0.75 mi
Loading nearby amenities…
Taxation est. · year 1
- Rental income
- $67,344
- − Mortgage interest
- −$20,166
- − Property taxes
- −$5,780
- − Insurance
- −$7,325
- − Repairs & maintenance
- −$5,388
- − Management
- −$5,388
- − Depreciation
- −$10,473
- Taxable income
- $12,826
- Est. tax owed @ 24.0%
- −$3,078
- After-tax cash flow
- $14,364/yr
For passive investors: Depreciation is non-cash, so a rental often shows a tax loss while cash-flowing — sheltering income. Rental losses are passive: they offset passive income freely, and up to $25,000/yr can offset ordinary (W-2) income if you actively participate and your MAGI is under $100k (phasing out to $0 by $150k); unused losses carry forward. On sale, claimed depreciation is recaptured at up to 25%, and gains may owe capital-gains tax (a 1031 exchange can defer both). Figures are a year-1 estimate at your 24.0% rate — not tax advice; consult a CPA.
Schools (NCES district)
- District
- Troy City School District
- NCES district ID
- 3628950
- Math proficiency
- 44% ▲ 6.00%
- Reading proficiency
- 46% ▲ 6.00%
- Median HH income
- $42,143
- Composite
- 37.89/100
- National rank
- #4318
- State rank
- #467 of 590 in NY
Livability — Troy
- Score
- 81/100
- State rank
- #88
- US rank
- #1350
Category grades
Schools grade is shown separately in the Schools card above.
Census & demographics
- Census place
- Troy, NY
- County
- Rensselaer County · 75,590 people
- City population
- 53,479
- Metro
- Albany-Schenectady-Troy, NY
- Population (ZIP)
- 53,479
- Household income
- $75,851
- Rent vs Own
- Severe rent burden
- 2698.0
Population outlook (Rensselaer County) Hauer SSP2
- Today (2025)
- 162,400 people
- By 2030
- 161,746 · -0.4%
- By 2040
- 158,095 · -2.7%
- By 2050
- 152,966 · -5.8%
- By 2075
- 140,767 · -13.3%
- By 2100
- 124,727 · -23.2%
Race, ethnicity, and origin ACS 2023
- Neighborhood character
- Predominantly White (70%)
- Race & ethnicity
- White 70% Black 12% Hispanic / Latino 8% Two or more races 8% Asian 5%
- Hispanic origin (detail)
- Mexican 1% Puerto Rican 4%
- Common ancestry
- Romanian 5% Lithuanian 5% Slovak 1%
- Foreign-born
- 10% · Canada, China
- Languages at home
- 88% English-only · Spanish 4% Other Indo-European 2% Arabic 2%
Political lean MEDSL · Rensselaer
- 2024 margin
- Toss-up / Even · D 50.7% · R 49.3%
- 2008→2024 swing
- -8.0pp toward R · 2008: 9.3pp · 2024: 1.4pp
- All cycles
- 2024: D+1.4 2020: D+5.6 2016: R+2.9 2012: D+11.8 2008: D+9.3
Not yet ingested
- Civics
- —
Market trends
- HPI YoY
- ▼ -142.53%
- Current HPI
- 285.0762
- Rent YoY
- ▲ 4.88%
- Metro
- Albany-Schenectady-Troy, NY
- State GDP YoY
- ▲ 2.60%
- F500 in state
- 92
Industry mix (Fortune 500 HQ in NY)
| Industry | F500 HQs | Revenue |
|---|---|---|
| Financial Services | 10 | $950B |
|
||
| Consumer Goods | 9 | $162B |
|
||
| Insurance | 4 | $225B |
|
||
| Telecommunications | 2 | $144B |
|
||
| Pharmaceuticals | 2 | $112B |
|
||
| Media / Entertainment | 2 | $69B |
|
||
Price history
+634.7% since first listed24 events — show timeline
- 2026-04-07 Listed $359,999 Global MLS
- 2022-07-28 Price Changed $1,395 RENT.
- 2022-03-10 Sold (Public Records) $240,000 Public Records
- 2021-12-14 Pending — Global MLS
- 2021-12-07 Pending — Global MLS
- 2021-11-24 Price Changed $255,000 Global MLS
- 2021-10-21 Price Changed $265,000 Global MLS
- 2021-10-07 Listed $275,000 Global MLS
- 2020-09-16 Sold (Public Records) $215,000 Public Records
- 2020-09-09 Pending — Global MLS
- 2020-09-08 Price Changed $225,000 Global MLS
- 2020-09-08 Price Changed $215,000 Global MLS
- 2020-09-07 Relisted — Global MLS
- 2020-09-03 Sold (MLS) $215,000 Global MLS
- 2020-07-01 Pending — Global MLS
- 2020-06-23 Listed $225,000 Global MLS
- 2007-03-26 Sold (Public Records) $107,916 Public Records
- 2007-03-14 Sold (MLS) $108,000 Global MLS
- 2007-02-01 Listing Removed — Global MLS
- 2007-01-03 Listed $114,900 Global MLS
- 2003-01-08 Sold (Public Records) $50,000 Public Records
- 2002-12-31 Sold (MLS) $50,000 Global MLS
- 2002-10-28 Listing Removed — Global MLS
- 2002-10-18 Listed $49,000 Global MLS
Property tax history
+16.3%/yrLatest (2025): $5,780 · +2.3% YoY. Source: county tax records.
Cash-flow waterfall
monthlySold comps — $/sqft
last 12 mo · ≤1 miLoading sold comps…