7601 Daffan Lane #246 Plan · Austin, TX
Flood risk 1/10 · Minimal
- FEMA flood zone
- X (unshaded)
- Chance of flooding over 30 yrs
- 0.0%
- Est. flood insurance / yr
- $507 – $1,088
Fire risk 4/10 · Minor
- Est. fire insurance / yr
- $1,222 – $2,270
Heat risk 8/10 · Major
- Hot days now (above 108°F)
- 7 days/yr
- Hot days in 30 yrs
- 23 days/yr
Wind risk 8/10 · Major
- Chance of severe wind over 30 yrs
- 80.0%
Air-quality risk 2/10 · Minimal
- Unhealthy air days now
- 0 days/yr
- Unhealthy air days in 30 yrs
- 1 days/yr
Risk factors via First Street. Map © Google.
Why this score? — see what drove the B grade
The composite is a weighted blend of 9 inputs, each scored 0–100. Each bar is that input's sub-score; the figure is the points it added to the 100-point composite (weight × sub-score).
- Cash flow +30.0/30.0
- 1% rule +10.0/10.0
- DSCR +10.0/10.0
- ARV discount +7.5/15.0
- Livability +4.1/5.0
- Condition / age +4.0/5.0
- Rent growth +2.6/5.0
- Schools +2.0/10.0
- Appreciation +0.0/10.0
$99,995
🖨 Deal sheet 📄 Offer letter ✓ Due diligence
Listing remarks
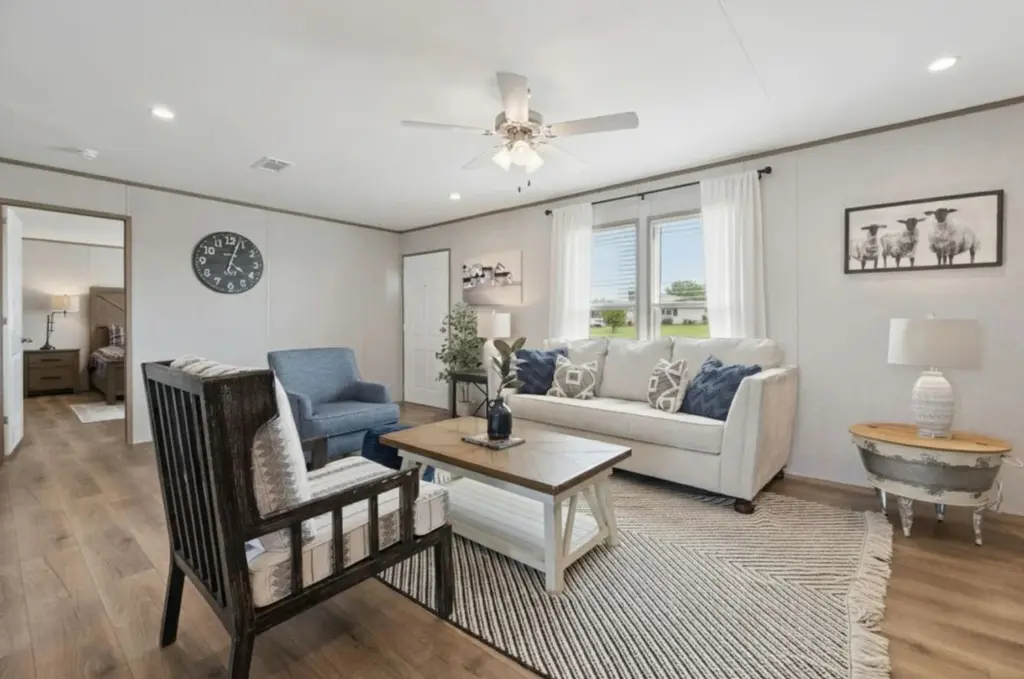
Welcome to this beautiful new 3 bedroom, 2 bath home featuring a bright open floor plan perfect for modern living. The spacious kitchen includes a large island, ideal for cooking, entertaining, and gathering. The primary suite offers comfort and convenience with a dual vanity, generous storage, and a well designed layout. This home blends style, functionality, and fresh contemporary finishes throughout move in ready and designed to impress.
Key facts
- Listed 5 days
Property features AI
Finance
- Financial info: Listing price $99,995
Exterior
- Home design: Condominium/attached plan (7601 Daffan Lane #246)
- Exterior features: Living area about 1,456
Interior
- Bedrooms: 3 bedrooms
- Bathrooms: 2 bathrooms
- Interior features: Plan-style new construction
Neighborhood map
What this means for you Summary
Snapshot
- This is a 3-bed/2.0-bath manufactured listed at $100k. Condition is rated good.
Deal economics
- At list price, monthly cash flow is $640 ($8k/yr) — positive.
- The deal already cash-flows at list — no discount required.
- Meets the 1% rule at list price ($2k rent vs $100k).
- Cap rate 14.0% vs local median 1.8% in Austin — top-decile yield for the area; either an underpriced asset or a hidden risk that comps aren't pricing in. Stress-test before assuming the spread holds.
Location & tenants
- Location reads 82/100 on livability (#16 in TX, #1,208 nationally) — a professional / high-income tenant draw. Strengths: amenities A+, commute A+, employment A+; Watch: cost of living D, crime F.
- Manor ISD (rural): math 18% / reading 26% proficiency, ranked #729 of 826 in TX (top 88%) — low school quality limits family demand, transient renter base, plan for 1-2y turnover; 71% free/reduced lunch — lower-income household profile, screen leases tightly.
- Market conditions: Rents flat; 176 active listings in the ZIP; 22 comparable units currently listed for rent nearby; rentals at typical pace (median 15d on market — plan ~3-4 weeks tenant-placement turnaround); solid renter incomes; 17,121 units permitted in Travis County in 2024 (11,963 in 5+ unit buildings).
Forward outlook
- Local home prices are declining (-3.0%/yr); year-one equity from $691 of loan paydown is wiped out by about $3k of value loss. Plan a longer hold.
- Travis County population projected at +60% by 2050 — long-run rental-demand tailwind backs the buy-and-hold thesis.
- At projected returns (-3.0% appreciation + 0.3% rent growth), your $28k cash investment doubles in ~5 years — after that, you're playing with house money.
Negotiation context
- Only 5 days on market — expect competitive offers; lowballing is unlikely to land.
Risks & watch-outs
- Climate carrying-cost: severe wind risk, 80% chance of damaging wind over 30y; extreme-heat days projected 7→23/yr by 2055 (HVAC capex compounding) — expect insurance premiums to compound above CPI over the hold.
Questions for the listing agent
- Is there a deadline driving the sale (1031 exchange, divorce, estate, relocation)? That informs how much negotiation room exists.
- Crime grade is F in this area — have there been break-ins, vandalism, or insurance claims at this property in the last 3 years? What carrier currently insures it and at what premium?
- What's the average days-on-market for RENTAL listings here right now (not sales)? A rising rental-DOM trend means longer vacancies and softer asking-rent achievability than the comps imply.
- What's the recent tenant-quality profile in this submarket — average credit score on applications, eviction rate, late-payment / NSF rate, and stable-employment percentage? A property-management company in the area should have these aggregated.
- How much new for-sale + rental construction is in the pipeline within 1–3 miles? Heavy new supply typically softens prices + rents 12–24 months out; constrained supply supports both.
Investment metrics
- 1% rule
- 1.68% ✓
- Cap rate
- 13.97%
- Cash-on-cash
- 27.41%
- DSCR
- 2.22
- GRM
- 4.9
CMA / ARV
No comps found within radius.
Projected returns pro-forma
-3.0% appreciation · 0.26% rent growth · sell at horizon
- IRR
- 18.3%
- Equity multiple
- 1.72×
- Total profit
- $20,037
- Equity at exit
- $14,910
- IRR
- 24.7%
- Equity multiple
- 2.87×
- Total profit
- $52,446
- Equity at exit
- $8,646
Cash invested: $27,999 (down + closing). Projections, not guarantees.
Landlord ↔ Tenant lean methodology
- Overall (STATE)
- 87 Strongly Landlord-Friendly
- State Texas
- 87 Strongly Landlord-Friendly · R+5
- County
- — inherits STATE
- City
- — inherits STATE
ZIP-level market 78724
- Home prices YoY
- -13.1%
- Rents YoY
- 0.3%
- Active inventory
- 176
- Price-to-rent
- 4.9×
Monthly cashflow live
- Estimated rent
- $1,684 high interval (Pro) →
- Mortgage (P&I)
- −$524
- Tax est. 1.5%
- −$125 /mo · $1,500/yr
- Insurance
- −$42
- HOA
- −$0
- Vacancy / Maint / Mgmt
- −$354
- Net cashflow
- $640
Break-even live
UW: 25.0% down · 7.5% · 30yr · 1.5% tax · 5.0% vac · 8.0% maint · 8.0% mgmt
Financing live
Cash to close
- Down payment
- $24,999
- Closing costs
- $3,000
- Reserves months
- —
- Total cash needed
- —
Loan-product check · same deal, 3 products live
Conventional
25% down · 7.5% · 30yr
- Down + closing
- —
- Monthly P&I
- —
- Monthly cashflow
- —
- DSCR
- —
- Eligible?
- —
Personal DTI + credit; lowest rate.
DSCR
20% down · 8.5% · 30yr
- Down + closing
- —
- Monthly P&I
- —
- Monthly cashflow
- —
- DSCR
- —
- Eligible?
- —
No personal income docs; deal must DSCR.
Hard money
10% down · 12.0% · 12mo
- Down + closing
- —
- Monthly P&I
- —
- Monthly cashflow
- —
- DSCR
- —
- Eligible?
- —
Short-term bridge; refi at stabilization.
Rent comps 22 comps
| Address | Beds | Baths | Sqft | Rent | $/sqft | DOM | Units | Dist |
|---|---|---|---|---|---|---|---|---|
| 7506 Walnut Creek Hike and Bike Trl Austin, TX | 3.0 | 2.0 | 1456 | $1,249 | $0.86 | 43d | 1 | 0.05mi |
| 7400 Daffan Ln Unit 7433 Austin, TX | 3.0 | 2.0 | 1300 | $1,681 | $1.29 | 3d | 1 | 0.14mi |
| 7400 Daffan Ln Unit 7457 Austin, TX | 2.0 | 2.0 | 1050 | $1,381 | $1.32 | 3d | 1 | 0.14mi |
| 7601 Daffan Ln Austin, TX | 3.0–4.0 | 2.0 | 1400 | $1,449 | $1.03 | 4d | 1 | 0.24mi |
| 7601 Daffan Ln Unit 711 Austin, TX | 3.0 | 2.0 | 1568 | $1,763 | $1.12 | 17d | 1 | 0.37mi |
| 9000 Decker Ln Austin, TX | 2.0–4.0 | 2.0 | 1180 | $1,349 | $1.14 | 1d | 1 | 0.49mi |
| 8000 Decker Ln Unit 8033 Austin, TX | 3.0 | 2.0 | 1227 | $1,763 | $1.44 | 3d | 1 | 0.60mi |
| 8000 Decker Ln Unit 8057 Austin, TX | 2.0 | 2.0 | 1087 | $1,530 | $1.41 | 3d | 1 | 0.60mi |
| 7512 Daves Landing Dr Austin, TX | 3.0 | 2.0 | 1366 | $2,200 | $1.61 | 23d | 1 | 0.78mi |
| 8025 City Top Blvd Austin, TX | 3.0 | 2.0 | 1472 | $2,300 | $1.56 | 23d | 1 | 0.84mi |
| 7717 Lowenfield Dr Austin, TX | 3.0 | 2.0 | 1516 | $2,270 | $1.50 | 23d | 1 | 0.86mi |
| 8340 Mimi Ln Austin, TX | 3.0 | 2.5 | 1811 | $2,700 | $1.49 | 4d | 1 | 0.96mi |
| 8721 Eastern Heights Blvd Unit 8778 Austin, TX | 2.0 | 2.0 | 1025 | $1,481 | $1.44 | 3d | 1 | 1.05mi |
| 8721 Eastern Heights Blvd Austin, TX | 2.0 | 2.0 | 1028 | $1,299 | $1.26 | 43d | 1 | 1.06mi |
| 8707 Karling Dr Austin, TX | 3.0 | 2.0 | 1296 | $1,058 | $0.82 | 43d | 1 | 1.13mi |
| 8712 Old Manor Rd Austin, TX | 1.0–4.0 | 1.0–2.0 | 1073 | $1,449 | $1.35 | 23d | 1 | 1.16mi |
| 7320 Muffin Dr Austin, TX | 3.0 | 2.0 | 1499 | $2,045 | $1.36 | 14d | 1 | 1.25mi |
| 6809 Jaired Dr Austin, TX | 3.0 | 2.0 | 1162 | $1,900 | $1.64 | 43d | 1 | 1.29mi |
| 7120 Carwill Dr Austin, TX | 3.0 | 2.0 | 1500 | $2,000 | $1.33 | 14d | 1 | 1.36mi |
| 7000 Decker Ln Austin, TX | 1.0–4.0 | 1.0–2.0 | 955 | $1,626 | $1.70 | 3d | 19 | 1.40mi |
| 7106 Colony Park Dr Austin, TX | 3.0 | 2.0 | 1039 | $2,150 | $2.07 | 4d | 1 | 1.40mi |
| 7009 Zachary Dr Austin, TX | 3.0 | 2.0 | 1827 | $2,900 | $1.59 | 17d | 1 | 1.50mi |
Listing history 6 events
-
2026-06-18days on market $99,995 Active 5 DOM
-
2026-06-17days on market $99,995 Active 4 DOM
-
2026-06-16days on market $99,995 Active 3 DOM
-
2026-06-15days on market $99,995 Active 2 DOM
-
2026-06-13remarks 444-char remark
-
2026-06-13$99,995 Active 1 DOM
ⓘ Source: listings_history table (triggers on properties + properties_extension) + one-shot
backfill from property_details.listing_events for pre-trigger history.
Climate risk First Street
- Flood 1/10 Low FEMA zone X (unshaded) · 0% chance over 30 yrs
- Wildfire 4/10 Moderate
- Heat 8/10 Severe 7 d/yr ≥108°F today · 23 d/yr by 30 yrs out
- Wind 8/10 Severe 80% chance of damaging wind over 30 yrs
- Air quality 2/10 Low 0 unhealthy d/yr today · 1 by 30 yrs out
Nearby sold comps map
Loading sold comps map…
Walkable amenities ~0.75 mi
Loading nearby amenities…
Taxation est. · year 1
- Rental income
- $20,212
- − Mortgage interest
- −$5,601
- − Property taxes
- −$1,500
- − Insurance
- −$500
- − Repairs & maintenance
- −$1,617
- − Management
- −$1,617
- − Depreciation
- −$2,909
- Taxable income
- $6,468
- Est. tax owed @ 24.0%
- −$1,552
- After-tax cash flow
- $6,123/yr
For passive investors: Depreciation is non-cash, so a rental often shows a tax loss while cash-flowing — sheltering income. Rental losses are passive: they offset passive income freely, and up to $25,000/yr can offset ordinary (W-2) income if you actively participate and your MAGI is under $100k (phasing out to $0 by $150k); unused losses carry forward. On sale, claimed depreciation is recaptured at up to 25%, and gains may owe capital-gains tax (a 1031 exchange can defer both). Figures are a year-1 estimate at your 24.0% rate — not tax advice; consult a CPA.
Condition & rehab AI · 11 photos
This move-in ready home features a bright open floor plan with modern finishes and a spacious kitchen. It is in good condition with minimal repairs needed, making it an attractive option for both buyers and renters.
Value-add opportunities
- Both Painting the exterior and interior walls — Fresh paint can enhance curb appeal and interior aesthetics.
- Both Updating the flooring — New flooring can improve the overall look and feel of the home.
- Both Upgrading the kitchen appliances — Modern appliances can make the kitchen more functional and appealing to potential buyers/renters.
Renovation cost estimate screening
Value-add ROI direction
- Both Painting the exterior and interior walls — Fresh paint can enhance curb appeal and interior aesthetics. ↑
- Both Updating the flooring — New flooring can improve the overall look and feel of the home. ↑
- Both Upgrading the kitchen appliances — Modern appliances can make the kitchen more functional and appealing to potential buyers/renters. ↑
ⓘ Cost ranges are severity-bucket heuristics (US national rule-of-thumb). Get contractor quotes + a written scope before underwriting a rehab budget.
Schools (NCES district)
- District
- Manor ISD
- NCES district ID
- 4828890
- Math proficiency
- 18% ▼ -19.00%
- Reading proficiency
- 26% ▼ -10.00%
- Median HH income
- $56,255
- Composite
- 20.14/100
- National rank
- #8641
- State rank
- #729 of 826 in TX
Livability — Austin
- Score
- 82/100
- State rank
- #16
- US rank
- #1208
Category grades
Schools grade is shown separately in the Schools card above.
Census & demographics
- County
- Travis County · 1,299,254 people
- City population
- 1,066,854
- Metro
- Austin-Round Rock-Georgetown, TX
- Population (ZIP)
- 31,103
- Household income
- $77,926
- Rent vs Own
- Severe rent burden
- 873.0
Population outlook (Travis County) Hauer SSP2
- Today (2025)
- 1,545,133 people
- By 2030
- 1,729,269 · +11.9%
- By 2040
- 2,097,596 · +35.8%
- By 2050
- 2,463,890 · +59.5%
- By 2075
- 3,249,374 · +110.3%
- By 2100
- 3,801,868 · +146.1%
Race, ethnicity, and origin ACS 2023
- Neighborhood character
- Diverse neighborhood (Simpson 0.56)
- Race & ethnicity
- Hispanic / Latino 63% Two or more races 30% Black 15% White 15% Asian 3%
- Hispanic origin (detail)
- Mexican 54% Puerto Rican 2% Cuban 1%
- Common ancestry
- Slovak 2% Lithuanian 1%
- Foreign-born
- 23% · Canada, Jamaica, China
- Languages at home
- 48% English-only · Spanish 48% Other Asian/Pacific 1% Other Indo-European 1%
Political lean MEDSL · Travis
- 2024 margin
- Solid D (+39.3) · D 68.8% · R 29.4% · Other 1.8%
- 2008→2024 swing
- +9.9pp toward D · 2008: 29.4pp · 2024: 39.3pp
- All cycles
- 2024: D+39.3 2020: D+45.0 2016: D+38.9 2012: D+23.9 2008: D+29.4
Not yet ingested
- Civics
- —
Market trends
- HPI YoY
- ▼ -42.92%
- Current HPI
- 284.1007
- Rent YoY
- ▲ 0.26%
- Metro
- Austin-Round Rock-Georgetown, TX
- State GDP YoY
- ▲ 3.95%
- F500 in state
- 110
Industry mix (Fortune 500 HQ in TX)
| Industry | F500 HQs | Revenue |
|---|---|---|
| Energy | 16 | $1,198B |
|
||
| Technology | 5 | $198B |
|
||
| Engineering / Construction | 4 | $72B |
|
||
| Energy Services | 3 | $60B |
|
||
| Utilities | 3 | $41B |
|
||
| Healthcare | 2 | $330B |
|
||
Cash-flow waterfall
monthlySold comps — $/sqft
last 12 mo · ≤1 miLoading sold comps…