560 Morgan Branch Rd · Mars Hill, NC
Flood risk 1/10 · Minimal
- FEMA flood zone
- X (unshaded)
- Chance of flooding over 30 yrs
- 0.0%
- Est. flood insurance / yr
- $507 – $1,088
Fire risk 9/10 · Severe
- Est. fire insurance / yr
- $906 – $1,684
Heat risk 4/10 · Minor
- Hot days now (above 99°F)
- 8 days/yr
- Hot days in 30 yrs
- 23 days/yr
Wind risk 2/10 · Minimal
- Chance of severe wind over 30 yrs
- —
Air-quality risk 2/10 · Minimal
- Unhealthy air days now
- 1 days/yr
- Unhealthy air days in 30 yrs
- 1 days/yr
Risk factors via First Street. Map © Google.
Why this score? — see what drove the C- grade
The composite is a weighted blend of 9 inputs, each scored 0–100. Each bar is that input's sub-score; the figure is the points it added to the 100-point composite (weight × sub-score).
- Cash flow +13.9/30.0
- Appreciation +10.0/10.0
- ARV discount +7.5/15.0
- Schools +4.5/10.0
- DSCR +4.2/10.0
- Livability +3.8/5.0
- 1% rule +2.6/10.0
- Rent growth +2.5/5.0
- Condition / age +2.5/5.0
$254,900
🖨 Deal sheet (PDF) 📄 Offer letter ✓ Due diligence
Listing remarks
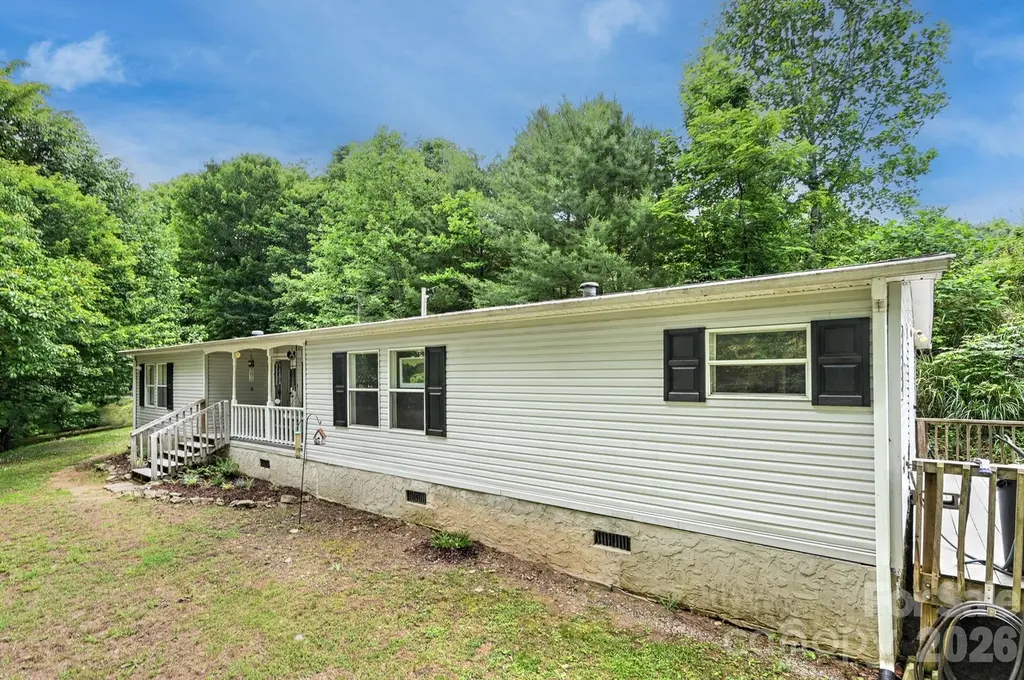
Discover the perfect blend of privacy, functionality, and country charm with this beautifully maintained 3 bedroom, 2 bath home situated on 1.43 private acres. This home is surrounded be peaceful countryside and showcasing long range pastoral views. This property offers the ideal setting for those seeking space, privacy, and rural living. Inside, the spacious living area features a gorgeous rock fireplace, wood-look luxury vinyl plank flooring flowing throughout the living room. The large dining area is perfect for gatherings, while the kitchen offers abundant cabinetry, chair rail molding, custom tile backsplash, and a hidden pet door for your furry friends to access the side deck. The spa
Key facts
- Private acres
- Hidden pet door
- Soaking tub
Tags
Property features AI
Finance
- Other: Zoned R-1; Outbuilding on the property; Lot approximately 1.43 acres; Directions available from Weaverville (provided in listing)
- HOA & community: No HOA
Exterior
- Parking: Driveway
- Security: Smoke detector(s)
- Utilities: Well water; Septic system installed; Cable available; Fiber optics
- Home design: Manufactured doublewide single-family residence; One level; Crawl space (permanent)
- Construction: Vinyl exterior; Composition roof
- Exterior features: Covered front and rear porches; Storage/outbuilding; Private, wooded lot with views; Hilly and level areas; Publicly maintained access via paved and gravel roads
Interior
- Kitchen: Dishwasher; Electric range; Microwave; Refrigerator; Kitchen island; Pantry
- Bedrooms: Three bedrooms on the main level
- Flooring: Carpet; Tile; Vinyl
- Bathrooms: Two full bathrooms on the main level
- Heating & cooling: Central heating (electric); Central air (electric); Ceiling fan(s)
- Interior features: Open floor plan with kitchen island and pantry; Split-bedroom layout; Walk-in closet(s); Insulated windows; Insulated and storm doors; 8 total rooms; Gas-vented propane fireplace in the living room; Smoke detector(s)
- Laundry & utility: Main-level laundry room; Washer and dryer included; Electric water heater
Neighborhood map
What this means for you Summary
Snapshot
- This is a 3-bed/2.0-bath manufactured listed at $255k.
Deal economics
- At list price, monthly cash flow is $28 ($339/yr) — positive.
- The deal already cash-flows at list — no discount required.
- To meet the 1% rule (rent ≥ 1% of price), the offer needs to be $193k (24.4% below list).
- Recommended offer: $193k (24.4% below list) — sets the bar for 1% rule.
- Cap rate 6.4% vs local median 2.3% in Mars Hill — top-decile yield for the area; either an underpriced asset or a hidden risk that comps aren't pricing in. Stress-test before assuming the spread holds.
Location & tenants
- Location reads 75/100 on livability (#49 in NC, #4,088 nationally) — a middle-class / working-renter tenant base. Strengths: housing A+, health & safety A+, crime A; Watch: amenities D, commute F.
- Madison County Schools (rural): math 51% / reading 56% proficiency, ranked #55 of 178 in NC (top 31%) — acceptable for families but not a draw, mixed tenant base, ~2y average lease.
- Zoned schools: Mars Hill Elementary (math 45% / reading 51%, grade D, #477 of 1,410 statewide, top 35%, 500 students, 53% FRL); Madison Middle School (math 44% / reading 56%, grade C, #113 of 475 statewide, top 25%, 452 students, 57% FRL); Madison High School (math 57% / reading 52%, grade C-, #270 of 535 statewide, top 52%, 414 students, 48% FRL) — zoned schools at 52% FRL track the district average.
- Market conditions: 136 active listings in the ZIP; 209 units permitted in Madison County in 2024 (5 in 5+ unit buildings).
Forward outlook
- In year one you build about $27k of equity ($2k loan paydown + $25k appreciation (10.0% local appreciation)).
- At projected returns (10.0% appreciation + 3.0% rent growth), your $71k cash investment doubles in ~3 years — after that, you're playing with house money.
- By year 2, paydown + projected appreciation supports a ~$44k cash-out refi (75% LTV) — recoverable capital for the next deal without selling this one.
Negotiation context
- It's been on market 15 days — a 2% lower offer ($251k) is reasonable based on typical stale-listing flexibility.
- Current owner paid $68k; list at $255k implies a 275% gain — meaningful room to come down on a strong offer.
Risks & watch-outs
- Climate carrying-cost: severe wildfire risk — expect insurance premiums to compound above CPI over the hold.
Questions for the listing agent
- Is there a deadline driving the sale (1031 exchange, divorce, estate, relocation)? That informs how much negotiation room exists.
- What's the average days-on-market for RENTAL listings here right now (not sales)? A rising rental-DOM trend means longer vacancies and softer asking-rent achievability than the comps imply.
- What's the recent tenant-quality profile in this submarket — average credit score on applications, eviction rate, late-payment / NSF rate, and stable-employment percentage? A property-management company in the area should have these aggregated.
- How much new for-sale + rental construction is in the pipeline within 1–3 miles? Heavy new supply typically softens prices + rents 12–24 months out; constrained supply supports both.
Investment metrics
- 1% rule
- 0.76% ✗
- Cap rate
- 6.43%
- Cash-on-cash
- 0.47%
- DSCR
- 1.02
- GRM
- 11.0
CMA / ARV
No comps found within radius.
Projected returns pro-forma
10.0% appreciation · 3.0% rent growth · sell at horizon
- IRR
- 24.6%
- Equity multiple
- 2.97×
- Total profit
- $140,487
- Equity at exit
- $229,634
- IRR
- 21.7%
- Equity multiple
- 6.77×
- Total profit
- $412,029
- Equity at exit
- $495,215
Cash invested: $71,372 (down + closing). Projections, not guarantees.
Landlord ↔ Tenant lean methodology
- Overall (STATE)
- 85 Strongly Landlord-Friendly
- State North Carolina
- 85 Strongly Landlord-Friendly · R+3
- County
- — inherits STATE
- City
- — inherits STATE
ZIP-level market 28753
- Home prices YoY
- 10.2%
- Active inventory
- 136
- Price-to-rent
- 11.0×
Monthly cashflow live
- Estimated rent
- $1,927 medium interval (Pro) →
- Mortgage (P&I)
- −$1,337
- Tax from tax record
- −$51 /mo · $610/yr
- Insurance
- −$106
- HOA
- −$0
- Vacancy / Maint / Mgmt
- −$405
- Net cashflow
- $28
Break-even live
Sensitivity live
| Price | -10% $173 | -5% $100 | +0% $28 | +5% $-44 | +10% $-116 |
|---|---|---|---|---|---|
| Rent | -10% $-124 | -5% $-48 | +0% $28 | +5% $104 | +10% $180 |
| Rate | -1.0pp $157 | -0.5pp $93 | base $28 | +0.5pp $-38 | +1.0pp $-105 |
UW: 25.0% down · 7.5% · 30yr · 1.5% tax · 5.0% vac · 8.0% maint · 8.0% mgmt
Financing live
Cash to close
- Down payment
- $63,725
- Closing costs
- $7,647
- Reserves months
- —
- Total cash needed
- —
Loan-product check · same deal, 3 products live
Conventional
25% down · 7.5% · 30yr
- Down + closing
- —
- Monthly P&I
- —
- Monthly cashflow
- —
- DSCR
- —
- Eligible?
- —
Personal DTI + credit; lowest rate.
DSCR
20% down · 8.5% · 30yr
- Down + closing
- —
- Monthly P&I
- —
- Monthly cashflow
- —
- DSCR
- —
- Eligible?
- —
No personal income docs; deal must DSCR.
Hard money
10% down · 12.0% · 12mo
- Down + closing
- —
- Monthly P&I
- —
- Monthly cashflow
- —
- DSCR
- —
- Eligible?
- —
Short-term bridge; refi at stabilization.
Listing history 11 events
-
2026-06-19days on market $254,900 Active 15 DOM
-
2026-06-18days on market $254,900 Active 14 DOM
-
2026-06-17days on market $254,900 Active 13 DOM
-
2026-06-16days on market $254,900 Active 12 DOM
-
2026-06-15days on market $254,900 Active 11 DOM
-
2026-06-14days on market $254,900 Active 9 DOM
-
2026-06-12days on market $254,900 Active 8 DOM
-
2026-06-09days on market $254,900 Active 5 DOM
-
2026-06-08days on market $254,900 Active 4 DOM
-
2026-06-07remarks 699-char remark
-
2026-06-07$254,900 Active 3 DOM
ⓘ Source: listings_history table (triggers on properties + properties_extension) + one-shot
backfill from property_details.listing_events for pre-trigger history.
Tax reassessment forecast NC · Resets to sale price
- Current annual tax
- $610 · $51/mo
- Projected year-2 tax
- $2,090 · $174/mo
- Expected delta
- +$1,480/yr (+$123/mo · 242.5%)
ⓘ Screening estimate from a state-policy table — verify with the county assessor before closing.
Climate risk First Street
- Flood 1/10 Low FEMA zone X (unshaded) · 0% chance over 30 yrs
- Wildfire 9/10 Extreme
- Heat 4/10 Moderate 8 d/yr ≥99°F today · 23 d/yr by 30 yrs out
- Wind 2/10 Low
- Air quality 2/10 Low 1 unhealthy d/yr today · 1 by 30 yrs out
Nearby sold comps map
Loading sold comps map…
Walkable amenities ~0.75 mi
Loading nearby amenities…
Taxation est. · year 1
- Rental income
- $23,119
- − Mortgage interest
- −$14,278
- − Property taxes
- −$610
- − Insurance
- −$1,274
- − Repairs & maintenance
- −$1,850
- − Management
- −$1,850
- − Depreciation
- −$7,415
- Taxable loss
- −$4,158
- Est. tax savings @ 24.0%
- +$998
- After-tax cash flow
- $1,337/yr
For passive investors: Depreciation is non-cash, so a rental often shows a tax loss while cash-flowing — sheltering income. Rental losses are passive: they offset passive income freely, and up to $25,000/yr can offset ordinary (W-2) income if you actively participate and your MAGI is under $100k (phasing out to $0 by $150k); unused losses carry forward. On sale, claimed depreciation is recaptured at up to 25%, and gains may owe capital-gains tax (a 1031 exchange can defer both). Figures are a year-1 estimate at your 24.0% rate — not tax advice; consult a CPA.
Schools (NCES district)
- District
- Madison County Schools
- NCES district ID
- 3702820
- Math proficiency
- 51% ▲ 3.00%
- Reading proficiency
- 56% ▲ 4.00%
- Median HH income
- $39,050
- Composite
- 44.62/100
- National rank
- #2774
- State rank
- #55 of 178 in NC
Livability — Mars Hill
- Score
- 75/100
- State rank
- #49
- US rank
- #4088
Category grades
Schools grade is shown separately in the Schools card above.
Census & demographics
- Population (ZIP)
- 9,778
Population outlook (Madison County) Hauer SSP2
- Today (2025)
- 21,646 people
- By 2030
- 21,839 · +0.9%
- By 2040
- 22,031 · +1.8%
- By 2050
- 22,050 · +1.9%
- By 2075
- 22,327 · +3.1%
- By 2100
- 21,365 · -1.3%
Race, ethnicity, and origin ACS 2023
- Neighborhood character
- Predominantly White (91%)
- Race & ethnicity
- White 91% Two or more races 6% Hispanic / Latino 3%
- Common ancestry
- Serbian 6% Slovak 3% Iranian 2%
- Foreign-born
- 1% · Canada
- Languages at home
- 99% English-only · Spanish 1%
Political lean MEDSL · Madison
- 2024 margin
- Strong R (+23.5) · D 37.5% · R 61.0% · Other 1.4%
- 2008→2024 swing
- -21.9pp toward R · 2008: -1.6pp · 2024: -23.5pp
- All cycles
- 2024: R+23.5 2020: R+23.5 2016: R+25.9 2012: R+9.1 2008: R+1.6
Not yet ingested
- Civics
- —
Market trends
- HPI YoY
- ▲ 28.22%
- Current HPI
- 305.7339
- Rent YoY
- —
- Metro
- —
- State GDP YoY
- ▲ 3.28%
- F500 in state
- 26
Industry mix (Fortune 500 HQ in NC)
| Industry | F500 HQs | Revenue |
|---|---|---|
| Financial Services | 2 | $213B |
|
||
| Retail | 2 | $95B |
|
||
| Industrial Conglomerate | 1 | $38B |
|
||
| Metals / Steel | 1 | $35B |
|
||
| Utilities | 1 | $30B |
|
||
| Industrial Machinery | 1 | $19B |
|
||
Price history
+222.7% since first listed3 events — show timeline
- 2026-06-04 Listed $254,900 CANOPYMLS as Distributed by MLS Grid
- 2012-09-17 Sold (Public Records) $68,000 Public Records
- 2007-12-20 Sold (Public Records) $79,000 Public Records
Property tax history
+3.2%/yrLatest (2023): $610 · +0.0% YoY. Source: county tax records.
Cash-flow waterfall
monthlySold comps — $/sqft
last 12 mo · ≤1 miLoading sold comps…