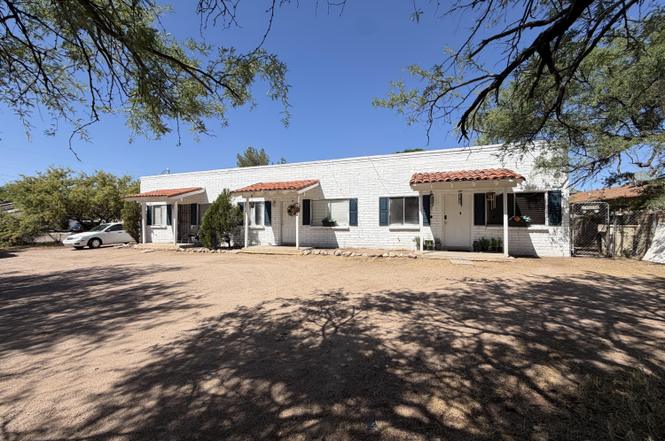
 Triplex
450 Via Lechuza · Rio Rico, AZ
Flood risk 1/10 · Minimal
- FEMA flood zone
- X (unshaded)
- Chance of flooding over 30 yrs
- 0.0%
- Est. flood insurance / yr
- $507 – $1,088
Fire risk 7/10 · Major
- Est. fire insurance / yr
- $610 – $1,132
Heat risk 7/10 · Major
- Hot days now (above 100°F)
- 7 days/yr
- Hot days in 30 yrs
- 21 days/yr
Wind risk 1/10 · Minimal
- Chance of severe wind over 30 yrs
- —
Air-quality risk 1/10 · Minimal
- Unhealthy air days now
- 0 days/yr
- Unhealthy air days in 30 yrs
- 0 days/yr
Risk factors via First Street. Map © Google.
Why this score? — see what drove the C+ grade
The composite is a weighted blend of 9 inputs, each scored 0–100. Each bar is that input's sub-score; the figure is the points it added to the 100-point composite (weight × sub-score).
- Cash flow +27.1/30.0
- Appreciation +10.0/10.0
- DSCR +9.4/10.0
- 1% rule +6.1/10.0
- Livability +3.2/5.0
- Rent growth +2.5/5.0
- Condition / age +2.5/5.0
- Schools +1.7/10.0
- ARV discount +1.1/15.0
$359,000
🖨 Deal sheet (PDF) 📄 Offer letter ✓ Due diligence
Multi-family units
County records classify this as Multi-Family (2-4 Unit). Listing-text estimate: 3 units. confirmed
Listing remarks
Investment opportunity in a prime location! This well-maintained triplex features durable brick construction and is conveniently located near shopping, services, schools, and walking trails. Each unit offers 2 bedrooms and 1 bathroom, making it an attractive option for tenants. Live in one unit and generate rental income from the other two. Great potential for owner-occupants or investors looking to expand their portfolio.
Key facts
- Near schools
- Near shopping
- Near services
Tags
Property features AI
Finance
- Other: Zoning: SCC - MFR
- Financial info: Three total units; Gross scheduled income: $2,775; Gross income: $2,950; Operating expenses: $419.98; Insurance expense: $150.08; Net operating income: $2,530.02; Water/sewer expense: $175
- HOA & community: Walking trail
Exterior
- Parking: On-property parking (total 3 spaces)
- Utilities: Sewer connected
- Home design: Triplex; Single-story units
- Construction: Brick construction; Built-up reflective roof
- Exterior features: East/West exposure; Paved road access (county)
Interior
- Kitchen: Gas range
- Bedrooms: Three 2-bedroom units (all on 1st floor)
- Flooring: Ceramic tile
- Bathrooms: Three full bathrooms (one per unit)
- Heating & cooling: Gas pack and propane heating; Evaporative cooling
- Interior features: Ceramic tile floors; Enclosed patio/porch
- Laundry & utility: Laundry closet
Neighborhood map
What this means for you Summary
Snapshot
- This is a 3 × 2-bed/1-bath units multifamily listed at $359k.
Deal economics
- At list price, monthly cash flow is $1k ($12k/yr) — positive. Per door: $339/mo.
- The deal already cash-flows at list — no discount required.
- Meets the 1% rule at list price ($4k rent vs $359k).
- Recommended offer: $348k (3.0% below list) — sets the bar for market timing.
- Cap rate 9.7% vs local median 4.1% in Rio Rico — top-decile yield for the area; either an underpriced asset or a hidden risk that comps aren't pricing in. Stress-test before assuming the spread holds.
Location & tenants
- Location reads 63/100 on livability (#115 in AZ) — a middle-class / working-renter tenant base. Strengths: cost of living A+, housing A+; Watch: health & safety C-, employment D+, crime F.
- Santa Cruz Valley Unified District (4458) (town): math 12% / reading 26% proficiency, ranked #184 of 249 in AZ (top 74%) — low school quality limits family demand, transient renter base, plan for 1-2y turnover; 62% free/reduced lunch — lower-income household profile, screen leases tightly.
- Zoned schools: Mountain View School (math 8% / reading 17%, grade F, #944 of 1,109 statewide, top 87%, 387 students, 83% FRL); Coatimundi Middle School (math 16% / reading 32%, grade F, #109 of 218 statewide, top 51%, 473 students, 69% FRL); Rio Rico High School (math 13% / reading 21%, grade F, #252 of 381 statewide, top 67%, 1,414 students, 72% FRL).
- Market conditions: 414 active listings in the ZIP; 340 units permitted in Santa Cruz County in 2024 (0 in 5+ unit buildings).
Forward outlook
- In year one you build about $38k of equity ($2k loan paydown + $36k appreciation (10.0% local appreciation)).
- Santa Cruz County population projected at -22% by 2050 — secular population decline; favor cash flow + early exit over multi-decade hold.
- At projected returns (10.0% appreciation + 3.0% rent growth), your $101k cash investment doubles in ~2 years — after that, you're playing with house money.
- By year 2, paydown + projected appreciation supports a ~$62k cash-out refi (75% LTV) — recoverable capital for the next deal without selling this one.
Negotiation context
- It's been on market 31 days — a 3% lower offer ($348k) is reasonable based on typical stale-listing flexibility.
- 3 sale attempts with the ask held roughly flat each time — persistent listings suggest the price (not the market) is what's stuck; bring a comps-based counter.
- Current owner paid $110k; list at $359k implies a 226% gain — meaningful room to come down on a strong offer.
Risks & watch-outs
- Climate carrying-cost: major wildfire risk; extreme-heat days projected 7→21/yr by 2055 (HVAC capex compounding) — expect insurance premiums to compound above CPI over the hold.
Questions for the listing agent
- It's been on market 31 days. Have you received any prior offers? Is the seller open to a 3% concession, seller financing, or rate buy-down credit?
- Can we see the unit-by-unit rent roll, current vacancy, and any below-market leases? What's the average tenancy length?
- What capital expenditures (roof, boiler, parking lot, exteriors) have been made in the last 5 years, and what's planned in the next 2?
- Is there a deadline driving the sale (1031 exchange, divorce, estate, relocation)? That informs how much negotiation room exists.
- Schools are F-rated, which usually means shorter tenancies and higher turnover. Who's the typical renter profile here, and what's been the actual vacancy rate?
- Crime grade is F in this area — have there been break-ins, vandalism, or insurance claims at this property in the last 3 years? What carrier currently insures it and at what premium?
- What's the average days-on-market for RENTAL listings here right now (not sales)? A rising rental-DOM trend means longer vacancies and softer asking-rent achievability than the comps imply.
- What's the recent tenant-quality profile in this submarket — average credit score on applications, eviction rate, late-payment / NSF rate, and stable-employment percentage? A property-management company in the area should have these aggregated.
- How much new apartment / multifamily construction is in the pipeline within 1–3 miles? Heavy new supply (>2% of stock underway) typically softens rents 12–24 months out; light construction supports rent growth.
Investment metrics
- 1% rule
- 1.11% ✓
- Cap rate
- 9.69%
- Cash-on-cash
- 12.14%
- DSCR
- 1.54
- GRM
- 7.5
CMA / ARV
- ARV (median comp)
- $314,258
- List price
- $359,000
- Delta
- 14.24%
- Verdict
- OVERPRICED
- Comps
- 3 within 1.0 mi
Projected returns pro-forma
10.0% appreciation · 3.0% rent growth · sell at horizon
- IRR
- 33.2%
- Equity multiple
- 3.59×
- Total profit
- $260,142
- Equity at exit
- $323,416
- IRR
- 28.6%
- Equity multiple
- 8.11×
- Total profit
- $714,821
- Equity at exit
- $697,458
Cash invested: $100,520 (down + closing). Projections, not guarantees.
Landlord ↔ Tenant lean methodology
- Overall (STATE)
- 87 Strongly Landlord-Friendly
- State Arizona
- 87 Strongly Landlord-Friendly · R+3
- County
- — inherits STATE
- City
- — inherits STATE
ZIP-level market 85648
- Home prices YoY
- 21.0%
- Active inventory
- 414
- Price-to-rent
- 22.6×
Monthly cashflow live
- Estimated rent
- $3,980 high interval (Pro) →
- Mortgage (P&I)
- −$1,883
- Tax from tax record
- −$95 /mo · $1,139/yr
- Insurance
- −$150
- HOA
- −$0
- Vacancy / Maint / Mgmt
- −$836
- Net cashflow
- $1,017
Break-even live
Sensitivity live
| Price | -10% $1,220 | -5% $1,119 | +0% $1,017 | +5% $915 | +10% $814 |
|---|---|---|---|---|---|
| Rent | -10% $703 | -5% $860 | +0% $1,017 | +5% $1,174 | +10% $1,332 |
| Rate | -1.0pp $1,198 | -0.5pp $1,108 | base $1,017 | +0.5pp $924 | +1.0pp $829 |
3-unit breakdown (identical units grouped — click to expand)
| Units | Beds | Baths | Est. rent |
|---|---|---|---|
| 3× units | 2 | 1 | $3,981 |
| #1 | 2 | 1 | $1,327 |
| #2 | 2 | 1 | $1,327 |
| #3 | 2 | 1 | $1,327 |
| Total (3 units) | $3,980 | ||
UW: 25.0% down · 7.5% · 30yr · 1.5% tax · 5.0% vac · 8.0% maint · 8.0% mgmt
Financing live
Cash to close
- Down payment
- $89,750
- Closing costs
- $10,770
- Reserves months
- —
- Total cash needed
- —
Loan-product check · same deal, 3 products live
Conventional
25% down · 7.5% · 30yr
- Down + closing
- —
- Monthly P&I
- —
- Monthly cashflow
- —
- DSCR
- —
- Eligible?
- —
Personal DTI + credit; lowest rate.
DSCR
20% down · 8.5% · 30yr
- Down + closing
- —
- Monthly P&I
- —
- Monthly cashflow
- —
- DSCR
- —
- Eligible?
- —
No personal income docs; deal must DSCR.
Hard money
10% down · 12.0% · 12mo
- Down + closing
- —
- Monthly P&I
- —
- Monthly cashflow
- —
- DSCR
- —
- Eligible?
- —
Short-term bridge; refi at stabilization.
Listing history 19 events
-
2026-06-15status $359,000 Pending 31 DOM
-
2026-06-15days on market $359,000 Active Contingent 31 DOM
-
2026-06-13days on market $359,000 Active Contingent 29 DOM
-
2026-06-10days on market $359,000 Active Contingent 26 DOM
-
2026-06-09days on market $359,000 Active Contingent 25 DOM
-
2026-06-08days on market $359,000 Active Contingent 24 DOM
-
2026-06-07days on market $359,000 Active Contingent 23 DOM
-
2026-06-05days on market $359,000 Active Contingent 20 DOM
-
2026-06-03days on market $359,000 Active Contingent 19 DOM
-
2026-06-02days on market $359,000 Active Contingent 18 DOM
-
2026-06-01days on market $359,000 Active Contingent 17 DOM
-
2026-05-31days on market $359,000 Active Contingent 16 DOM
-
2026-05-10$359,000 Active 426-char remark
-
2025-11-15historical $925
-
2025-11-12price $925
-
2025-11-01$950
-
2025-08-26historical $925
-
2025-08-18$925
-
2002-07-18soldstatus $110,000
ⓘ Source: listings_history table (triggers on properties + properties_extension) + one-shot
backfill from property_details.listing_events for pre-trigger history.
Tax reassessment forecast AZ · Resets to sale price
- Current annual tax
- $1,139 · $95/mo
- Projected year-2 tax
- $2,369 · $197/mo
- Expected delta
- +$1,231/yr (+$103/mo · 108.1%)
ⓘ Screening estimate from a state-policy table — verify with the county assessor before closing.
Climate risk First Street
- Flood 1/10 Low FEMA zone X (unshaded) · 0% chance over 30 yrs
- Wildfire 7/10 Severe
- Heat 7/10 Severe 7 d/yr ≥100°F today · 21 d/yr by 30 yrs out
- Wind 1/10 Low
- Air quality 1/10 Low 0 unhealthy d/yr today · 0 by 30 yrs out
Nearby sold comps map
Loading sold comps map…
Walkable amenities ~0.75 mi
Loading nearby amenities…
Taxation est. · year 1
- Rental income
- $47,760
- − Mortgage interest
- −$20,110
- − Property taxes
- −$1,139
- − Insurance
- −$1,795
- − Repairs & maintenance
- −$3,821
- − Management
- −$3,821
- − Depreciation
- −$10,444
- Taxable income
- $6,631
- Est. tax owed @ 24.0%
- −$1,592
- After-tax cash flow
- $10,613/yr
For passive investors: Depreciation is non-cash, so a rental often shows a tax loss while cash-flowing — sheltering income. Rental losses are passive: they offset passive income freely, and up to $25,000/yr can offset ordinary (W-2) income if you actively participate and your MAGI is under $100k (phasing out to $0 by $150k); unused losses carry forward. On sale, claimed depreciation is recaptured at up to 25%, and gains may owe capital-gains tax (a 1031 exchange can defer both). Figures are a year-1 estimate at your 24.0% rate — not tax advice; consult a CPA.
Schools (NCES district)
- District
- Santa Cruz Valley Unified District (4458)
- NCES district ID
- 0407520
- Math proficiency
- 12% ▼ -19.00%
- Reading proficiency
- 26% ▼ -9.00%
- Median HH income
- $48,019
- Composite
- 16.84/100
- National rank
- #9147
- State rank
- #184 of 249 in AZ
Livability — Rio Rico
- Score
- 63/100
- State rank
- #115
- US rank
- #15321
Category grades
Schools grade is shown separately in the Schools card above.
Census & demographics
- Census place
- Rio Rico, AZ
- County
- Santa Cruz County · 22,118 people
- City population
- 22,118
- Metro
- Nogales, AZ
- Population (ZIP)
- 22,118
- Household income
- $61,519
- Rent vs Own
- Severe rent burden
- 407.0
Population outlook (Santa Cruz County) Hauer SSP2
- Today (2025)
- 43,796 people
- By 2030
- 42,097 · -3.9%
- By 2040
- 38,235 · -12.7%
- By 2050
- 34,224 · -21.9%
- By 2075
- 26,014 · -40.6%
- By 2100
- 18,165 · -58.5%
Race, ethnicity, and origin ACS 2023
- Neighborhood character
- Predominantly Hispanic (86%)
- Race & ethnicity
- Hispanic / Latino 86% Two or more races 48% White 12%
- Hispanic origin (detail)
- Mexican 83%
- Common ancestry
- Lithuanian 1% Slovak 1% Iranian 1%
- Foreign-born
- 30% · Canada
- Languages at home
- 21% English-only · Spanish 79%
Political lean MEDSL · Santa Cruz
- 2024 margin
- D (+18.6) · D 58.9% · R 40.3%
- 2008→2024 swing
- -12.7pp toward R · 2008: 31.3pp · 2024: 18.6pp
- All cycles
- 2024: D+18.6 2020: D+35.5 2016: D+47.1 2012: D+37.8 2008: D+31.3
Not yet ingested
- Civics
- —
Market trends
- HPI YoY
- ▲ 72.18%
- Current HPI
- 415.2167
- Rent YoY
- —
- Metro
- Nogales, AZ
- State GDP YoY
- ▲ 4.54%
- F500 in state
- 20
Industry mix (Fortune 500 HQ in AZ)
| Industry | F500 HQs | Revenue |
|---|---|---|
| Technology | 2 | $13B |
|
||
| Mining / Metals | 1 | $23B |
|
||
| Environmental Services | 1 | $16B |
|
||
| Metals / Steel | 1 | $14B |
|
||
| Technology Distribution | 1 | $9B |
|
||
| Homebuilding | 1 | $8B |
|
||
Price history
+226.4% since first listed9 events — show timeline
- 2026-06-15 Pending — MLSSAZ
- 2026-05-22 Contingent — MLSSAZ
- 2026-05-10 Listed $359,000 MLSSAZ
- 2025-11-15 Rental Removed $925 IMANAGERENT
- 2025-11-12 Price Changed $925 IMANAGERENT
- 2025-11-01 Listed for Rent $950 IMANAGERENT
- 2025-08-26 Rental Removed $925 IMANAGERENT
- 2025-08-18 Listed for Rent $925 IMANAGERENT
- 2002-07-18 Sold (Public Records) $110,000 Public Records
Property tax history
-2.7%/yrLatest (2025): $1,139 · +6.0% YoY. Source: county tax records.
Cash-flow waterfall
monthlySold comps — $/sqft
last 12 mo · ≤1 miLoading sold comps…