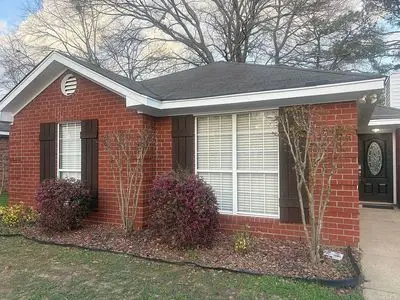
30 Meadow Oaks Pl · Millbrook, AL
Flood risk 1/10 · Minimal
- FEMA flood zone
- X (unshaded)
- Chance of flooding over 30 yrs
- 0.0%
- Est. flood insurance / yr
- $507 – $1,088
Fire risk 3/10 · Minor
- Est. fire insurance / yr
- $916 – $1,700
Heat risk 7/10 · Major
- Hot days now (above 108°F)
- 7 days/yr
- Hot days in 30 yrs
- 20 days/yr
Wind risk 8/10 · Major
- Chance of severe wind over 30 yrs
- 80.0%
Air-quality risk 3/10 · Minor
- Unhealthy air days now
- 2 days/yr
- Unhealthy air days in 30 yrs
- 3 days/yr
Risk factors via First Street. Map © Google.
Why this score? — see what drove the C grade
The composite is a weighted blend of 9 inputs, each scored 0–100. Each bar is that input's sub-score; the figure is the points it added to the 100-point composite (weight × sub-score).
- Cash flow +21.1/30.0
- ARV discount +10.2/15.0
- DSCR +6.7/10.0
- Rent growth +4.8/5.0
- 1% rule +4.2/10.0
- Schools +3.5/10.0
- Livability +3.3/5.0
- Condition / age +2.5/5.0
- Appreciation +0.0/10.0
$187,500
🖨 Deal sheet (PDF) 📄 Offer letter ✓ Due diligence
Listing remarks MLS
This is a great home in fabulous Meadow Oaks. This 3 bed 2 ba home is located convenient to Prattville and the interstate. The home has high ceilings, fireplace, large kitchen, fenced backyard with patio, and security system. The owners have taken great care of this property including replacing the roof and water heater in the past couple years. This home comes complete with ALL appliances, including WASHER AND DRYER!!! The owners are offering a flooring allowance with an acceptable offer.
Key facts
- Built 1996
Neighborhood map
What this means for you Summary
Snapshot
- This is a 3-bed/2.0-bath single-family listed at $188k.
Deal economics
- At list price, monthly cash flow is $268 ($3k/yr) — positive.
- The deal already cash-flows at list — no discount required.
- To meet the 1% rule (rent ≥ 1% of price), the offer needs to be $173k (7.9% below list).
- Recommended offer: $173k (7.9% below list) — sets the bar for 1% rule.
- Cap rate 8.0% vs local median 4.4% in Millbrook — top-decile yield for the area; either an underpriced asset or a hidden risk that comps aren't pricing in. Stress-test before assuming the spread holds.
Location & tenants
- Location reads 66/100 on livability (#110 in AL) — a middle-class / working-renter tenant base. Strengths: cost of living A+, housing A+; Watch: crime D+, amenities F, commute F.
- Elmore County (town): math 27% / reading 54% proficiency, ranked #21 of 129 in AL (top 16%) — families likely to look elsewhere, expect single-tenant / working-renter base with shorter leases.
- Zoned schools: Coosada Elementary School (930 students, 70% FRL); Millbrook Middle School (math 27% / reading 52%, grade F, #61 of 257 statewide, top 24%, 1,185 students, 75% FRL); Stanhope Elmore High School (math 21% / reading 35%, grade F, #87 of 305 statewide, top 29%, 1,181 students, 62% FRL) — zoned schools average 69% FRL vs 44% district-wide (25 pts higher); higher-poverty schools than district average — tighter screening recommended.
- Market conditions: Rents rising fast (+9.0%/yr); 84 active listings in the ZIP; 6 comparable units currently listed for rent nearby; rentals at typical pace (median 15d on market — plan ~3-4 weeks tenant-placement turnaround); 92 units permitted in Elmore County in 2024 (0 in 5+ unit buildings).
- This rent runs 30% of the median local income ($68k/yr) — at the standard rent-burdened threshold; future hikes will face affordability resistance.
Forward outlook
- Local home prices are declining (-3.0%/yr); year-one equity from $1k of loan paydown is wiped out by about $6k of value loss. Plan a longer hold.
- Elmore County population projected at +6% by 2050 — modest demand growth; plan on rents tracking national, not racing it.
- At projected returns (-3.0% appreciation + 8.0% rent growth), your $52k cash investment doubles in ~9 years — after that, you're playing with house money.
Negotiation context
- Only 0 days on market — expect competitive offers; lowballing is unlikely to land.
- 4 sale attempts since 22y ago with the ask held roughly flat each time — persistent listings suggest the price (not the market) is what's stuck; bring a comps-based counter.
Risks & watch-outs
- Climate carrying-cost: severe wind risk, 80% chance of damaging wind over 30y; extreme-heat days projected 7→20/yr by 2055 (HVAC capex compounding) — expect insurance premiums to compound above CPI over the hold.
Questions for the listing agent
- Is there a deadline driving the sale (1031 exchange, divorce, estate, relocation)? That informs how much negotiation room exists.
- Crime grade is D in this area — have there been break-ins, vandalism, or insurance claims at this property in the last 3 years? What carrier currently insures it and at what premium?
- What's the average days-on-market for RENTAL listings here right now (not sales)? A rising rental-DOM trend means longer vacancies and softer asking-rent achievability than the comps imply.
- What's the recent tenant-quality profile in this submarket — average credit score on applications, eviction rate, late-payment / NSF rate, and stable-employment percentage? A property-management company in the area should have these aggregated.
- How much new for-sale + rental construction is in the pipeline within 1–3 miles? Heavy new supply typically softens prices + rents 12–24 months out; constrained supply supports both.
Investment metrics
- 1% rule
- 0.92% ✗
- Cap rate
- 8.01%
- Cash-on-cash
- 6.12%
- DSCR
- 1.27
- GRM
- 9.0
CMA / ARV
- ARV (on-the-fly)
- $199,485
- Comps found
- 12
Show comp detail 12 sales within ~0.75 mi
| Address | Dist | Beds/Ba | Sqft | Sold | Price | $/sf | Match |
|---|---|---|---|---|---|---|---|
| 3242 Browns Rd | 0.11mi | 3/2.0 | 1,375 (-1%) | 3mo | $215,000 | $156 | 90 |
| 3340 Browns Rd | 0.11mi | 3/2.0 | 1,367 (-2%) | 2mo | $210,000 | $154 | 90 |
| 193 Homewood Dr | 0.15mi | 3/2.0 | 1,573 (+13%) | 4mo | $249,900 | $159 | 68 |
| 126 Forest Trl | 0.41mi | 2/2.0 (-1) | 1,324 (-5%) | 1mo | $163,999 | $124 | 67 |
| 87 Penton Ct | 0.29mi | 2/2.0 (-1) | 1,332 (-4%) | 9mo | $183,500 | $138 | 66 |
| 61 Penton Ct | 0.28mi | 3/2.0 | 1,268 (-9%) | 11mo | $190,000 | $150 | 63 |
| 44 Vann Ct | 0.56mi | 3/2.0 | 1,337 (-4%) | 7mo | $242,500 | $181 | 61 |
| 157 Cattail Curv | 0.68mi | 3/2.0 | 1,433 (+3%) | 5mo | $205,000 | $143 | 60 |
| 5761 Main St | 0.43mi | 3/1.0 | 1,551 (+11%) | 1mo | $193,000 | $124 | 57 |
| 256 James Dr | 0.43mi | 2/2.0 (-1) | 1,260 (-10%) | 8mo | $135,000 | $107 | 52 |
| 99 Cattail Curv | 0.73mi | 3/2.0 | 1,493 (+7%) | 4mo | $201,000 | $135 | 51 |
| 125 Cattail Curv | 0.71mi | 3/2.0 | 1,557 (+12%) | 12mo | $210,000 | $135 | 38 |
Match score weights: distance 35% · size 25% · config 20% · recency 20%. Top-matched comps best support the ARV.
Projected returns pro-forma
-3.0% appreciation · 8.0% rent growth · sell at horizon
- IRR
- -2.1%
- Equity multiple
- 0.92×
- Total profit
- $-4,307
- Equity at exit
- $27,957
- IRR
- 11.9%
- Equity multiple
- 2.13×
- Total profit
- $59,347
- Equity at exit
- $16,212
Cash invested: $52,500 (down + closing). Projections, not guarantees.
Landlord ↔ Tenant lean methodology
- Overall (STATE)
- 90 Strongly Landlord-Friendly
- State Alabama
- 90 Strongly Landlord-Friendly · R+15
- County
- — inherits STATE
- City
- — inherits STATE
ZIP-level market 36054
- Home prices YoY
- -26.9%
- Rents YoY
- 9.0%
- Active inventory
- 84
- Price-to-rent
- 9.0×
Monthly cashflow live
- Estimated rent
- $1,727 high interval (Pro) →
- Mortgage (P&I)
- −$983
- Tax from tax record
- −$35 /mo · $424/yr
- Insurance
- −$78
- HOA
- −$0
- Vacancy / Maint / Mgmt
- −$363
- Net cashflow
- $268
Break-even live
Sensitivity live
| Price | -10% $374 | -5% $321 | +0% $268 | +5% $215 | +10% $161 |
|---|---|---|---|---|---|
| Rent | -10% $131 | -5% $199 | +0% $268 | +5% $336 | +10% $404 |
| Rate | -1.0pp $362 | -0.5pp $315 | base $268 | +0.5pp $219 | +1.0pp $170 |
UW: 25.0% down · 7.5% · 30yr · 1.5% tax · 5.0% vac · 8.0% maint · 8.0% mgmt
Financing live
Cash to close
- Down payment
- $46,875
- Closing costs
- $5,625
- Reserves months
- —
- Total cash needed
- —
Loan-product check · same deal, 3 products live
Conventional
25% down · 7.5% · 30yr
- Down + closing
- —
- Monthly P&I
- —
- Monthly cashflow
- —
- DSCR
- —
- Eligible?
- —
Personal DTI + credit; lowest rate.
DSCR
20% down · 8.5% · 30yr
- Down + closing
- —
- Monthly P&I
- —
- Monthly cashflow
- —
- DSCR
- —
- Eligible?
- —
No personal income docs; deal must DSCR.
Hard money
10% down · 12.0% · 12mo
- Down + closing
- —
- Monthly P&I
- —
- Monthly cashflow
- —
- DSCR
- —
- Eligible?
- —
Short-term bridge; refi at stabilization.
Rent comps 6 comps
| Address | Beds | Baths | Sqft | Rent | $/sqft | DOM | Units | Dist |
|---|---|---|---|---|---|---|---|---|
| 5421 Shady Dr Millbrook, AL | 4.0 | 2.0 | 1809 | $1,800 | $1.00 | 45d | 1 | 0.16mi |
| 33 Jamestown Loop Millbrook, AL | 2.0 | 2.0 | 1245 | $1,375 | $1.10 | 15d | 1 | 0.47mi |
| 30 Payton Ct Millbrook, AL | 4.0 | 2.0 | 1764 | $2,000 | $1.13 | 15d | 1 | 0.64mi |
| 63 Lilly Pad Cir Millbrook, AL | 3.0 | 2.0 | 1521 | $1,700 | $1.12 | 15d | 1 | 0.85mi |
| 101 Crossings Dr Millbrook, AL | 1.0–3.0 | 1.0–2.0 | 1086 | $1,670 | $1.54 | 15d | 7 | 1.02mi |
| 223 S Springfield Dr Millbrook, AL | 3.0 | 2.0 | 1761 | $1,950 | $1.11 | 45d | 1 | 1.06mi |
Listing history 9 events
-
2026-05-26$187,500
-
2026-04-15soldstatus $190,000
-
2012-09-18soldstatus $119,000 494-char remark
Show marketing remark (494 chars)
This is a great home in fabulous Meadow Oaks. This 3 bed 2 ba home is located convenient to Prattville and the interstate. The home has high ceilings, fireplace, large kitchen, fenced backyard with patio, and security system. The owners have taken great care of this property including replacing the roof and water heater in the past couple years. This home comes complete with ALL appliances, including WASHER AND DRYER!!! The owners are offering a flooring allowance with an acceptable offer.
-
2012-09-18soldstatus $119,000
Show marketing remark (494 chars)
This is a great home in fabulous Meadow Oaks. This 3 bed 2 ba home is located convenient to Prattville and the interstate. The home has high ceilings, fireplace, large kitchen, fenced backyard with patio, and security system. The owners have taken great care of this property including replacing the roof and water heater in the past couple years. This home comes complete with ALL appliances, including WASHER AND DRYER!!! The owners are offering a flooring allowance with an acceptable offer.
-
2012-07-12$124,900 494-char remark
Show marketing remark (494 chars)
This is a great home in fabulous Meadow Oaks. This 3 bed 2 ba home is located convenient to Prattville and the interstate. The home has high ceilings, fireplace, large kitchen, fenced backyard with patio, and security system. The owners have taken great care of this property including replacing the roof and water heater in the past couple years. This home comes complete with ALL appliances, including WASHER AND DRYER!!! The owners are offering a flooring allowance with an acceptable offer.
-
2010-07-01$129,900
-
2004-05-27soldstatus $94,900
-
2004-05-27soldstatus $94,900
-
2004-04-09$94,900
ⓘ Source: listings_history table (triggers on properties + properties_extension) + one-shot
backfill from property_details.listing_events for pre-trigger history.
Tax reassessment forecast AL · Resets to sale price
- Current annual tax
- $424 · $35/mo
- Projected year-2 tax
- $769 · $64/mo
- Expected delta
- +$345/yr (+$29/mo · 81.3%)
ⓘ Screening estimate from a state-policy table — verify with the county assessor before closing.
Climate risk First Street
- Flood 1/10 Low FEMA zone X (unshaded) · 0% chance over 30 yrs
- Wildfire 3/10 Moderate
- Heat 7/10 Severe 7 d/yr ≥108°F today · 20 d/yr by 30 yrs out
- Wind 8/10 Severe 80% chance of damaging wind over 30 yrs
- Air quality 3/10 Moderate 2 unhealthy d/yr today · 3 by 30 yrs out
Nearby sold comps map
Loading sold comps map…
Walkable amenities ~0.75 mi
Loading nearby amenities…
Taxation est. · year 1
- Rental income
- $20,724
- − Mortgage interest
- −$10,503
- − Property taxes
- −$424
- − Insurance
- −$938
- − Repairs & maintenance
- −$1,658
- − Management
- −$1,658
- − Depreciation
- −$5,455
- Taxable income
- $90
- Est. tax owed @ 24.0%
- −$21
- After-tax cash flow
- $3,190/yr
For passive investors: Depreciation is non-cash, so a rental often shows a tax loss while cash-flowing — sheltering income. Rental losses are passive: they offset passive income freely, and up to $25,000/yr can offset ordinary (W-2) income if you actively participate and your MAGI is under $100k (phasing out to $0 by $150k); unused losses carry forward. On sale, claimed depreciation is recaptured at up to 25%, and gains may owe capital-gains tax (a 1031 exchange can defer both). Figures are a year-1 estimate at your 24.0% rate — not tax advice; consult a CPA.
Schools (NCES district)
- District
- Elmore County
- NCES district ID
- 0101290
- Math proficiency
- 27% ▼ -25.00%
- Reading proficiency
- 54% ▲ 3.00%
- Median HH income
- $54,898
- Composite
- 35.27/100
- National rank
- #4974
- State rank
- #21 of 129 in AL
Livability — Millbrook
- Score
- 66/100
- State rank
- #110
- US rank
- #12087
Category grades
Schools grade is shown separately in the Schools card above.
Census & demographics
- Census place
- Millbrook, AL
- County
- Elmore County · 36,842 people
- City population
- 14,600
- Metro
- Montgomery, AL
- Population (ZIP)
- 14,600
- Household income
- $68,438
- Rent vs Own
- Severe rent burden
- 201.0
Population outlook (Elmore County) Hauer SSP2
- Today (2025)
- 85,154 people
- By 2030
- 86,667 · +1.8%
- By 2040
- 89,014 · +4.5%
- By 2050
- 90,331 · +6.1%
- By 2075
- 96,096 · +12.8%
- By 2100
- 95,290 · +11.9%
Race, ethnicity, and origin ACS 2023
- Neighborhood character
- Diverse neighborhood (Simpson 0.56)
- Race & ethnicity
- White 60% Black 27% Hispanic / Latino 7% Two or more races 5% Asian 1%
- Hispanic origin (detail)
- Mexican 5%
- Common ancestry
- Italian 2% Slovak 1% Lithuanian 1%
- Foreign-born
- 3% · Canada
- Languages at home
- 94% English-only · Spanish 5% Other Indo-European 0%
Political lean MEDSL · Elmore
- 2024 margin
- Solid R (+52.1) · D 23.6% · R 75.6%
- 2008→2024 swing
- -1.1pp toward R · 2008: -50.9pp · 2024: -52.1pp
- All cycles
- 2024: R+52.1 2020: R+48.2 2016: R+52.0 2012: R+48.8 2008: R+50.9
Not yet ingested
- Civics
- —
Market trends
- HPI YoY
- ▼ -55.96%
- Current HPI
- 151.6671
- Rent YoY
- ▲ 9.03%
- Metro
- Montgomery, AL
- State GDP YoY
- ▲ 2.94%
- F500 in state
- 4
Industry mix (Fortune 500 HQ in AL)
| Industry | F500 HQs | Revenue |
|---|---|---|
| Financial Services | 1 | $8B |
|
||
| Healthcare | 1 | $5B |
|
||
Price history
+97.6% since first listed9 events — show timeline
- 2026-05-26 Listed $187,500 FSBO.com
- 2026-04-15 Sold (Public Records) $190,000 Public Records
- 2012-09-18 Sold (Public Records) $119,000 Public Records
- 2012-09-18 Sold (MLS) $119,000 MAAR
- 2012-07-12 Listed $124,900 MAAR
- 2010-07-01 Listed $129,900 MAAR
- 2004-05-27 Sold (Public Records) $94,900 Public Records
- 2004-05-27 Sold (MLS) $94,900 MAAR
- 2004-04-09 Listed $94,900 MAAR
Property tax history
+1.6%/yrLatest (2025): $424 · +0.0% YoY. Source: county tax records.
Cash-flow waterfall
monthlySold comps — $/sqft
last 12 mo · ≤1 miLoading sold comps…