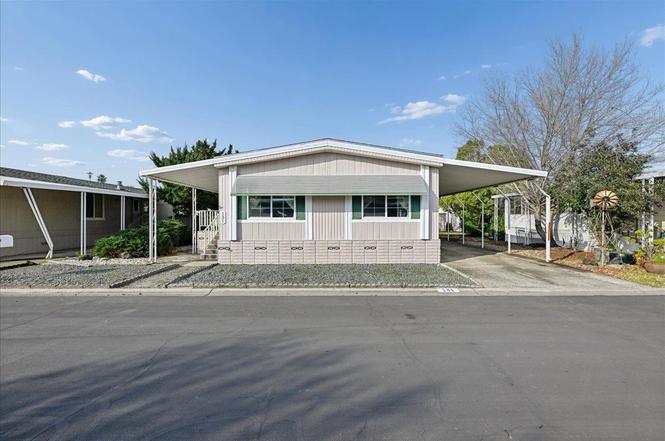
131 Hibiscus Ave · Florin, CA
Flood risk 1/10 · Minimal
- FEMA flood zone
- X (shaded)
- Chance of flooding over 30 yrs
- 0.0%
- Est. flood insurance / yr
- $507 – $1,088
Fire risk 5/10 · Moderate
- Est. fire insurance / yr
- $659 – $1,223
Heat risk 7/10 · Major
- Hot days now (above 102°F)
- 6 days/yr
- Hot days in 30 yrs
- 12 days/yr
Wind risk 1/10 · Minimal
- Chance of severe wind over 30 yrs
- —
Air-quality risk 10/10 · Severe
- Unhealthy air days now
- 28 days/yr
- Unhealthy air days in 30 yrs
- 33 days/yr
Risk factors via First Street. Map © Google.
Why this score? — see what drove the B grade
The composite is a weighted blend of 9 inputs, each scored 0–100. Each bar is that input's sub-score; the figure is the points it added to the 100-point composite (weight × sub-score).
- Cash flow +30.0/30.0
- 1% rule +10.0/10.0
- DSCR +10.0/10.0
- ARV discount +7.5/15.0
- Schools +4.1/10.0
- Livability +2.9/5.0
- Condition / age +2.5/5.0
- Rent growth +2.4/5.0
- Appreciation +1.3/10.0
$94,000
🖨 Deal sheet 📄 Offer letter ✓ Due diligence
Listing remarks
Honey Stop the Car! This home boasts of 1152 SF, 2 bedrooms, 2 baths, master bath has new walk in shower, large open living room with dining area. Kitchen has dishwasher, freestanding gas stove/oven, new garbage disposal, free standing refrigerator, Laundry room with washer and dryer, central heat & air conditioning, new gas water heater, covered parking area. Low maintenance landscaping. New storage shed with electricity Amenities include Clubhouse, library, pool & spa
Key facts
- Open living room
- Clubhouse
- Laundry room
Tags
Property features AI
Finance
- Other: Address: 131 Hibiscus Ave, Sacramento, CA 95828; Directions provided to locate property within Casa De Flores Park
- HOA & community: No homeowners association; Located in a senior community; Land lease in effect ($800)
Exterior
- Parking: Off-street parking; Attached covered parking (carport); no enclosed garage
- Utilities: Public water; Public sewer; Individual electric meter; Individual gas meter; Cable and internet available
- Home design: Manufactured double-wide home in a park; Built in 1979
- Construction: Composition roof; Manufactured home (Make: Bendix); Skirting: other/unknown
- Exterior features: Patio awning and carport awning; Covered deck/porch with railings; Shed(s) for extra storage
Interior
- Kitchen: Free-standing gas range and oven; Free-standing refrigerator; Hood over range; Dishwasher; Garbage disposal
- Bedrooms: 2 bedrooms (master approx. 11x11, second approx. 10x11)
- Flooring: Carpet; Vinyl
- Bathrooms: 2 full bathrooms with shower stall(s)
- Heating & cooling: Central heating; Central air conditioning
- Interior features: Pantry cabinet and laminate counters in the kitchen; Porch with covered deck, porch steps and railings; Dual-pane partial windows with window coverings; Storage shed(s) on property
- Laundry & utility: Washer and dryer included; Laundry located inside the home (inside room/area); 220V outlet in laundry
Neighborhood map
What this means for you Summary
Snapshot
- This is a 2-bed/2.0-bath manufactured listed at $94k.
Deal economics
- At list price, monthly cash flow is $1k ($14k/yr) — positive.
- The deal already cash-flows at list — no discount required.
- Meets the 1% rule at list price ($2k rent vs $94k).
- Recommended offer: $88k (6.0% below list) — sets the bar for market timing.
- Cap rate 21.0% vs local median 3.6% in Florin — top-decile yield for the area; either an underpriced asset or a hidden risk that comps aren't pricing in. Stress-test before assuming the spread holds.
Location & tenants
- Location reads 58/100 on livability (#673 in CA) — a working-class tenant base; expect higher turnover. Strengths: housing A; Watch: employment D, schools D-, crime F.
- Elk Grove Unified (suburban): math 40% / reading 51% proficiency, ranked #165 of 517 in CA (top 32%) — families likely to look elsewhere, expect single-tenant / working-renter base with shorter leases.
- Market conditions: Rents soft (-0.2%/yr); 212 active listings in the ZIP; 7 comparable units currently listed for rent nearby; rentals leasing fast (median 5d on market — plan ~1-2 weeks tenant-placement turnaround); solid renter incomes; 6,825 units permitted in Sacramento County in 2024 (1,752 in 5+ unit buildings).
- This rent runs 33% of the median local income ($82k/yr) — at the standard rent-burdened threshold; future hikes will face affordability resistance.
Forward outlook
- Local home prices are declining (-3.0%/yr); year-one equity from $650 of loan paydown is wiped out by about $3k of value loss. Plan a longer hold.
- Sacramento County population projected at +17% by 2050 — long-run rental-demand tailwind backs the buy-and-hold thesis.
- At projected returns (-3.0% appreciation + 0.0% rent growth), your $26k cash investment doubles in ~3 years — after that, you're playing with house money.
Negotiation context
- It's been on market 87 days — a 6% lower offer ($88k) is reasonable based on typical stale-listing flexibility.
Risks & watch-outs
- Climate carrying-cost: moderate wildfire risk; extreme-heat days projected 6→12/yr by 2055 (HVAC capex compounding) — expect insurance premiums to compound above CPI over the hold.
Questions for the listing agent
- It's been on market 87 days. Have you received any prior offers? Is the seller open to a 6% concession, seller financing, or rate buy-down credit?
- Built in 1979 — when were the roof, HVAC, electrical panel, plumbing, and water heater last replaced?
- Why hasn't it sold? Are there any deal-killer items the seller is aware of (foundation, flood, title, zoning, code violations)?
- Is there a deadline driving the sale (1031 exchange, divorce, estate, relocation)? That informs how much negotiation room exists.
- Schools are D-rated, which usually means shorter tenancies and higher turnover. Who's the typical renter profile here, and what's been the actual vacancy rate?
- Crime grade is F in this area — have there been break-ins, vandalism, or insurance claims at this property in the last 3 years? What carrier currently insures it and at what premium?
- What's the average days-on-market for RENTAL listings here right now (not sales)? A rising rental-DOM trend means longer vacancies and softer asking-rent achievability than the comps imply.
- What's the recent tenant-quality profile in this submarket — average credit score on applications, eviction rate, late-payment / NSF rate, and stable-employment percentage? A property-management company in the area should have these aggregated.
- How much new for-sale + rental construction is in the pipeline within 1–3 miles? Heavy new supply typically softens prices + rents 12–24 months out; constrained supply supports both.
Investment metrics
- 1% rule
- 2.42% ✓
- Cap rate
- 20.98%
- Cash-on-cash
- 52.45%
- DSCR
- 3.33
- GRM
- 3.4
CMA / ARV
- ARV (on-the-fly)
- $211,968
- Comps found
- 12
Show comp detail 12 sales within ~0.75 mi
| Address | Dist | Beds/Ba | Sqft | Sold | Price | $/sf | Match |
|---|---|---|---|---|---|---|---|
| 131 Hibiscus Ave | 0.00mi | 2/2.0 | 1,152 (0%) | 1mo | $94,000 | $82 | 99 |
| 7 Pina | 0.18mi | 2/2.0 | 1,152 (0%) | 3mo | $96,000 | $83 | 89 |
| 5 Pina St | 0.20mi | 2/2.0 | 1,152 (0%) | 5mo | $108,000 | $94 | 87 |
| 8622 Beauxart Cir #39 | 0.20mi | 2/2.0 | 1,200 (+4%) | 1mo | $270,000 | $225 | 82 |
| 110 Wyndbrook St | 0.29mi | 2/2.0 | 1,152 (0%) | 8mo | $149,900 | $130 | 80 |
| 48 Millbrook Cir | 0.23mi | 2/2.0 | 1,152 (0%) | 13mo | $212,000 | $184 | 79 |
| 143 Lirios Ave | 0.03mi | 2/2.0 | 1,248 (+8%) | 8mo | $122,500 | $98 | 78 |
| 7428 Bouvais Cir | 0.17mi | 2/2.0 | 1,120 (-3%) | 13mo | $285,000 | $254 | 77 |
| 51 Millbrook Cir | 0.26mi | 2/2.0 | 1,248 (+8%) | 1mo | $180,000 | $144 | 73 |
| 7400 Carondelet Ln | 0.24mi | 2/1.0 | 1,040 (-10%) | 12mo | $250,000 | $240 | 58 |
| 8636 Beauxart Cir | 0.27mi | 3/2.0 (+1) | 1,300 (+13%) | 15mo | $290,000 | $223 | 49 |
| 155 Security Ln | 0.32mi | 3/2.0 (+1) | 1,272 (+10%) | 18mo | $255,000 | $200 | 48 |
Match score weights: distance 35% · size 25% · config 20% · recency 20%. Top-matched comps best support the ARV.
Projected returns pro-forma
-3.0% appreciation · 0.0% rent growth · sell at horizon
- IRR
- 47.0%
- Equity multiple
- 2.95×
- Total profit
- $51,398
- Equity at exit
- $14,016
- IRR
- 51.4%
- Equity multiple
- 5.31×
- Total profit
- $113,442
- Equity at exit
- $8,127
Cash invested: $26,320 (down + closing). Projections, not guarantees.
Landlord ↔ Tenant lean methodology
- Overall (STATE)
- 18 Strongly Tenant-Friendly
- State California
- 18 Strongly Tenant-Friendly · D+13
- County
- — inherits STATE
- City
- — inherits STATE
ZIP-level market 95828
- Home prices YoY
- -0.8%
- Rents YoY
- -0.2%
- Active inventory
- 212
- Price-to-rent
- 3.4×
Monthly cashflow live
- Estimated rent
- $2,279 high interval (Pro) →
- Mortgage (P&I)
- −$493
- Tax est. 1.5%
- −$118 /mo · $1,410/yr
- Insurance
- −$39
- HOA
- −$0
- Vacancy / Maint / Mgmt
- −$479
- Net cashflow
- $1,150
Break-even live
UW: 25.0% down · 7.5% · 30yr · 1.5% tax · 5.0% vac · 8.0% maint · 8.0% mgmt
Financing live
Cash to close
- Down payment
- $23,500
- Closing costs
- $2,820
- Reserves months
- —
- Total cash needed
- —
Loan-product check · same deal, 3 products live
Conventional
25% down · 7.5% · 30yr
- Down + closing
- —
- Monthly P&I
- —
- Monthly cashflow
- —
- DSCR
- —
- Eligible?
- —
Personal DTI + credit; lowest rate.
DSCR
20% down · 8.5% · 30yr
- Down + closing
- —
- Monthly P&I
- —
- Monthly cashflow
- —
- DSCR
- —
- Eligible?
- —
No personal income docs; deal must DSCR.
Hard money
10% down · 12.0% · 12mo
- Down + closing
- —
- Monthly P&I
- —
- Monthly cashflow
- —
- DSCR
- —
- Eligible?
- —
Short-term bridge; refi at stabilization.
Rent comps 7 comps
| Address | Beds | Baths | Sqft | Rent | $/sqft | DOM | Units | Dist |
|---|---|---|---|---|---|---|---|---|
| 8550 Florin Rd Sacramento, CA | 1.0–2.0 | 1.0 | 776 | $1,795 | $2.31 | 2d | 16 | 0.67mi |
| 7756 Southbreeze Dr Sacramento, CA | 3.0 | 2.0 | 1302 | $2,395 | $1.84 | 2d | 1 | 0.77mi |
| 8620 Tiogawoods Dr Sacramento, CA | 3.0 | 2.0 | 1137 | $2,750 | $2.42 | 7d | 1 | 0.79mi |
| 7575 Power Inn Rd Sacramento, CA | 1.0–2.0 | 1.0–2.0 | 729 | $1,950 | $2.67 | 1d | 5 | 1.18mi |
| 7351 Gigi Pl Unit 7353 Sacramento, CA | 2.0 | 1.0 | 1000 | $1,775 | $1.77 | 23d | 1 | 1.34mi |
| 7733 Robinette Rd Sacramento, CA | 3.0 | 2.0 | 1120 | $2,150 | $1.92 | 43d | 1 | 1.45mi |
| 8159 Laurel Willow Ln Sacramento, CA | 3.0 | 2.5 | 1214 | $2,396 | $1.97 | 4d | 1 | 1.50mi |
Climate risk First Street
- Flood 1/10 Low FEMA zone X (shaded) · 0% chance over 30 yrs
- Wildfire 5/10 Major
- Heat 7/10 Severe 6 d/yr ≥102°F today · 12 d/yr by 30 yrs out
- Wind 1/10 Low
- Air quality 10/10 Extreme 28 unhealthy d/yr today · 33 by 30 yrs out
Nearby sold comps map
Loading sold comps map…
Walkable amenities ~0.75 mi
Loading nearby amenities…
Taxation est. · year 1
- Rental income
- $27,343
- − Mortgage interest
- −$5,265
- − Property taxes
- −$1,410
- − Insurance
- −$470
- − Repairs & maintenance
- −$2,187
- − Management
- −$2,187
- − Depreciation
- −$2,735
- Taxable income
- $13,088
- Est. tax owed @ 24.0%
- −$3,141
- After-tax cash flow
- $10,664/yr
For passive investors: Depreciation is non-cash, so a rental often shows a tax loss while cash-flowing — sheltering income. Rental losses are passive: they offset passive income freely, and up to $25,000/yr can offset ordinary (W-2) income if you actively participate and your MAGI is under $100k (phasing out to $0 by $150k); unused losses carry forward. On sale, claimed depreciation is recaptured at up to 25%, and gains may owe capital-gains tax (a 1031 exchange can defer both). Figures are a year-1 estimate at your 24.0% rate — not tax advice; consult a CPA.
Schools (NCES district)
- District
- Elk Grove Unified
- NCES district ID
- 0612330
- Math proficiency
- 40% ▼ -5.00%
- Reading proficiency
- 51% ▼ -5.00%
- Median HH income
- $67,860
- Composite
- 40.72/100
- National rank
- #3658
- State rank
- #165 of 517 in CA
Livability — Florin
- Score
- 58/100
- State rank
- #673
- US rank
- #20705
Category grades
Schools grade is shown separately in the Schools card above.
Census & demographics
- Census place
- Florin, CA
- County
- Sacramento County · 1,539,646 people
- City population
- 60,532
- Metro
- Sacramento-Roseville-Folsom, CA
- Population (ZIP)
- 61,686
- Household income
- $81,778
- Rent vs Own
- Severe rent burden
- 1765.0
Population outlook (Sacramento County) Hauer SSP2
- Today (2025)
- 1,660,763 people
- By 2030
- 1,732,990 · +4.3%
- By 2040
- 1,855,755 · +11.7%
- By 2050
- 1,941,335 · +16.9%
- By 2075
- 2,046,162 · +23.2%
- By 2100
- 1,961,444 · +18.1%
Race, ethnicity, and origin ACS 2023
- Neighborhood character
- Highly diverse neighborhood (Simpson 0.75)
- Race & ethnicity
- Asian 37% Hispanic / Latino 26% White 16% Two or more races 12% Black 10% Pacific Islander 4%
- Hispanic origin (detail)
- Mexican 22%
- Common ancestry
- Italian 1% Russian 1% Portuguese 1%
- Foreign-born
- 35% · Vietnam, Canada, China
- Languages at home
- 47% English-only · Spanish 17% Other Asian/Pacific 13% Vietnamese 8%
Political lean MEDSL · Sacramento
- 2024 margin
- D (+19.7) · D 58.1% · R 38.4% · Other 3.5%
- 2008→2024 swing
- +0.7pp no change · 2008: 19.0pp · 2024: 19.7pp
- All cycles
- 2024: D+19.7 2020: D+25.3 2016: D+23.7 2012: D+16.3 2008: D+19.0
Not yet ingested
- Civics
- —
Market trends
- HPI YoY
- ▼ -7.49%
- Current HPI
- 962.47
- Rent YoY
- ▼ -0.24%
- Metro
- Sacramento-Roseville-Folsom, CA
- State GDP YoY
- ▲ 3.21%
- F500 in state
- 116
Industry mix (Fortune 500 HQ in CA)
| Industry | F500 HQs | Revenue |
|---|---|---|
| Technology | 27 | $1,492B |
|
||
| Financial Services | 3 | $174B |
|
||
| Retail | 3 | $44B |
|
||
| Insurance | 3 | $26B |
|
||
| Media / Entertainment | 2 | $115B |
|
||
| Pharmaceuticals / Biotech | 2 | $62B |
|
||
Cash-flow waterfall
monthlySold comps — $/sqft
last 12 mo · ≤1 miLoading sold comps…