33-47 14th St Unit 6C · New York, NY
Flood risk 1/10 · Minimal
- FEMA flood zone
- X (unshaded)
- Chance of flooding over 30 yrs
- 0.0%
- Est. flood insurance / yr
- $507 – $1,088
Fire risk 1/10 · Minimal
- Est. fire insurance / yr
- $691 – $1,283
Heat risk 6/10 · Moderate
- Hot days now (above 99°F)
- 7 days/yr
- Hot days in 30 yrs
- 15 days/yr
Wind risk 6/10 · Moderate
- Chance of severe wind over 30 yrs
- 27.0%
Air-quality risk 4/10 · Minor
- Unhealthy air days now
- 5 days/yr
- Unhealthy air days in 30 yrs
- 6 days/yr
Risk factors via First Street. Map © Google.
Why this score? — see what drove the C grade
The composite is a weighted blend of 9 inputs, each scored 0–100. Each bar is that input's sub-score; the figure is the points it added to the 100-point composite (weight × sub-score).
- Cash flow +17.2/30.0
- ARV discount +7.5/15.0
- Appreciation +6.0/10.0
- DSCR +5.3/10.0
- Schools +5.0/10.0
- 1% rule +4.6/10.0
- Rent growth +4.3/5.0
- Livability +3.8/5.0
- Condition / age +2.5/5.0
$699,000
🖨 Deal sheet 📄 Offer letter ✓ Due diligence
Listing remarks
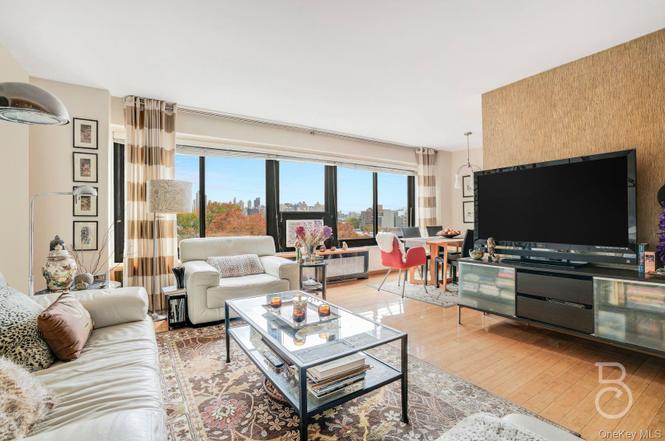
A Sophisticated Corner Residence with Skyline Views Bathed in natural light and framed by sweeping views of Manhattan, this elegantly updated three-bedroom, one-and-a-half-bath residence embodies the best of contemporary Astoria living. Every element has been carefully curated, balancing thoughtful design with intelligent functionality. The open living space features warm bamboo floors, custom radiator covers with concealed storage, and bespoke built-ins that reflect a deep appreciation for craftsmanship. The kitchen—anchored by sleek stainless-steel appliances and beautifully tailored cabinetry—offers exceptional storage and a refined sense of order. Both bathrooms exude indiv
Key facts
- Skyline views
- Natural light
- Open living space
Tags
Neighborhood map
What this means for you Summary
Snapshot
- This is a 3-bed/1.5-bath condo listed at $699k.
Deal economics
- At list price, monthly cash flow is $494 ($6k/yr) — positive.
- The deal already cash-flows at list — no discount required.
- To meet the 1% rule (rent ≥ 1% of price), the offer needs to be $674k (3.6% below list).
- Recommended offer: $657k (6.0% below list) — sets the bar for market timing.
- Cap rate 7.1% vs local median 2.6% in New York — top-decile yield for the area; either an underpriced asset or a hidden risk that comps aren't pricing in. Stress-test before assuming the spread holds.
Location & tenants
- Location reads 75/100 on livability (#268 in NY, #4,188 nationally) — a middle-class / working-renter tenant base. Strengths: amenities A+, commute A+, health & safety A; Watch: crime F, cost of living F.
- Market conditions: Rents rising fast (+7.3%/yr); 106 active listings in the ZIP; 31 comparable units currently listed for rent nearby; rentals leasing fast (median 11d on market — plan ~1-2 weeks tenant-placement turnaround); solid renter incomes; 5,302 units permitted in Queens County in 2024 (4,918 in 5+ unit buildings).
- At $6,740/mo this rent would consume 95% of the median local household income ($85k/yr) (locally 3679% of renters already pay >50% of income on rent) — very limited rent-growth headroom before tenants either downsize or default.
Forward outlook
- In year one you build about $19k of equity ($5k loan paydown + $14k appreciation (2.1% local appreciation)).
- Queens County population projected at +16% by 2050 — long-run rental-demand tailwind backs the buy-and-hold thesis.
- At projected returns (2.1% appreciation + 7.3% rent growth), your $196k cash investment doubles in ~6 years — after that, you're playing with house money.
- By year 3, paydown + projected appreciation supports a ~$49k cash-out refi (75% LTV) — recoverable capital for the next deal without selling this one.
Negotiation context
- It's been on market 77 days — a 6% lower offer ($657k) is reasonable based on typical stale-listing flexibility.
- 4 sale attempts since 8y ago with the ask held roughly flat each time — persistent listings suggest the price (not the market) is what's stuck; bring a comps-based counter.
Risks & watch-outs
- Watch-outs: built in 1958 — expect roof / HVAC / electrical / plumbing capex.
- Climate carrying-cost: major wind risk, 27% chance of damaging wind over 30y; extreme-heat days projected 7→15/yr by 2055 (HVAC capex compounding) — expect insurance premiums to compound above CPI over the hold.
Questions for the listing agent
- It's been on market 77 days. Have you received any prior offers? Is the seller open to a 6% concession, seller financing, or rate buy-down credit?
- Built in 1958 — when were the roof, HVAC, electrical panel, plumbing, and water heater last replaced?
- Any open or pending special assessments — roof, HVAC, plumbing, elevator, façade? What's the per-unit balance and payoff schedule, and is the seller paying it off at close or rolling it to the buyer?
- Why hasn't it sold? Are there any deal-killer items the seller is aware of (foundation, flood, title, zoning, code violations)?
- Is there a deadline driving the sale (1031 exchange, divorce, estate, relocation)? That informs how much negotiation room exists.
- Schools are B-rated — typically a magnet for longer-tenancy family renters. What's the average tenant stay here, and is there a school-zone premium baked into asking?
- Crime grade is F in this area — have there been break-ins, vandalism, or insurance claims at this property in the last 3 years? What carrier currently insures it and at what premium?
- What's the average days-on-market for RENTAL listings here right now (not sales)? A rising rental-DOM trend means longer vacancies and softer asking-rent achievability than the comps imply.
- What's the recent tenant-quality profile in this submarket — average credit score on applications, eviction rate, late-payment / NSF rate, and stable-employment percentage? A property-management company in the area should have these aggregated.
- How much new apartment / multifamily construction is in the pipeline within 1–3 miles? Heavy new supply (>2% of stock underway) typically softens rents 12–24 months out; light construction supports rent growth.
Investment metrics
- 1% rule
- 0.96% ✗
- Cap rate
- 7.14%
- Cash-on-cash
- 3.03%
- DSCR
- 1.13
- GRM
- 8.6
CMA / ARV
No comps found within radius.
Projected returns pro-forma
2.06% appreciation · 7.28% rent growth · sell at horizon
- IRR
- 10.3%
- Equity multiple
- 1.57×
- Total profit
- $112,025
- Equity at exit
- $278,137
- IRR
- 15.6%
- Equity multiple
- 3.32×
- Total profit
- $453,244
- Equity at exit
- $402,399
Cash invested: $195,720 (down + closing). Projections, not guarantees.
Landlord ↔ Tenant lean methodology
- Overall (CITY)
- 0 Strongly Tenant-Friendly
- State New York
- 15 Strongly Tenant-Friendly · D+10
- County
- — inherits STATE
- City New York
- 0 Strongly Tenant-Friendly · D+34
ZIP-level market 11106
- Home prices YoY
- 0.6%
- Rents YoY
- 7.3%
- Active inventory
- 106
- Price-to-rent
- 8.6×
Monthly cashflow live
- Estimated rent
- $6,740 high interval (Pro) →
- Mortgage (P&I)
- −$3,666
- Tax est. 1.5%
- −$874 /mo · $10,485/yr
- Insurance
- −$291
- HOA
- −$0
- Vacancy / Maint / Mgmt
- −$1,415
- Net cashflow
- $494
Break-even live
UW: 25.0% down · 7.5% · 30yr · 1.5% tax · 5.0% vac · 8.0% maint · 8.0% mgmt
Financing live
Cash to close
- Down payment
- $174,750
- Closing costs
- $20,970
- Reserves months
- —
- Total cash needed
- —
Loan-product check · same deal, 3 products live
Conventional
25% down · 7.5% · 30yr
- Down + closing
- —
- Monthly P&I
- —
- Monthly cashflow
- —
- DSCR
- —
- Eligible?
- —
Personal DTI + credit; lowest rate.
DSCR
20% down · 8.5% · 30yr
- Down + closing
- —
- Monthly P&I
- —
- Monthly cashflow
- —
- DSCR
- —
- Eligible?
- —
No personal income docs; deal must DSCR.
Hard money
10% down · 12.0% · 12mo
- Down + closing
- —
- Monthly P&I
- —
- Monthly cashflow
- —
- DSCR
- —
- Eligible?
- —
Short-term bridge; refi at stabilization.
Rent comps 31 comps
| Address | Beds | Baths | Sqft | Rent | $/sqft | DOM | Units | Dist |
|---|---|---|---|---|---|---|---|---|
| 888 Main St New York, NY | 1.0–3.0 | 1.0–2.0 | 963 | $7,375 | $7.66 | 6d | 7 | 0.61mi |
| 3705 30th St Long Island City, NY | 2.0 | 1.0–2.0 | 700 | $6,180 | $8.83 | 10d | 3 | 0.63mi |
| 1420 27th Ave Astoria, NY | 1.0–2.0 | 1.0–2.0 | 887 | $4,899 | $5.52 | 3d | 9 | 0.67mi |
| 4126 27th St Unit 6D Long Island City, NY | 2.0 | 2.0 | 1203 | $4,990 | $4.15 | 24d | 1 | 0.92mi |
| 30-37 38th St Unit 4 Astoria, NY | 3.0 | 2.0 | 1200 | $5,200 | $4.33 | 13d | 1 | 0.93mi |
| 501 E 74th St #1572 New York, NY | 2.0 | 2.0 | 1000 | $10,210 | $10.21 | 20d | 1 | 1.02mi |
| 435 E 79th St New York, NY | 1.0–3.0 | 1.0–2.0 | 943 | $9,500 | $10.07 | 7d | 3 | 1.03mi |
| 1567 York Ave Unit 1021866P New York, NY | 2.0 | 1.0 | 742 | $5,910 | $7.96 | 22d | 1 | 1.05mi |
| 509 E 87th St Apt 4B New York, NY | 4.0 | 2.0 | 900 | $7,150 | $7.94 | 22d | 1 | 1.06mi |
| 34-35 44th St Astoria, NY | 1.0–2.0 | 1.0–2.0 | 613 | $5,794 | $9.45 | 1d | 26 | 1.07mi |
| 404 E 76th St Unit 19C New York, NY | 2.0 | 2.0 | 1100 | $7,500 | $6.82 | 24d | 1 | 1.12mi |
| 404 E 76th St New York, NY | 1.0–2.0 | 1.0–2.0 | 1001 | $7,500 | $7.49 | 4d | 2 | 1.13mi |
| 885 Main St #705 New York, NY | 2.0 | 2.0 | 1100 | $4,950 | $4.50 | 24d | 1 | 1.20mi |
| 885 Main St Unit 6B New York, NY | 2.0 | 2.0 | 950 | $5,320 | $5.60 | 12d | 1 | 1.20mi |
| 403 E 69th St #1518 New York, NY | 1.0–3.0 | 1.0 | 745 | $9,507 | $12.76 | 24d | 3 | 1.20mi |
| 411 E 68th St Unit 1021976P New York, NY | 2.0 | 1.0 | 893 | $6,792 | $7.61 | 22d | 1 | 1.22mi |
| 1290 1st Ave #1499 New York, NY | 2.0 | 1.0 | 671 | $6,100 | $9.09 | 2d | 2 | 1.22mi |
| 3 Court Sq W #907 Long Island City, NY | 2.0 | 2.0 | 930 | $6,300 | $6.77 | 24d | 1 | 1.24mi |
| 400 E 66th St Unit 1016404P New York, NY | 1.0–2.0 | 1.0–2.0 | 791 | $17,070 | $21.58 | 3d | 2 | 1.29mi |
| 255 E 77th St Unit 12B New York, NY | 2.0 | 2.5 | 1475 | $17,500 | $11.86 | 17d | 1 | 1.30mi |
| 1435 2nd Ave Unit 1021957P New York, NY | 3.0 | 2.0 | 1194 | $7,740 | $6.48 | 12d | 1 | 1.31mi |
| 305 E 86th St New York, NY | 1.0–3.0 | 1.0–2.0 | 820 | $14,500 | $17.67 | 24d | 10 | 1.31mi |
| 354 E 91st St #648 New York, NY | 1.0–2.0 | 1.0 | 692 | $6,840 | $9.88 | 1d | 2 | 1.32mi |
| 360 E 65th St #1283 New York, NY | 1.0–3.0 | 1.0–2.0 | 1059 | $8,790 | $8.30 | 3d | 3 | 1.34mi |
| 300 E 69th St Unit 1294661P New York, NY | 2.0 | 1.0 | 839 | $6,870 | $8.19 | 20d | 1 | 1.35mi |
| 1310 2nd Ave Unit 1224958P New York, NY | 1.0–2.0 | 1.0 | 699 | $8,460 | $12.10 | 1d | 2 | 1.36mi |
| 244 E 86th St #604 New York, NY | 1.0–2.0 | 1.0–2.0 | 950 | $9,640 | $10.15 | 3d | 2 | 1.36mi |
| 200 E 82nd St #505 New York, NY | 2.0 | 1.0 | 636 | $7,960 | $12.51 | 1d | 3 | 1.40mi |
| 345 E 94th St #1470 New York, NY | 2.0 | 1.0–2.0 | 710 | $7,570 | $10.65 | 3d | 3 | 1.41mi |
| 201 E 86th St #298 New York, NY | 1.0–2.0 | 1.0–1.5 | 700 | $10,010 | $14.30 | 3d | 2 | 1.46mi |
| 301 E 63rd St New York, NY | 2.0 | 1.0 | 975 | $6,650 | $6.82 | 4d | 1 | 1.48mi |
HOA detail condo
- Monthly dues
- $0 · $0/yr
- Assessments
- None detected in remarks — confirm with the listing agent.
Listing history 7 events
-
2026-01-22status Pending
-
2025-11-06$699,000 Active
-
2025-11-06$699,000 Active
-
2018-12-01historical
-
2018-05-08price $789,000
-
2018-04-05$795,000 New
-
2018-04-04$789,000
ⓘ Source: listings_history table (triggers on properties + properties_extension) + one-shot
backfill from property_details.listing_events for pre-trigger history.
Climate risk First Street
- Flood 1/10 Low FEMA zone X (unshaded) · 0% chance over 30 yrs
- Wildfire 1/10 Low
- Heat 6/10 Major 7 d/yr ≥99°F today · 15 d/yr by 30 yrs out
- Wind 6/10 Major 27% chance of damaging wind over 30 yrs
- Air quality 4/10 Moderate 5 unhealthy d/yr today · 6 by 30 yrs out
Nearby sold comps map
Loading sold comps map…
Walkable amenities ~0.75 mi
Loading nearby amenities…
Taxation est. · year 1
- Rental income
- $80,875
- − Mortgage interest
- −$39,155
- − Property taxes
- −$10,485
- − Insurance
- −$3,495
- − Repairs & maintenance
- −$6,470
- − Management
- −$6,470
- − Depreciation
- −$20,335
- Taxable loss
- −$5,535
- Est. tax savings @ 24.0%
- +$1,328
- After-tax cash flow
- $7,252/yr
For passive investors: Depreciation is non-cash, so a rental often shows a tax loss while cash-flowing — sheltering income. Rental losses are passive: they offset passive income freely, and up to $25,000/yr can offset ordinary (W-2) income if you actively participate and your MAGI is under $100k (phasing out to $0 by $150k); unused losses carry forward. On sale, claimed depreciation is recaptured at up to 25%, and gains may owe capital-gains tax (a 1031 exchange can defer both). Figures are a year-1 estimate at your 24.0% rate — not tax advice; consult a CPA.
Schools (NCES district)
No district data.
Livability — New York
- Score
- 75/100
- State rank
- #268
- US rank
- #4188
Category grades
Schools grade is shown separately in the Schools card above.
Census & demographics
- Census place
- New York, NY
- County
- Queens County · 1,914,869 people
- City population
- 7,731,280
- Metro
- New York-Newark-Jersey City, NY-NJ-PA
- Population (ZIP)
- 40,930
- Household income
- $84,867
- Rent vs Own
- Severe rent burden
- 3679.0
Population outlook (Queens County) Hauer SSP2
- Today (2025)
- 2,546,320 people
- By 2030
- 2,643,059 · +3.8%
- By 2040
- 2,815,563 · +10.6%
- By 2050
- 2,944,423 · +15.6%
- By 2075
- 3,123,338 · +22.7%
- By 2100
- 3,098,688 · +21.7%
Race, ethnicity, and origin ACS 2023
- Neighborhood character
- Highly diverse neighborhood (Simpson 0.71)
- Race & ethnicity
- White 42% Hispanic / Latino 27% Asian 19% Two or more races 12% Black 7% Native American 1%
- Hispanic origin (detail)
- Mexican 7% Puerto Rican 6% Dominican 4%
- Common ancestry
- Scotch-Irish 3% Romanian 3% Estonian 2%
- Foreign-born
- 39% · Canada, Jamaica, China
- Languages at home
- 48% English-only · Spanish 22% Other Indo-European 13% Russian/Polish/Slavic 4%
Political lean MEDSL · Queens
- 2024 margin
- Strong D (+24.6) · D 62.3% · R 37.7%
- 2008→2024 swing
- -26.2pp toward R · 2008: 50.8pp · 2024: 24.6pp
- All cycles
- 2024: D+24.6 2020: D+45.2 2016: D+53.4 2012: D+58.5 2008: D+50.8
Not yet ingested
- Civics
- —
Market trends
- HPI YoY
- ▲ 2.06%
- Current HPI
- 348.3009
- Rent YoY
- ▲ 7.28%
- Metro
- New York-Newark-Jersey City, NY-NJ-PA
- State GDP YoY
- ▲ 2.60%
- F500 in state
- 92
Industry mix (Fortune 500 HQ in NY)
| Industry | F500 HQs | Revenue |
|---|---|---|
| Financial Services | 10 | $950B |
|
||
| Consumer Goods | 9 | $162B |
|
||
| Insurance | 4 | $225B |
|
||
| Telecommunications | 2 | $144B |
|
||
| Pharmaceuticals | 2 | $112B |
|
||
| Media / Entertainment | 2 | $69B |
|
||
Price history
-11.4% since first listed7 events — show timeline
- 2026-01-22 Pending — OneKey® MLS as Distributed by MLS Grid
- 2025-11-06 Listed $699,000 OneKey® MLS as Distributed by MLS Grid
- 2025-11-06 Listed $699,000 RLS at REBNY
- 2018-12-01 Listing Removed — OneKey® MLS as Distributed by MLS Grid
- 2018-05-08 Price Changed $789,000 OneKey® MLS as Distributed by MLS Grid
- 2018-04-05 Listed $795,000 OneKey® MLS as Distributed by MLS Grid
- 2018-04-04 Listed $789,000 RLS at REBNY
Cash-flow waterfall
monthlySold comps — $/sqft
last 12 mo · ≤1 miLoading sold comps…