 Multi-family
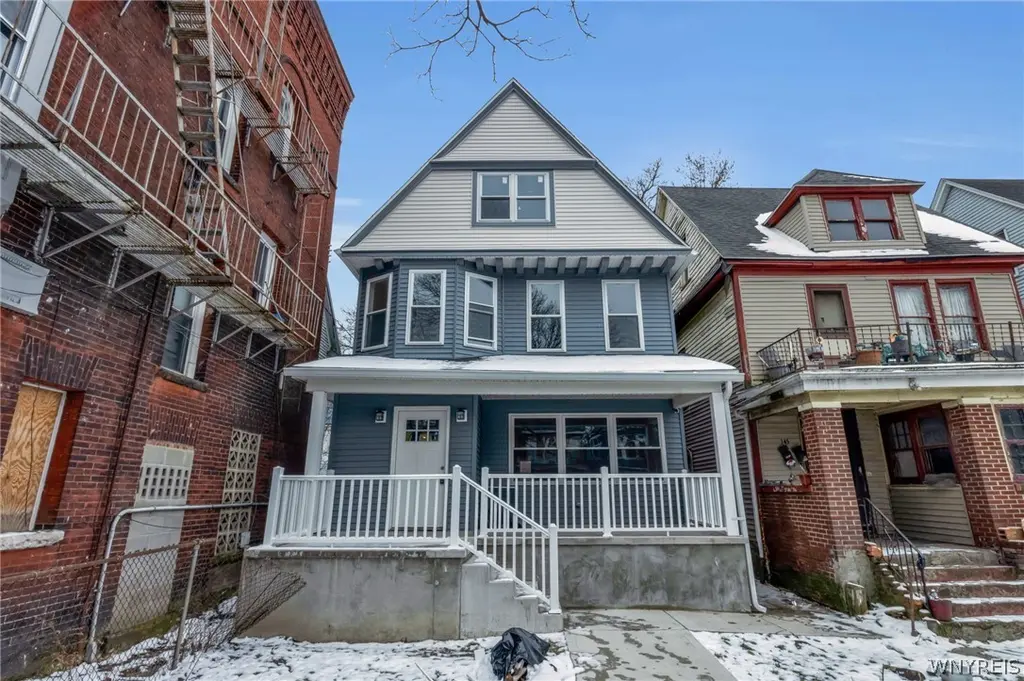
149 Northland Ave · Buffalo, NY
Flood risk 3/10 · Minor
- FEMA flood zone
- X (unshaded)
- Chance of flooding over 30 yrs
- 0.1%
- Est. flood insurance / yr
- $473 – $860
Fire risk 1/10 · Minimal
- Est. fire insurance / yr
- $691 – $1,283
Heat risk 3/10 · Minor
- Hot days now (above 91°F)
- 7 days/yr
- Hot days in 30 yrs
- 15 days/yr
Wind risk 1/10 · Minimal
- Chance of severe wind over 30 yrs
- —
Air-quality risk 4/10 · Minor
- Unhealthy air days now
- 4 days/yr
- Unhealthy air days in 30 yrs
- 9 days/yr
Risk factors via First Street. Map © Google.
Why this score? — see what drove the B- grade
The composite is a weighted blend of 9 inputs, each scored 0–100. Each bar is that input's sub-score; the figure is the points it added to the 100-point composite (weight × sub-score).
- Cash flow +25.7/30.0
- ARV discount +15.0/15.0
- DSCR +8.6/10.0
- 1% rule +6.8/10.0
- Livability +3.9/5.0
- Schools +3.3/10.0
- Rent growth +2.5/5.0
- Condition / age +2.5/5.0
- Appreciation +0.0/10.0
$265,000
🖨 Deal sheet 📄 Offer letter ✓ Due diligence
Multi-family units
County records classify this as Multi-Family (2-4 Unit). Listing-text estimate: 1 unit. estimate disagrees with records
Listing remarks
Space, scale, and historic charm collide at 149 Northland Avenue, a 1,936 sq. ft. 2/2 double located in the heart of Buffalo’s sought-after Hamlin Park Historic District. Each unit features 2 rooms, generous living areas, and room to customize or maximize rental income. Luxury vinyl plank floors in common areas, carpeted bedrooms, dry wall walls and ceiling, LED lighting throughout and everything in between has been renovated. PEX and PVC was ran throughout and high efficiency hot water tanks and furnaces in the basement. Whether you’re looking to owner-occupy, expand your portfolio, or preserve a piece of Buffalo history, this property delivers the square footage and location t
Key facts
- 2,511 sq ft lot
- Built 1900
- Listed 45 days
Property features AI
Finance
- Financial info: Tenant pays all utilities; Operating expense details: See remarks
Exterior
- Parking: Concrete parking
- Security: Owned security system
- Utilities: Public water connected; Sewer connected; Electric with circuit breakers
- Home design: Two-story building; Resale property; City street frontage; Located in a historic district; Rectangular residential lot (27 x 93)
- Construction: Vinyl siding; Asphalt roof; Block foundation; Copper and PEX plumbing; Existing (previously built) structure
- Exterior features: Deck; Open porch
Interior
- Kitchen: Dishwasher in one unit
- Bedrooms: Two 1-bedroom units (each with a dining area combined with the living room)
- Flooring: Laminate; Luxury vinyl; Varied flooring types
- Bathrooms: Two full bathrooms (one per unit)
- Heating & cooling: Gas forced-air heating
- Interior features: Ceiling fan(s)
- Laundry & utility: Washer hookup; Gas water heater
Neighborhood map
What this means for you Summary
Snapshot
- This is a 4-bed/2.0-bath multifamily listed at $265k.
Deal economics
- At list price, monthly cash flow is $633 ($8k/yr) — positive.
- The deal already cash-flows at list — no discount required.
- Meets the 1% rule at list price ($3k rent vs $265k).
- Recommended offer: $257k (3.0% below list) — sets the bar for market timing.
Location & tenants
- Location reads 77/100 on livability (#195 in NY, #3,011 nationally) — a middle-class / working-renter tenant base. Strengths: commute A+, housing A+, health & safety A+; Watch: crime F, employment D-.
- Buffalo City School District (urban): math 41% / reading 40% proficiency, ranked #535 of 590 in NY (top 91%) — families likely to look elsewhere, expect single-tenant / working-renter base with shorter leases; 75% free/reduced lunch — lower-income household profile, screen leases tightly.
- Market conditions: 54 active listings in the ZIP; 9 comparable units currently listed for rent nearby; rentals at typical pace (median 20d on market — plan ~3-4 weeks tenant-placement turnaround); 1,244 units permitted in Erie County in 2024 (563 in 5+ unit buildings).
- At $3,120/mo this rent would consume 77% of the median local household income ($48k/yr) (locally 723% of renters already pay >50% of income on rent) — very limited rent-growth headroom before tenants either downsize or default.
Forward outlook
- Local home prices are declining (-3.0%/yr); year-one equity from $2k of loan paydown is wiped out by about $8k of value loss. Plan a longer hold.
Negotiation context
- It's been on market 45 days — a 3% lower offer ($257k) is reasonable based on typical stale-listing flexibility.
- Current owner paid $3k; list at $265k implies a 9715% gain — meaningful room to come down on a strong offer.
Risks & watch-outs
- Watch-outs: built in 1900 — expect roof / HVAC / electrical / plumbing capex.
Questions for the listing agent
- It's been on market 45 days. Have you received any prior offers? Is the seller open to a 3% concession, seller financing, or rate buy-down credit?
- Built in 1900 — when were the roof, HVAC, electrical panel, plumbing, and water heater last replaced?
- Is there a deadline driving the sale (1031 exchange, divorce, estate, relocation)? That informs how much negotiation room exists.
- Crime grade is F in this area — have there been break-ins, vandalism, or insurance claims at this property in the last 3 years? What carrier currently insures it and at what premium?
- What's the average days-on-market for RENTAL listings here right now (not sales)? A rising rental-DOM trend means longer vacancies and softer asking-rent achievability than the comps imply.
- What's the recent tenant-quality profile in this submarket — average credit score on applications, eviction rate, late-payment / NSF rate, and stable-employment percentage? A property-management company in the area should have these aggregated.
- How much new apartment / multifamily construction is in the pipeline within 1–3 miles? Heavy new supply (>2% of stock underway) typically softens rents 12–24 months out; light construction supports rent growth.
Investment metrics
- 1% rule
- 1.18% ✓
- Cap rate
- 9.16%
- Cash-on-cash
- 10.24%
- DSCR
- 1.46
- GRM
- 7.1
CMA / ARV
- ARV (median comp)
- $382,697
- List price
- $265,000
- Delta
- -30.75%
- Verdict
- UNDERPRICED
- Comps
- 20 within 1.0 mi
Show comp detail 12 sales within ~0.75 mi
| Address | Dist | Beds/Ba | Sqft | Sold | Price | $/sf | Match |
|---|---|---|---|---|---|---|---|
| 1602 Jefferson Ave | 0.02mi | 5/2.0 (+1) | 1,936 (0%) | 8mo | $290,000 | $150 | 88 |
| 1034 Lafayette Ave | 0.30mi | 4/2.0 | 1,910 (-1%) | 12mo | $281,034 | $147 | 73 |
| 244 Purdy St | 0.20mi | 4/2.0 | 2,026 (+5%) | 12mo | $145,000 | $72 | 73 |
| 65 Waverly St | 0.37mi | 4/2.0 | 2,005 (+4%) | 17mo | $90,000 | $45 | 62 |
| 24 Winslow Ave | 0.42mi | 5/2.0 (+1) | 2,024 (+4%) | 7mo | $220,000 | $109 | 62 |
| 48 Glenwood Ave | 0.64mi | 5/2.0 (+1) | 1,879 (-3%) | 2mo | $192,000 | $102 | 58 |
| 469 Woodlawn Ave | 0.52mi | 4/2.0 | 2,120 (+10%) | 6mo | $250,000 | $118 | 55 |
| 45 Daisy Pl | 0.49mi | 5/3.0 (+1) | 1,784 (-8%) | 6mo | $165,000 | $92 | 49 |
| 494 Riley St | 0.74mi | 4/2.0 | 2,145 (+11%) | 2mo | $175,000 | $82 | 46 |
| 81 Lark St | 0.64mi | 5/2.0 (+1) | 1,824 (-6%) | 14mo | $150,000 | $82 | 44 |
| 2170 Main St | 0.74mi | 4/2.0 | 1,816 (-6%) | 15mo | $299,999 | $165 | 42 |
| 64 Sidney St | 0.71mi | 4/2.0 | 1,728 (-11%) | 12mo | $65,000 | $38 | 39 |
Match score weights: distance 35% · size 25% · config 20% · recency 20%. Top-matched comps best support the ARV.
Projected returns pro-forma
-3.0% appreciation · 3.0% rent growth · sell at horizon
- IRR
- -0.9%
- Equity multiple
- 0.97×
- Total profit
- $-2,550
- Equity at exit
- $39,512
- IRR
- 8.8%
- Equity multiple
- 1.67×
- Total profit
- $49,921
- Equity at exit
- $22,912
Cash invested: $74,200 (down + closing). Projections, not guarantees.
Landlord ↔ Tenant lean methodology
- Overall (STATE)
- 15 Strongly Tenant-Friendly
- State New York
- 15 Strongly Tenant-Friendly · D+10
- County
- — inherits STATE
- City
- — inherits STATE
ZIP-level market 14208
- Home prices YoY
- -3.4%
- Active inventory
- 54
- Price-to-rent
- 14.2×
Monthly cashflow live
- Estimated rent
- $3,120 high interval (Pro) →
- Mortgage (P&I)
- −$1,390
- Tax est. 1.5%
- −$331 /mo · $3,975/yr
- Insurance
- −$110
- HOA
- −$0
- Vacancy / Maint / Mgmt
- −$655
- Net cashflow
- $633
Break-even live
2-unit breakdown (identical units grouped — click to expand)
| Units | Beds | Baths | Est. rent |
|---|---|---|---|
| 2× units | 2 | 1 | $3,120 |
| #1 | 2 | 1 | $1,560 |
| #2 | 2 | 1 | $1,560 |
| Total (2 units) | $3,120 | ||
UW: 25.0% down · 7.5% · 30yr · 1.5% tax · 5.0% vac · 8.0% maint · 8.0% mgmt
Financing live
Cash to close
- Down payment
- $66,250
- Closing costs
- $7,950
- Reserves months
- —
- Total cash needed
- —
Loan-product check · same deal, 3 products live
Conventional
25% down · 7.5% · 30yr
- Down + closing
- —
- Monthly P&I
- —
- Monthly cashflow
- —
- DSCR
- —
- Eligible?
- —
Personal DTI + credit; lowest rate.
DSCR
20% down · 8.5% · 30yr
- Down + closing
- —
- Monthly P&I
- —
- Monthly cashflow
- —
- DSCR
- —
- Eligible?
- —
No personal income docs; deal must DSCR.
Hard money
10% down · 12.0% · 12mo
- Down + closing
- —
- Monthly P&I
- —
- Monthly cashflow
- —
- DSCR
- —
- Eligible?
- —
Short-term bridge; refi at stabilization.
Rent comps 9 comps
| Address | Beds | Baths | Sqft | Rent | $/sqft | DOM | Units | Dist |
|---|---|---|---|---|---|---|---|---|
| 102 Florida St Buffalo, NY | 3.0 | 1.0 | 1296 | $1,650 | $1.27 | 43d | 1 | 0.12mi |
| 184 Butler Ave Unit 1545840P Buffalo, NY | 4.0 | 1.0 | 1496 | $3,226 | $2.16 | 14d | 1 | 0.48mi |
| 563 Humboldt Pkwy Buffalo, NY | 3.0 | 1.0 | 2004 | $1,200 | $0.60 | 23d | 1 | 0.51mi |
| 73 Inter Park Ave Buffalo, NY | 3.0 | 1.0 | 2080 | $1,300 | $0.62 | 14d | 1 | 0.74mi |
| 740 Elmwood Ave Buffalo, NY | 3.0 | 1.0 | 2000 | $1,995 | $1.00 | 14d | 1 | 1.19mi |
| 202 Summit Ave Unit 1 Buffalo, NY | 3.0 | 1.0 | 2000 | $2,400 | $1.20 | 23d | 1 | 1.41mi |
| 330 Bryant St Buffalo, NY | 3.0 | 2.0 | 2224 | $2,200 | $0.99 | 19d | 1 | 1.46mi |
| 836 Richmond Ave Buffalo, NY | 4.0 | 3.5 | 1982 | $4,500 | $2.27 | 43d | 1 | 1.47mi |
| 118 Ashland Ave Buffalo, NY | 3.0 | 1.0 | 1326 | $1,850 | $1.40 | 14d | 1 | 1.48mi |
Listing history 16 events
-
2026-06-18days on market $265,000 Active 45 DOM
-
2026-06-17days on market $265,000 Active 44 DOM
-
2026-06-16days on market $265,000 Active 43 DOM
-
2026-06-15days on market $265,000 Active 42 DOM
-
2026-06-13days on market $265,000 Active 40 DOM
-
2026-06-13days on market $265,000 Active 39 DOM
-
2026-06-10days on market $265,000 Active 37 DOM
-
2026-06-09days on market $265,000 Active 36 DOM
-
2026-06-08days on market $265,000 Active 35 DOM
-
2026-06-07days on market $265,000 Active 34 DOM
-
2026-06-03days on market $265,000 Active 30 DOM
-
2026-06-02days on market $265,000 Active 29 DOM
-
2026-06-01days on market $265,000 Active 28 DOM
-
2026-05-31days on market $265,000 Active 27 DOM
-
2026-05-04$265,000 Active 1133-char remark
-
2022-08-03soldstatus $2,700
ⓘ Source: listings_history table (triggers on properties + properties_extension) + one-shot
backfill from property_details.listing_events for pre-trigger history.
Climate risk First Street
- Flood 3/10 Moderate FEMA zone X (unshaded) · 10% chance over 30 yrs
- Wildfire 1/10 Low
- Heat 3/10 Moderate 7 d/yr ≥91°F today · 15 d/yr by 30 yrs out
- Wind 1/10 Low
- Air quality 4/10 Moderate 4 unhealthy d/yr today · 9 by 30 yrs out
Nearby sold comps map
Loading sold comps map…
Walkable amenities ~0.75 mi
Loading nearby amenities…
Taxation est. · year 1
- Rental income
- $37,440
- − Mortgage interest
- −$14,844
- − Property taxes
- −$3,975
- − Insurance
- −$1,325
- − Repairs & maintenance
- −$2,995
- − Management
- −$2,995
- − Depreciation
- −$7,709
- Taxable income
- $3,596
- Est. tax owed @ 24.0%
- −$863
- After-tax cash flow
- $6,738/yr
For passive investors: Depreciation is non-cash, so a rental often shows a tax loss while cash-flowing — sheltering income. Rental losses are passive: they offset passive income freely, and up to $25,000/yr can offset ordinary (W-2) income if you actively participate and your MAGI is under $100k (phasing out to $0 by $150k); unused losses carry forward. On sale, claimed depreciation is recaptured at up to 25%, and gains may owe capital-gains tax (a 1031 exchange can defer both). Figures are a year-1 estimate at your 24.0% rate — not tax advice; consult a CPA.
Schools (NCES district)
- District
- Buffalo City School District
- NCES district ID
- 3605850
- Math proficiency
- 41% ▲ 11.00%
- Reading proficiency
- 40% ▲ 7.00%
- Median HH income
- $31,665
- Composite
- 33.17/100
- National rank
- #5544
- State rank
- #535 of 590 in NY
Livability — Buffalo
- Score
- 77/100
- State rank
- #195
- US rank
- #3011
Category grades
Schools grade is shown separately in the Schools card above.
Census & demographics
- Census place
- Buffalo, NY
- County
- Erie County · 714,559 people
- City population
- 440,021
- Metro
- Buffalo-Cheektowaga, NY
- Population (ZIP)
- 12,572
- Household income
- $48,476
- Rent vs Own
- Severe rent burden
- 723.0
Population outlook (Erie County) Hauer SSP2
- Today (2025)
- 933,037 people
- By 2030
- 935,181 · +0.2%
- By 2040
- 928,531 · -0.5%
- By 2050
- 905,725 · -2.9%
- By 2075
- 834,037 · -10.6%
- By 2100
- 708,033 · -24.1%
Race, ethnicity, and origin ACS 2023
- Neighborhood character
- Predominantly Black (72%)
- Race & ethnicity
- Black 72% White 15% Asian 6% Two or more races 4% Hispanic / Latino 3%
- Common ancestry
- Romanian 2% Italian 1% Hispanic 0%
- Foreign-born
- 7% · Canada, South Korea, Philippines
- Languages at home
- 89% English-only · Other Indo-European 3% Spanish 2% French/Haitian/Cajun 1%
Political lean MEDSL · Erie
- 2024 margin
- Lean D (+9.7) · D 54.8% · R 45.2%
- 2008→2024 swing
- -7.9pp toward R · 2008: 17.5pp · 2024: 9.7pp
- All cycles
- 2024: D+9.7 2020: D+14.7 2016: D+4.8 2012: D+15.6 2008: D+17.5
Not yet ingested
- Civics
- —
Market trends
- HPI YoY
- ▼ -16.37%
- Current HPI
- 459.2084
- Rent YoY
- —
- Metro
- Buffalo-Cheektowaga, NY
- State GDP YoY
- ▲ 2.60%
- F500 in state
- 92
Industry mix (Fortune 500 HQ in NY)
| Industry | F500 HQs | Revenue |
|---|---|---|
| Financial Services | 10 | $950B |
|
||
| Consumer Goods | 9 | $162B |
|
||
| Insurance | 4 | $225B |
|
||
| Telecommunications | 2 | $144B |
|
||
| Pharmaceuticals | 2 | $112B |
|
||
| Media / Entertainment | 2 | $69B |
|
||
Price history
+9714.8% since first listed2 events — show timeline
- 2026-05-04 Listed $265,000 WNYREIS
- 2022-08-03 Sold (Public Records) $2,700 Public Records
Property tax history
+8.0%/yrLatest (2023): $218 · +0.0% YoY. Source: county tax records.
Cash-flow waterfall
monthlySold comps — $/sqft
last 12 mo · ≤1 miLoading sold comps…