105 N Hickory St · Farina, IL
Flood risk 1/10 · Minimal
- FEMA flood zone
- —
- Chance of flooding over 30 yrs
- 0.0%
- Est. flood insurance / yr
- —
Fire risk 1/10 · Minimal
- Est. fire insurance / yr
- $804 – $1,492
Heat risk 4/10 · Minor
- Hot days now (above 106°F)
- 7 days/yr
- Hot days in 30 yrs
- 20 days/yr
Wind risk 2/10 · Minimal
- Chance of severe wind over 30 yrs
- 2.0%
Air-quality risk 2/10 · Minimal
- Unhealthy air days now
- 1 days/yr
- Unhealthy air days in 30 yrs
- 2 days/yr
Risk factors via First Street. Map © Google.
Why this score? — see what drove the B+ grade
The composite is a weighted blend of 9 inputs, each scored 0–100. Each bar is that input's sub-score; the figure is the points it added to the 100-point composite (weight × sub-score).
- Cash flow +30.0/30.0
- ARV discount +10.9/15.0
- 1% rule +10.0/10.0
- DSCR +10.0/10.0
- Appreciation +5.0/10.0
- Condition / age +4.0/5.0
- Livability +3.1/5.0
- Rent growth +2.5/5.0
- Schools +1.4/10.0
$55,000
🖨 Deal sheet 📄 Offer letter ✓ Due diligence
Listing remarks
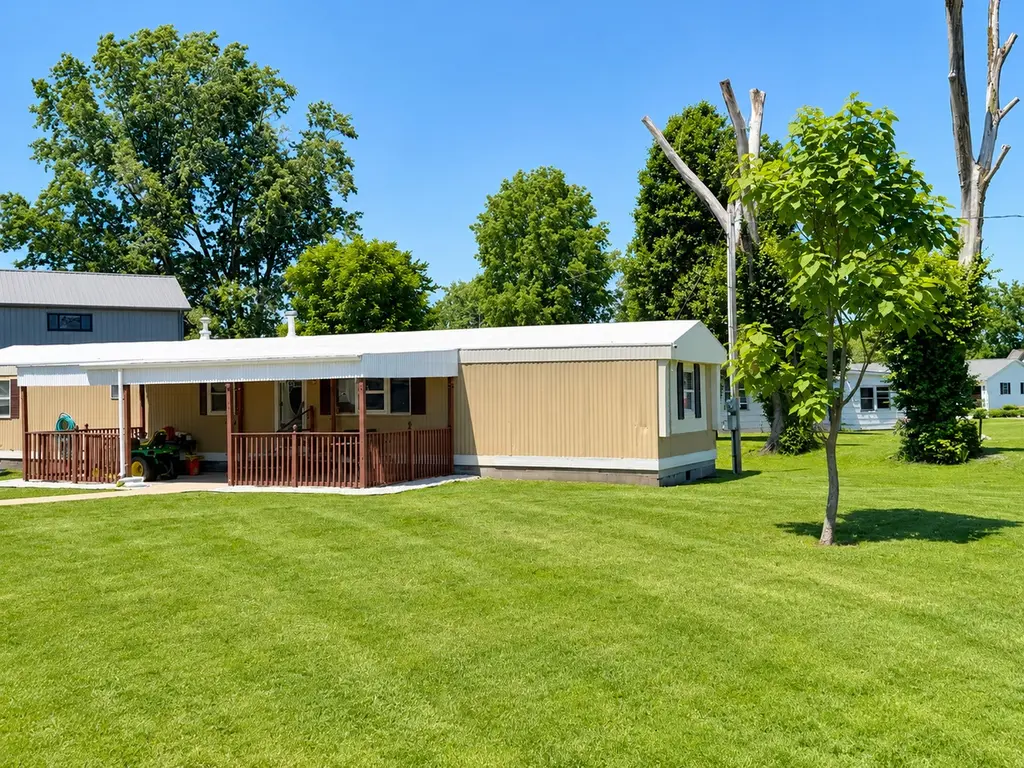
Don't let this 1985 mobile home fool you from the outside. Step inside to a completely remodeled, move-in ready home. New kitchen, new bathroom, new flooring, new windows and built sturdy with 2x6 exterior walls offering lots of durability. Situated on 2 lots making extra space for you to enjoy outdoor living, entertaining, gardening, or simply spread out and enjoy the space and maybe even add another building. Whether you're looking for an affordable full- time residence or an investment opportunity, this property offers all the modern updates with room to grow! Another option is for any out of town outdoorsmen. Farina is only 10 miles from Forbes State Park and this could serve as your p
Key facts
- New kitchen
- New bathroom
- New flooring
Tags
Property features AI
Finance
- HOA & community: No master association fee required
Exterior
- Parking: Space for 2 vehicles; Gravel parking area
- Utilities: Public water; Public sewer
- Home design: Detached single-family modular home; One-story (main-level living); Estimated living area approximately 980 total
- Construction: Metal roof; Block foundation; Built approximately 41–50 years ago; Other construction materials
- Exterior features: Deck; Patio; Porch; Lot approximately 0.5–0.99 acre (dimensions 101 x 152)
Interior
- Kitchen: Updated kitchen with eating area/table space; Range; Microwave; Refrigerator
- Bedrooms: 2 bedrooms (both on main level); Master bedroom on main level
- Flooring: Laminate flooring in living and dining areas; Carpet in bedrooms; Linoleum in kitchen and laundry
- Bathrooms: 1 full bathroom
- Heating & cooling: Natural gas heating; Window and wall air-conditioning units
- Interior features: First-floor bedroom; First-floor full bath; Dining room/kitchen combo; Drapes
- Laundry & utility: Main-level laundry; Washer; Dryer; Electric dryer hookup
Neighborhood map
What this means for you Summary
Snapshot
- This is a 2-bed/1.0-bath single-family listed at $55k. Condition is rated good.
Deal economics
- At list price, monthly cash flow is $312 ($4k/yr) — positive.
- The deal already cash-flows at list — no discount required.
- Meets the 1% rule at list price ($876 rent vs $55k).
Location & tenants
- Location reads 61/100 on livability (#909 in IL) — a middle-class / working-renter tenant base. Strengths: crime A+, cost of living A+, housing A+; Watch: amenities F, commute F, employment F.
- South Central CUD 401 (rural): math 12% / reading 19% proficiency, ranked #506 of 620 in IL (top 82%) — low school quality limits family demand, transient renter base, plan for 1-2y turnover.
- Zoned schools: South Central Elementary-Kinmundy (math 12% / reading 12%, grade F, #1,403 of 2,056 statewide, top 71%, 279 students, 0% FRL); South Central Middle School (math 12% / reading 22%, grade F, #460 of 665 statewide, top 72%, 144 students, 0% FRL); South Central High School (math 17% / reading 22%, grade F, #397 of 693 statewide, top 61%, 206 students, 0% FRL) — zoned schools average 0% FRL vs 51% district-wide (51 pts lower); this property's tenant base skews higher-income than the district average.
- Market conditions: 6 active listings in the ZIP.
Forward outlook
- In year one you build about $2k of equity ($380 loan paydown + $2k appreciation (3.0% local appreciation)).
- Fayette County population projected to shrink 9% by 2050 — rents likely to lag national; underwrite the cash flow, not the appreciation.
- At projected returns (3.0% appreciation + 3.0% rent growth), your $15k cash investment doubles in ~3 years — after that, you're playing with house money.
Negotiation context
- Only 14 days on market — expect competitive offers; lowballing is unlikely to land.
Questions for the listing agent
- Is there a deadline driving the sale (1031 exchange, divorce, estate, relocation)? That informs how much negotiation room exists.
- Schools are F-rated, which usually means shorter tenancies and higher turnover. Who's the typical renter profile here, and what's been the actual vacancy rate?
- What's the average days-on-market for RENTAL listings here right now (not sales)? A rising rental-DOM trend means longer vacancies and softer asking-rent achievability than the comps imply.
- What's the recent tenant-quality profile in this submarket — average credit score on applications, eviction rate, late-payment / NSF rate, and stable-employment percentage? A property-management company in the area should have these aggregated.
- How much new for-sale + rental construction is in the pipeline within 1–3 miles? Heavy new supply typically softens prices + rents 12–24 months out; constrained supply supports both.
Investment metrics
- 1% rule
- 1.59% ✓
- Cap rate
- 13.09%
- Cash-on-cash
- 24.28%
- DSCR
- 2.08
- GRM
- 5.2
CMA / ARV
- ARV (median comp)
- $59,459
- List price
- $55,000
- Delta
- -7.50%
- Verdict
- FAIR
- Comps
- 8 within 1.0 mi
Show comp detail 3 sales within ~0.75 mi
| Address | Dist | Beds/Ba | Sqft | Sold | Price | $/sf | Match |
|---|---|---|---|---|---|---|---|
| 111 S Walnut St | 0.13mi | 2/1.0 | 936 (-4%) | 11mo | $50,000 | $53 | 77 |
| 308 W Washington St W | 0.22mi | 2/1.0 | 906 (-8%) | 1mo | $47,000 | $52 | 76 |
| 414 E Monroe Ave | 0.41mi | 2/1.0 | 914 (-7%) | 4mo | $50,000 | $55 | 66 |
Match score weights: distance 35% · size 25% · config 20% · recency 20%. Top-matched comps best support the ARV.
Projected returns pro-forma
3.0% appreciation · 3.0% rent growth · sell at horizon
- IRR
- 30.4%
- Equity multiple
- 2.72×
- Total profit
- $26,482
- Equity at exit
- $24,730
- IRR
- 30.8%
- Equity multiple
- 5.32×
- Total profit
- $66,491
- Equity at exit
- $38,112
Cash invested: $15,400 (down + closing). Projections, not guarantees.
Landlord ↔ Tenant lean methodology
- Overall (STATE)
- 43 Moderately Tenant-Leaning
- State Illinois
- 43 Moderately Tenant-Leaning · D+7
- County
- — inherits STATE
- City
- — inherits STATE
ZIP-level market 62838
- Active inventory
- 6
- Price-to-rent
- 5.2×
Monthly cashflow live
- Estimated rent
- $876 medium interval (Pro) →
- Mortgage (P&I)
- −$288
- Tax est. 1.5%
- −$69 /mo · $825/yr
- Insurance
- −$23
- HOA
- −$0
- Vacancy / Maint / Mgmt
- −$184
- Net cashflow
- $312
Break-even live
UW: 25.0% down · 7.5% · 30yr · 1.5% tax · 5.0% vac · 8.0% maint · 8.0% mgmt
Financing live
Cash to close
- Down payment
- $13,750
- Closing costs
- $1,650
- Reserves months
- —
- Total cash needed
- —
Loan-product check · same deal, 3 products live
Conventional
25% down · 7.5% · 30yr
- Down + closing
- —
- Monthly P&I
- —
- Monthly cashflow
- —
- DSCR
- —
- Eligible?
- —
Personal DTI + credit; lowest rate.
DSCR
20% down · 8.5% · 30yr
- Down + closing
- —
- Monthly P&I
- —
- Monthly cashflow
- —
- DSCR
- —
- Eligible?
- —
No personal income docs; deal must DSCR.
Hard money
10% down · 12.0% · 12mo
- Down + closing
- —
- Monthly P&I
- —
- Monthly cashflow
- —
- DSCR
- —
- Eligible?
- —
Short-term bridge; refi at stabilization.
Listing history 1 events
-
2026-05-12$55,000 Active 728-char remark
ⓘ Source: listings_history table (triggers on properties + properties_extension) + one-shot
backfill from property_details.listing_events for pre-trigger history.
Climate risk First Street
- Flood 1/10 Low 0% chance over 30 yrs
- Wildfire 1/10 Low
- Heat 4/10 Moderate 7 d/yr ≥106°F today · 20 d/yr by 30 yrs out
- Wind 2/10 Low 2% chance of damaging wind over 30 yrs
- Air quality 2/10 Low 1 unhealthy d/yr today · 2 by 30 yrs out
Nearby sold comps map
Loading sold comps map…
Walkable amenities ~0.75 mi
Loading nearby amenities…
Taxation est. · year 1
- Rental income
- $10,506
- − Mortgage interest
- −$3,081
- − Property taxes
- −$825
- − Insurance
- −$275
- − Repairs & maintenance
- −$840
- − Management
- −$840
- − Depreciation
- −$1,600
- Taxable income
- $3,044
- Est. tax owed @ 24.0%
- −$731
- After-tax cash flow
- $3,008/yr
For passive investors: Depreciation is non-cash, so a rental often shows a tax loss while cash-flowing — sheltering income. Rental losses are passive: they offset passive income freely, and up to $25,000/yr can offset ordinary (W-2) income if you actively participate and your MAGI is under $100k (phasing out to $0 by $150k); unused losses carry forward. On sale, claimed depreciation is recaptured at up to 25%, and gains may owe capital-gains tax (a 1031 exchange can defer both). Figures are a year-1 estimate at your 24.0% rate — not tax advice; consult a CPA.
Condition & rehab AI · 13 photos
This 1985 mobile home is move-in ready with recent updates, including a new kitchen and bathroom. The exterior and interior are in good condition, making it an attractive investment opportunity.
Value-add opportunities
- Resale Paint exterior — Enhances curb appeal and can add value
- Rental Clean gutters — Keeps property in good condition and prevents water damage
Renovation cost estimate screening
Value-add ROI direction
- Resale Paint exterior — Enhances curb appeal and can add value ↑
- Rental Clean gutters — Keeps property in good condition and prevents water damage ↑
ⓘ Cost ranges are severity-bucket heuristics (US national rule-of-thumb). Get contractor quotes + a written scope before underwriting a rehab budget.
Schools (NCES district)
- District
- South Central CUD 401
- NCES district ID
- 1700114
- Math proficiency
- 12% ▼ -1.00%
- Reading proficiency
- 19% ▼ -13.00%
- Median HH income
- $43,276
- Composite
- 13.52/100
- National rank
- #9517
- State rank
- #506 of 620 in IL
Livability — Farina
- Score
- 61/100
- State rank
- #909
- US rank
- #17635
Category grades
Schools grade is shown separately in the Schools card above.
Census & demographics
- Census place
- Farina, IL
- Population (ZIP)
- 1,555
Population outlook (Fayette County) Hauer SSP2
- Today (2025)
- 21,667 people
- By 2030
- 21,362 · -1.4%
- By 2040
- 20,602 · -4.9%
- By 2050
- 19,669 · -9.2%
- By 2075
- 16,870 · -22.1%
- By 2100
- 12,861 · -40.6%
Race, ethnicity, and origin ACS 2023
- Neighborhood character
- Predominantly White (98%)
- Race & ethnicity
- White 98% Two or more races 2%
- Common ancestry
- Iranian 3% Slovak 3% Lithuanian 2%
- Foreign-born
- 1% · Canada
Political lean MEDSL · Fayette
- 2024 margin
- Solid R (+64.7) · D 17.0% · R 81.7% · Other 1.3%
- 2008→2024 swing
- -48.9pp toward R · 2008: -15.8pp · 2024: -64.7pp
- All cycles
- 2024: R+64.7 2020: R+61.8 2016: R+58.3 2012: R+34.6 2008: R+15.8
Not yet ingested
- Civics
- —
Market trends
- HPI YoY
- —
- Current HPI
- —
- Rent YoY
- —
- Metro
- —
- State GDP YoY
- ▲ 1.59%
- F500 in state
- 60
Industry mix (Fortune 500 HQ in IL)
| Industry | F500 HQs | Revenue |
|---|---|---|
| Insurance | 4 | $201B |
|
||
| Consumer Goods | 4 | $87B |
|
||
| Industrial Machinery | 3 | $64B |
|
||
| Healthcare | 2 | $55B |
|
||
| Retail / Pharmacy | 1 | $148B |
|
||
| Agriculture / Food | 1 | $86B |
|
||
Price history
2 events — show timeline
- 2026-05-27 Pending — MRED as Distributed by MLS Grid
- 2026-05-12 Listed $55,000 MRED as Distributed by MLS Grid
Cash-flow waterfall
monthlySold comps — $/sqft
last 12 mo · ≤1 miLoading sold comps…