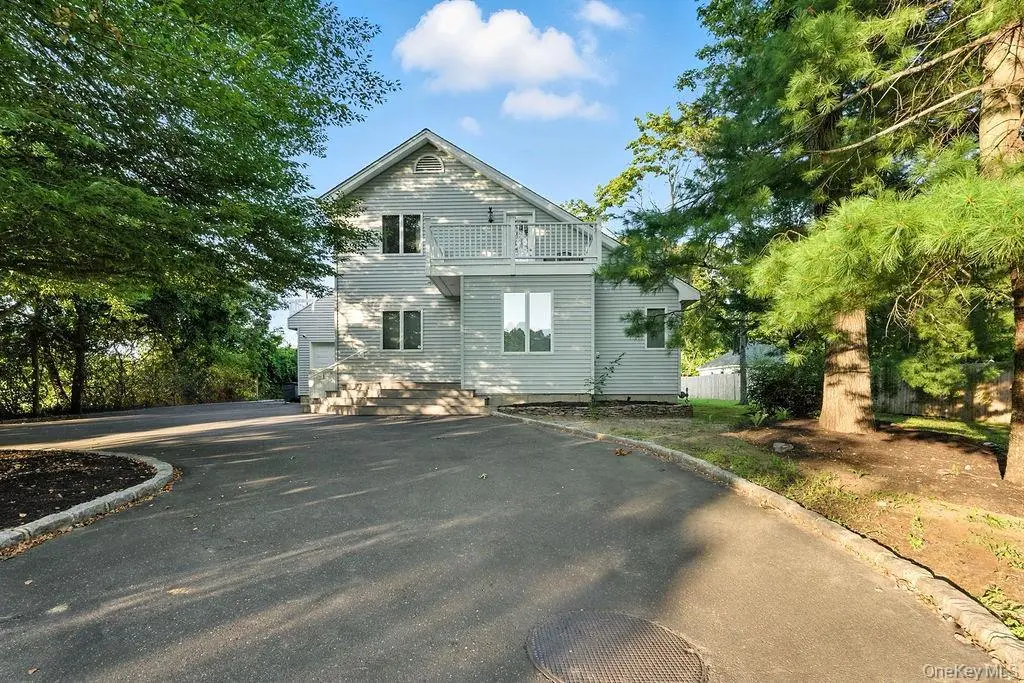
100 Manor Ln · Jamesport, NY
Flood risk 1/10 · Minimal
- FEMA flood zone
- X (unshaded)
- Chance of flooding over 30 yrs
- 0.0%
- Est. flood insurance / yr
- $473 – $860
Fire risk 2/10 · Minimal
- Est. fire insurance / yr
- $691 – $1,283
Heat risk 5/10 · Moderate
- Hot days now (above 91°F)
- 7 days/yr
- Hot days in 30 yrs
- 19 days/yr
Wind risk 8/10 · Major
- Chance of severe wind over 30 yrs
- 80.0%
Air-quality risk 3/10 · Minor
- Unhealthy air days now
- 2 days/yr
- Unhealthy air days in 30 yrs
- 4 days/yr
Risk factors via First Street. Map © Google.
Why this score? — see what drove the C- grade
The composite is a weighted blend of 9 inputs, each scored 0–100. Each bar is that input's sub-score; the figure is the points it added to the 100-point composite (weight × sub-score).
- Cash flow +21.1/30.0
- ARV discount +7.8/15.0
- DSCR +6.7/10.0
- 1% rule +5.4/10.0
- Schools +3.6/10.0
- Rent growth +2.5/5.0
- Condition / age +2.5/5.0
- Livability +2.3/5.0
- Appreciation +0.0/10.0
$849,999
🖨 Deal sheet 📄 Offer letter ✓ Due diligence
Listing remarks
Welcome to this secluded home flooded with natural light from large skylights nestled next to a beautiful apple orchard in the heart of Jamesport Hamlet. This elegant home boasts 3 bedrooms and 2 bathrooms with an open floor plan. Forced air climate control throughout the home with vaulted ceilings, balcony and large second floor deck, attached garage, driveway parking for many cars, electric car charging station, gas service at foundation line and a recently finished basement. This property features beach rights, close proximity to wineries, wedding venues, restaurants, breweries, aquarium, splish splash, tanger, Greenport, Southold and orient point!
Key facts
- Open floor plan
- Balcony
- Natural light
Tags
Property features AI
Exterior
- Parking: Driveway; 1-car garage
- Utilities: Electric service by PSEG; Cesspool sewer; Natural gas available; Public trash collection
- Home design: Single family residence
- Construction: Vinyl siding construction
- Exterior features: Vinyl siding; Not waterfront
Interior
- Kitchen: Dishwasher; Microwave; Oven; Refrigerator; Stainless steel appliances
- Bedrooms: Includes a bedroom on the first floor
- Bathrooms: 2 full bathrooms
- Heating & cooling: Oil heating; Central air conditioning
- Interior features: First-floor bedroom; First-floor full bathroom; Central vacuum; Entrance foyer; High ceilings; Open floor plan; Open kitchen; Smart thermostat; Walk-in closet(s); Washer/dryer hookup; Finished full basement with Bilco doors, storage space and walk-out access; Partial attic
- Laundry & utility: Washer; Dryer; Washer/dryer hookup
Neighborhood map
What this means for you Summary
Snapshot
- This is a 3-bed/2.0-bath single-family listed at $850k.
Deal economics
- At list price, monthly cash flow is $1k ($14k/yr) — positive.
- The deal already cash-flows at list — no discount required.
- Meets the 1% rule at list price ($9k rent vs $850k).
- Recommended offer: $837k (1.5% below list) — sets the bar for market timing.
Location & tenants
- Location reads 46/100 on livability (#1,185 in NY) — a working-class tenant base; expect higher turnover. Strengths: housing A+, crime A; Watch: amenities F, commute F, employment F.
- Riverhead Central School District (suburban): math 34% / reading 48% proficiency, ranked #489 of 590 in NY (top 83%) — families likely to look elsewhere, expect single-tenant / working-renter base with shorter leases.
- Zoned schools: Aquebogue Elementary School (math 47% / reading 57%, grade C-, #988 of 2,108 statewide, top 49%, 474 students, 40% FRL); Riverhead Middle School (math 18% / reading 35%, grade F, #594 of 729 statewide, top 81%, 827 students, 57% FRL); Riverhead Senior High School (math 80% / reading 86%, grade A, #440 of 1,100 statewide, top 40%, 2,001 students, 52% FRL).
- Zoned-school proficiency averages 54% at this address vs 41% district-wide (+13 pts) — the actual schools serving this property are materially stronger than the Riverhead Central School District average implies; a family-tenant draw the district grade alone would hide.
- Market conditions: 188 active listings in the ZIP; 5 comparable units currently listed for rent nearby; rentals at typical pace (median 20d on market — plan ~3-4 weeks tenant-placement turnaround); 40% of comp listings sitting > 30 days — soft ceiling on asking rent; 1,366 units permitted in Suffolk County in 2024 (216 in 5+ unit buildings).
Forward outlook
- Local home prices are declining (-3.0%/yr); year-one equity from $6k of loan paydown is wiped out by about $26k of value loss. Plan a longer hold.
- Suffolk County population projected to shrink 5% by 2050 — rents likely to lag national; underwrite the cash flow, not the appreciation.
Negotiation context
- It's been on market 23 days — a 2% lower offer ($837k) is reasonable based on typical stale-listing flexibility.
- 5 sale attempts since 3y ago with the ask held roughly flat each time — persistent listings suggest the price (not the market) is what's stuck; bring a comps-based counter.
Risks & watch-outs
- Climate carrying-cost: severe wind risk, 80% chance of damaging wind over 30y; extreme-heat days projected 7→19/yr by 2055 (HVAC capex compounding) — expect insurance premiums to compound above CPI over the hold.
Questions for the listing agent
- Is there a deadline driving the sale (1031 exchange, divorce, estate, relocation)? That informs how much negotiation room exists.
- What's the average days-on-market for RENTAL listings here right now (not sales)? A rising rental-DOM trend means longer vacancies and softer asking-rent achievability than the comps imply.
- What's the recent tenant-quality profile in this submarket — average credit score on applications, eviction rate, late-payment / NSF rate, and stable-employment percentage? A property-management company in the area should have these aggregated.
- How much new for-sale + rental construction is in the pipeline within 1–3 miles? Heavy new supply typically softens prices + rents 12–24 months out; constrained supply supports both.
Investment metrics
- 1% rule
- 1.04% ✓
- Cap rate
- 8.00%
- Cash-on-cash
- 6.09%
- DSCR
- 1.27
- GRM
- 8.0
CMA / ARV
- ARV (on-the-fly)
- $855,286
- Comps found
- 5
Show comp detail 5 sales within ~0.75 mi
| Address | Dist | Beds/Ba | Sqft | Sold | Price | $/sf | Match |
|---|---|---|---|---|---|---|---|
| 166 Manor Ln | 0.15mi | 3/2.5 | 1,692 (-1%) | 13mo | $735,000 | $434 | 78 |
| 1727 Main Rd | 0.25mi | 3/2.5 | 1,943 (+13%) | 5mo | $635,000 | $327 | 60 |
| 44 Legend Ln | 0.45mi | 3/2.5 | 1,922 (+12%) | 0mo | $1,095,000 | $570 | 57 |
| 27 White Birch Ct | 0.43mi | 4/2.0 (+1) | 1,700 (-1%) | 20mo | $849,000 | $499 | 57 |
| 160 High Meadow Ln | 0.71mi | 3/2.0 | 1,500 (-12%) | 7mo | $995,000 | $663 | 40 |
Match score weights: distance 35% · size 25% · config 20% · recency 20%. Top-matched comps best support the ARV.
Projected returns pro-forma
-3.0% appreciation · 3.0% rent growth · sell at horizon
- IRR
- -6.9%
- Equity multiple
- 0.74×
- Total profit
- $-60,778
- Equity at exit
- $126,738
- IRR
- 2.7%
- Equity multiple
- 1.19×
- Total profit
- $46,400
- Equity at exit
- $73,492
Cash invested: $238,000 (down + closing). Projections, not guarantees.
Landlord ↔ Tenant lean methodology
- Overall (STATE)
- 15 Strongly Tenant-Friendly
- State New York
- 15 Strongly Tenant-Friendly · D+10
- County
- — inherits STATE
- City
- — inherits STATE
ZIP-level market 11901
- Home prices YoY
- -29.5%
- Active inventory
- 188
- Price-to-rent
- 8.0×
Monthly cashflow live
- Estimated rent
- $8,858 medium interval (Pro) →
- Mortgage (P&I)
- −$4,457
- Tax from tax record
- −$979 /mo · $11,746/yr
- Insurance
- −$354
- HOA
- −$0
- Vacancy / Maint / Mgmt
- −$1,860
- Net cashflow
- $1,207
Break-even live
UW: 25.0% down · 7.5% · 30yr · 1.5% tax · 5.0% vac · 8.0% maint · 8.0% mgmt
Financing live
Cash to close
- Down payment
- $212,500
- Closing costs
- $25,500
- Reserves months
- —
- Total cash needed
- —
Loan-product check · same deal, 3 products live
Conventional
25% down · 7.5% · 30yr
- Down + closing
- —
- Monthly P&I
- —
- Monthly cashflow
- —
- DSCR
- —
- Eligible?
- —
Personal DTI + credit; lowest rate.
DSCR
20% down · 8.5% · 30yr
- Down + closing
- —
- Monthly P&I
- —
- Monthly cashflow
- —
- DSCR
- —
- Eligible?
- —
No personal income docs; deal must DSCR.
Hard money
10% down · 12.0% · 12mo
- Down + closing
- —
- Monthly P&I
- —
- Monthly cashflow
- —
- DSCR
- —
- Eligible?
- —
Short-term bridge; refi at stabilization.
Rent comps 5 comps
| Address | Beds | Baths | Sqft | Rent | $/sqft | DOM | Units | Dist |
|---|---|---|---|---|---|---|---|---|
| 144 Manor Ln Jamesport, NY | 4.0 | 2.5 | 2100 | $9,500 | $4.52 | 4d | 1 | 0.10mi |
| 1727 Main Rd Unit 1538864P Laurel, NY | 3.0 | 2.5 | 1937 | $7,548 | $3.90 | 13d | 1 | 0.34mi |
| 7 Eileen Cir Jamesport, NY | 3.0 | 2.0 | 1572 | $10,000 | $6.36 | 20d | 1 | 0.84mi |
| 23 Scallop Ln South Jamesport, NY | 3.0 | 2.0 | 1285 | $25,000 | $19.46 | 44d | 1 | 1.22mi |
| 33 Beach Rd Laurel, NY | 3.0 | 2.5 | 1607 | $4,500 | $2.80 | 44d | 1 | 1.31mi |
Listing history 28 events
-
2026-06-18days on market $849,999 Active 23 DOM
-
2026-06-17days on market $849,999 Active 22 DOM
-
2026-06-16days on market $849,999 Active 21 DOM
-
2026-06-15days on market $849,999 Active 20 DOM
-
2026-06-13days on market $849,999 Active 18 DOM
-
2026-06-09days on market $849,999 Active 14 DOM
-
2026-06-08days on market $849,999 Active 13 DOM
-
2026-06-07days on market $849,999 Active 12 DOM
-
2026-06-04days on market $849,999 Active 9 DOM
-
2026-06-03days on market $849,999 Active 8 DOM
-
2026-06-02days on market $849,999 Active 7 DOM
-
2026-06-01days on market $849,999 Active 6 DOM
-
2026-05-31days on market $849,999 Active 5 DOM
-
2026-05-26$849,999 Active
-
2026-04-01historical
-
2026-02-11$874,999 Active
-
2025-11-21historical
-
2025-08-05$899,999 Active
-
2024-07-03historical $14,500
-
2024-06-12$14,500
-
2024-02-26soldstatus $814,125
-
2023-10-24soldstatus $814,125 Closed
-
2023-07-10status Pending
-
2023-05-11price $875,000
-
2023-04-04$849,000 Active
-
2023-03-31historical $849,000
-
2022-11-18historical
-
1989-03-10soldstatus $217,500
ⓘ Source: listings_history table (triggers on properties + properties_extension) + one-shot
backfill from property_details.listing_events for pre-trigger history.
Tax reassessment forecast NY · Partial reset (capped growth)
- Current annual tax
- $11,746 · $979/mo
- Projected year-2 tax
- $13,055 · $1,088/mo
- Expected delta
- +$1,310/yr (+$109/mo · 11.1%)
ⓘ Screening estimate from a state-policy table — verify with the county assessor before closing.
Climate risk First Street
- Flood 1/10 Low FEMA zone X (unshaded) · 0% chance over 30 yrs
- Wildfire 2/10 Low
- Heat 5/10 Major 7 d/yr ≥91°F today · 19 d/yr by 30 yrs out
- Wind 8/10 Severe 80% chance of damaging wind over 30 yrs
- Air quality 3/10 Moderate 2 unhealthy d/yr today · 4 by 30 yrs out
Nearby sold comps map
Loading sold comps map…
Walkable amenities ~0.75 mi
Loading nearby amenities…
Taxation est. · year 1
- Rental income
- $106,291
- − Mortgage interest
- −$47,613
- − Property taxes
- −$11,746
- − Insurance
- −$4,250
- − Repairs & maintenance
- −$8,503
- − Management
- −$8,503
- − Depreciation
- −$24,727
- Taxable income
- $948
- Est. tax owed @ 24.0%
- −$228
- After-tax cash flow
- $14,257/yr
For passive investors: Depreciation is non-cash, so a rental often shows a tax loss while cash-flowing — sheltering income. Rental losses are passive: they offset passive income freely, and up to $25,000/yr can offset ordinary (W-2) income if you actively participate and your MAGI is under $100k (phasing out to $0 by $150k); unused losses carry forward. On sale, claimed depreciation is recaptured at up to 25%, and gains may owe capital-gains tax (a 1031 exchange can defer both). Figures are a year-1 estimate at your 24.0% rate — not tax advice; consult a CPA.
Schools (NCES district)
- District
- Riverhead Central School District
- NCES district ID
- 3624690
- Math proficiency
- 34% ▼ -4.00%
- Reading proficiency
- 48% ▲ 13.00%
- Median HH income
- $61,607
- Composite
- 36.38/100
- National rank
- #4683
- State rank
- #489 of 590 in NY
Livability — Jamesport
- Score
- 46/100
- State rank
- #1185
- US rank
- #26497
Category grades
Schools grade is shown separately in the Schools card above.
Census & demographics
- Census place
- Jamesport, NY
- City population
- 716
- Population (ZIP)
- 32,921
Population outlook (Suffolk County) Hauer SSP2
- Today (2025)
- 1,505,262 people
- By 2030
- 1,498,318 · -0.5%
- By 2040
- 1,471,101 · -2.3%
- By 2050
- 1,424,848 · -5.3%
- By 2075
- 1,337,157 · -11.2%
- By 2100
- 1,217,720 · -19.1%
Race, ethnicity, and origin ACS 2023
- Neighborhood character
- Diverse neighborhood (Simpson 0.63)
- Race & ethnicity
- White 52% Hispanic / Latino 29% Two or more races 14% Black 11% Asian 3%
- Hispanic origin (detail)
- Mexican 4%
- Common ancestry
- Romanian 8% Iranian 1% Portuguese 1%
- Foreign-born
- 25% · Canada, Jamaica
- Languages at home
- 68% English-only · Spanish 26% Other Indo-European 3% Russian/Polish/Slavic 2%
Political lean MEDSL · Suffolk
- 2024 margin
- Lean R (+10.0) · D 45.0% · R 55.0%
- 2008→2024 swing
- -16.0pp toward R · 2008: 6.0pp · 2024: -10.0pp
- All cycles
- 2024: R+10.0 2020: R+0.0 2016: R+8.2 2012: D+2.9 2008: D+6.0
Not yet ingested
- Civics
- —
Market trends
- HPI YoY
- ▼ -182.60%
- Current HPI
- 436.7781
- Rent YoY
- —
- Metro
- —
- State GDP YoY
- ▲ 2.60%
- F500 in state
- 92
Industry mix (Fortune 500 HQ in NY)
| Industry | F500 HQs | Revenue |
|---|---|---|
| Financial Services | 10 | $950B |
|
||
| Consumer Goods | 9 | $162B |
|
||
| Insurance | 4 | $225B |
|
||
| Telecommunications | 2 | $144B |
|
||
| Pharmaceuticals | 2 | $112B |
|
||
| Media / Entertainment | 2 | $69B |
|
||
Price history
+290.8% since first listed15 events — show timeline
- 2026-05-26 Listed $849,999 OneKey® MLS as Distributed by MLS Grid
- 2026-04-01 Listing Removed — OneKey® MLS as Distributed by MLS Grid
- 2026-02-11 Listed $874,999 OneKey® MLS as Distributed by MLS Grid
- 2025-11-21 Listing Removed — OneKey® MLS as Distributed by MLS Grid
- 2025-08-05 Listed $899,999 OneKey® MLS as Distributed by MLS Grid
- 2024-07-03 Rental Removed $14,500 ONEKEY
- 2024-06-12 Listed for Rent $14,500 ONEKEY
- 2024-02-26 Sold (Public Records) $814,125 Public Records
- 2023-10-24 Sold (MLS) $814,125 OneKey® MLS as Distributed by MLS Grid
- 2023-07-10 Pending — OneKey® MLS as Distributed by MLS Grid
- 2023-05-11 Price Changed $875,000 OneKey® MLS as Distributed by MLS Grid
- 2023-04-04 Listed $849,000 OneKey® MLS as Distributed by MLS Grid
- 2023-03-31 Coming Soon $849,000 OneKey® MLS as Distributed by MLS Grid
- 2022-11-18 Rental Removed — ONEKEY
- 1989-03-10 Sold (Public Records) $217,500 Public Records
Property tax history
+2.9%/yrLatest (2025): $11,746 · +0.0% YoY. Source: county tax records.
Cash-flow waterfall
monthlySold comps — $/sqft
last 12 mo · ≤1 miLoading sold comps…