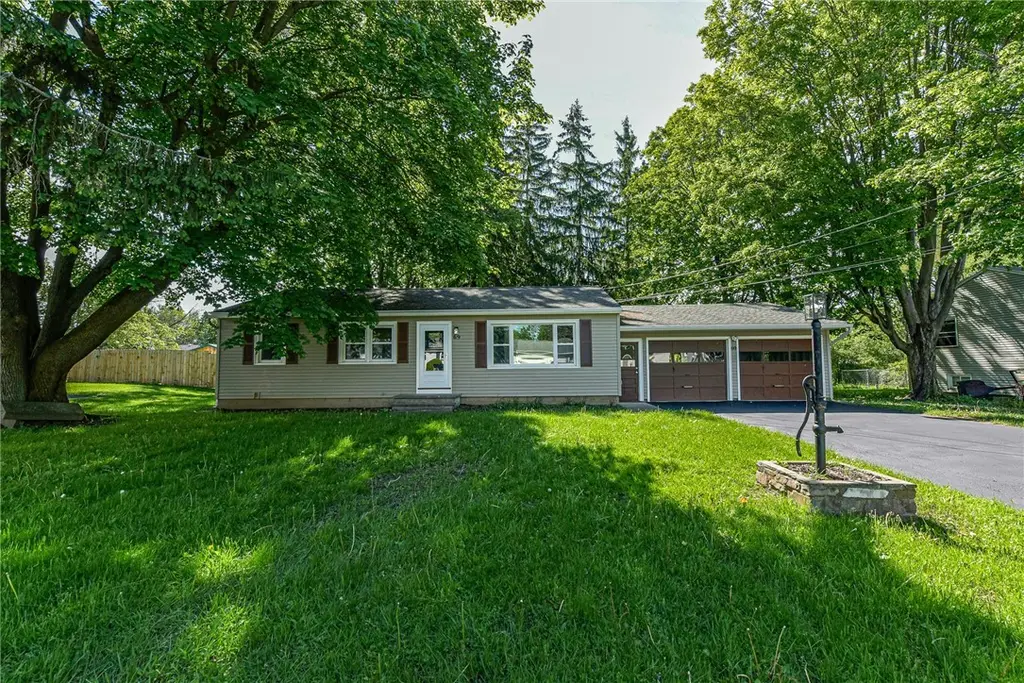
69 Matilda St · North Gates, NY
Flood risk 1/10 · Minimal
- FEMA flood zone
- X (unshaded)
- Chance of flooding over 30 yrs
- 0.0%
- Est. flood insurance / yr
- $473 – $860
Fire risk 1/10 · Minimal
- Est. fire insurance / yr
- $691 – $1,283
Heat risk 2/10 · Minimal
- Hot days now (above 95°F)
- 7 days/yr
- Hot days in 30 yrs
- 15 days/yr
Wind risk 1/10 · Minimal
- Chance of severe wind over 30 yrs
- —
Air-quality risk 2/10 · Minimal
- Unhealthy air days now
- 1 days/yr
- Unhealthy air days in 30 yrs
- 2 days/yr
Risk factors via First Street. Map © Google.
Why this score? — see what drove the F grade
The composite is a weighted blend of 9 inputs, each scored 0–100. Each bar is that input's sub-score; the figure is the points it added to the 100-point composite (weight × sub-score).
- Cash flow +4.5/30.0
- Rent growth +4.1/5.0
- Livability +3.8/5.0
- Schools +3.6/10.0
- Condition / age +2.5/5.0
- 1% rule +2.3/10.0
- DSCR +0.0/10.0
- ARV discount +0.0/15.0
- Appreciation +0.0/10.0
$239,900
🖨 Deal sheet (PDF) 📄 Offer letter ✓ Due diligence
Listing remarks
Welcome to 69 Matilda Street! Renovated, 3 bedroom, two full bath ranch! This one does not need anything! Refinished hardwoods, two complete bathroom remodel, complete kitchen remodel, quartz countertops, soft close cabinets and new appliances. New fixtures and spc flooring! The basement is finished with a full bath. 2 new garage door lifts and the driveway was just sealed. Move in ready! OPEN HOUSE Saturday May 30th from 2:00-4:00 and Sunday May 31st from 2:00-4:00pm. Delayed negotiation June 3, 2026 at 3:00pm.
Key facts
- Quartz countertops
- Refinished hardwoods
- Soft close cabinets
Tags
Property features AI
Exterior
- Parking: Attached garage; 2-car garage
- Utilities: Public water (connected); Public sewer (connected)
- Home design: Single-story home; Existing construction; Wood siding
- Construction: Block foundation; Wood siding construction
- Exterior features: Blacktop driveway; Rectangular residential lot; City street frontage; Lot dimensions approximately 100 x 157
Interior
- Kitchen: Gas oven; Gas range; Microwave; Dishwasher
- Bedrooms: 3 bedrooms on the main level
- Flooring: Hardwood; Vinyl; Varies
- Bathrooms: 2 full bathrooms (1 on the main level)
- Heating & cooling: Gas forced-air heating
- Interior features: Quartz counters; Bedroom on main level; Partially finished full basement; See remarks
- Laundry & utility: Gas water heater
Neighborhood map
What this means for you Summary
Snapshot
- This is a 3-bed/2.0-bath single-family listed at $240k.
Deal economics
- At list price, monthly cash flow is $-622 ($-7k/yr) — negative.
- To cash-flow at today's rent, offer at most $155k (35.4% below list).
- To meet the 1% rule (rent ≥ 1% of price), the offer needs to be $175k (27.1% below list).
- Recommended offer: $155k (35.4% below list) — sets the bar for cash-flow.
- Cap rate 3.2% vs local median 4.7% in North Gates — below-typical yield; the buyer is paying a premium for something (appreciation thesis, condition, location) that the cap rate doesn't capture.
Location & tenants
- Location reads 75/100 on livability (#245 in NY, #3,859 nationally) — a middle-class / working-renter tenant base. Strengths: housing A+, health & safety A+, cost of living A-; Watch: crime D, amenities F.
- Gates-Chili Central School District (suburban): math 41% / reading 42% proficiency, ranked #491 of 590 in NY (top 83%) — families likely to look elsewhere, expect single-tenant / working-renter base with shorter leases.
- Zoned schools: Neil Armstrong School (math 17% / reading 32%, grade F, #1,846 of 2,108 statewide, top 91%, 389 students, 61% FRL); Gates-Chili Middle School (math 25% / reading 40%, grade F, #504 of 729 statewide, top 70%, 854 students, 58% FRL); Gates-Chili High School (math 92% / reading 70%, grade A, #495 of 1,100 statewide, top 46%, 1,132 students, 55% FRL) — zoned schools average 58% FRL vs 31% district-wide (27 pts higher); higher-poverty schools than district average — tighter screening recommended.
- Market conditions: Rents rising fast (+6.3%/yr); 125 active listings in the ZIP; 2 comparable units currently listed for rent nearby; 1,169 units permitted in Monroe County in 2024 (591 in 5+ unit buildings).
- This rent runs 38% of the median local income ($56k/yr) — at the standard rent-burdened threshold; future hikes will face affordability resistance.
Forward outlook
- Local home prices are declining (-3.0%/yr); year-one equity from $2k of loan paydown is wiped out by about $7k of value loss. Plan a longer hold.
- Monroe County population projected to shrink 6% by 2050 — rents likely to lag national; underwrite the cash flow, not the appreciation.
Negotiation context
- Only 6 days on market — expect competitive offers; lowballing is unlikely to land.
- Current owner paid $74k; list at $240k implies a 222% gain — meaningful room to come down on a strong offer.
Risks & watch-outs
- Watch-outs: property tax is 3.2% of price; built in 1958 — expect roof / HVAC / electrical / plumbing capex.
Questions for the listing agent
- What do current leases actually rent for vs. the listed asking? Can we see a recent rent roll and the last 12 months of T-12 income?
- Built in 1958 — when were the roof, HVAC, electrical panel, plumbing, and water heater last replaced?
- Property tax is high relative to price — has the assessment been appealed recently, and will the sale trigger a re-assessment?
- Is there a deadline driving the sale (1031 exchange, divorce, estate, relocation)? That informs how much negotiation room exists.
- Schools are F-rated, which usually means shorter tenancies and higher turnover. Who's the typical renter profile here, and what's been the actual vacancy rate?
- Crime grade is D in this area — have there been break-ins, vandalism, or insurance claims at this property in the last 3 years? What carrier currently insures it and at what premium?
- The area grade is low — what's the realistic commute time and amenity access for the typical tenant pool here? Any planned neighborhood developments (good or bad) we should know about?
- What's the average days-on-market for RENTAL listings here right now (not sales)? A rising rental-DOM trend means longer vacancies and softer asking-rent achievability than the comps imply.
- What's the recent tenant-quality profile in this submarket — average credit score on applications, eviction rate, late-payment / NSF rate, and stable-employment percentage? A property-management company in the area should have these aggregated.
- How much new for-sale + rental construction is in the pipeline within 1–3 miles? Heavy new supply typically softens prices + rents 12–24 months out; constrained supply supports both.
Investment metrics
- 1% rule
- 0.73% ✗
- Cap rate
- 3.18%
- Cash-on-cash
- -11.11%
- DSCR
- 0.51
- GRM
- 11.4
CMA / ARV
- ARV (on-the-fly)
- $199,500
- Comps found
- 12
Show comp detail 12 sales within ~0.75 mi
| Address | Dist | Beds/Ba | Sqft | Sold | Price | $/sf | Match |
|---|---|---|---|---|---|---|---|
| 133 Matilda St | 0.09mi | 2/2.0 (-1) | 1,089 (+4%) | 9mo | $197,000 | $181 | 77 |
| 110 Howard Rd | 0.54mi | 3/1.0 | 1,056 (+1%) | 1mo | $182,000 | $172 | 69 |
| 209 Rossmore St | 0.19mi | 3/1.0 | 1,000 (-5%) | 12mo | $235,000 | $235 | 69 |
| 17 Beechcraft Dr | 0.50mi | 3/1.0 | 1,032 (-2%) | 2mo | $225,000 | $218 | 68 |
| 84 Kentucky Ave | 0.67mi | 3/2.0 | 1,078 (+3%) | 4mo | $218,000 | $202 | 61 |
| 61 Auburn Ave | 0.51mi | 4/1.0 (+1) | 1,011 (-4%) | 1mo | $183,500 | $182 | 60 |
| 160 Jordan Ave | 0.59mi | 4/1.0 (+1) | 1,048 (-0%) | 5mo | $89,900 | $86 | 59 |
| 12 Beechcraft Dr | 0.53mi | 3/1.0 | 1,144 (+9%) | 7mo | $176,000 | $154 | 50 |
| 67 Koladyne Ave | 0.71mi | 3/2.0 | 1,092 (+4%) | 12mo | $209,000 | $191 | 50 |
| 18 Fox Run | 0.25mi | 2/1.0 (-1) | 896 (-15%) | 8mo | $155,000 | $173 | 49 |
| 32 Drexel Dr | 0.75mi | 3/2.0 | 1,144 (+9%) | 2mo | $285,000 | $249 | 49 |
| 213 Auburn Ave | 0.66mi | 3/1.0 | 985 (-6%) | 10mo | $187,000 | $190 | 47 |
Match score weights: distance 35% · size 25% · config 20% · recency 20%. Top-matched comps best support the ARV.
Projected returns pro-forma
-3.0% appreciation · 6.28% rent growth · sell at horizon
- IRR
- -31.8%
- Equity multiple
- -0.08×
- Total profit
- $-72,269
- Equity at exit
- $35,770
- IRR
- -21.3%
- Equity multiple
- -0.29×
- Total profit
- $-86,769
- Equity at exit
- $20,742
Cash invested: $67,172 (down + closing). Projections, not guarantees.
Landlord ↔ Tenant lean methodology
- Overall (STATE)
- 15 Strongly Tenant-Friendly
- State New York
- 15 Strongly Tenant-Friendly · D+10
- County
- — inherits STATE
- City
- — inherits STATE
ZIP-level market 14606
- Home prices YoY
- -17.9%
- Rents YoY
- 6.3%
- Active inventory
- 125
- Price-to-rent
- 11.4×
Monthly cashflow live
- Estimated rent
- $1,750 medium interval (Pro) →
- Mortgage (P&I)
- −$1,258
- Tax from tax record
- −$646 /mo · $7,750/yr
- Insurance
- −$100
- HOA
- −$0
- Vacancy / Maint / Mgmt
- −$367
- Net cashflow
- $-622
Break-even live
Sensitivity live
| Price | -10% $-486 | -5% $-554 | +0% $-622 | +5% $-690 | +10% $-758 |
|---|---|---|---|---|---|
| Rent | -10% $-760 | -5% $-691 | +0% $-622 | +5% $-553 | +10% $-484 |
| Rate | -1.0pp $-501 | -0.5pp $-561 | base $-622 | +0.5pp $-684 | +1.0pp $-747 |
UW: 25.0% down · 7.5% · 30yr · 1.5% tax · 5.0% vac · 8.0% maint · 8.0% mgmt
Financing live
Cash to close
- Down payment
- $59,975
- Closing costs
- $7,197
- Reserves months
- —
- Total cash needed
- —
Loan-product check · same deal, 3 products live
Conventional
25% down · 7.5% · 30yr
- Down + closing
- —
- Monthly P&I
- —
- Monthly cashflow
- —
- DSCR
- —
- Eligible?
- —
Personal DTI + credit; lowest rate.
DSCR
20% down · 8.5% · 30yr
- Down + closing
- —
- Monthly P&I
- —
- Monthly cashflow
- —
- DSCR
- —
- Eligible?
- —
No personal income docs; deal must DSCR.
Hard money
10% down · 12.0% · 12mo
- Down + closing
- —
- Monthly P&I
- —
- Monthly cashflow
- —
- DSCR
- —
- Eligible?
- —
Short-term bridge; refi at stabilization.
Rent comps 2 comps
| Address | Beds | Baths | Sqft | Rent | $/sqft | DOM | Units | Dist |
|---|---|---|---|---|---|---|---|---|
| 155 Canal Landing Blvd Rochester, NY | 1.0–3.0 | 1.5–2.0 | 1174 | $2,050 | $1.75 | 4d | 5 | 0.57mi |
| 76 Dodge St Rochester, NY | 1.0–2.0 | 1.0 | 742 | $1,250 | $1.68 | 45d | 6 | 1.35mi |
Listing history 7 events
-
2026-06-05status $239,900 Pending 6 DOM
-
2026-06-03days on market $239,900 Active 6 DOM
-
2026-06-03days on market $239,900 Active 5 DOM
-
2026-06-01days on market $239,900 Active 4 DOM
-
2026-05-31days on market $239,900 Active 3 DOM
-
2026-05-28$239,900 Active
-
1993-10-07soldstatus $74,500
ⓘ Source: listings_history table (triggers on properties + properties_extension) + one-shot
backfill from property_details.listing_events for pre-trigger history.
Tax reassessment forecast NY · Partial reset (capped growth)
- Current annual tax
- $7,750 · $646/mo
- Projected year-2 tax
- $7,750 · $646/mo
- Expected delta
- $0/yr ($0/mo · -0.0%)
ⓘ Screening estimate from a state-policy table — verify with the county assessor before closing.
Climate risk First Street
- Flood 1/10 Low FEMA zone X (unshaded) · 0% chance over 30 yrs
- Wildfire 1/10 Low
- Heat 2/10 Low 7 d/yr ≥95°F today · 15 d/yr by 30 yrs out
- Wind 1/10 Low
- Air quality 2/10 Low 1 unhealthy d/yr today · 2 by 30 yrs out
Nearby sold comps map
Loading sold comps map…
Walkable amenities ~0.75 mi
Loading nearby amenities…
Taxation est. · year 1
- Rental income
- $20,994
- − Mortgage interest
- −$13,438
- − Property taxes
- −$7,750
- − Insurance
- −$1,200
- − Repairs & maintenance
- −$1,680
- − Management
- −$1,680
- − Depreciation
- −$6,979
- Taxable loss
- −$11,731
- Est. tax savings @ 24.0%
- +$2,815
- After-tax cash flow
- $-4,645/yr
For passive investors: Depreciation is non-cash, so a rental often shows a tax loss while cash-flowing — sheltering income. Rental losses are passive: they offset passive income freely, and up to $25,000/yr can offset ordinary (W-2) income if you actively participate and your MAGI is under $100k (phasing out to $0 by $150k); unused losses carry forward. On sale, claimed depreciation is recaptured at up to 25%, and gains may owe capital-gains tax (a 1031 exchange can defer both). Figures are a year-1 estimate at your 24.0% rate — not tax advice; consult a CPA.
Schools (NCES district)
- District
- Gates-Chili Central School District
- NCES district ID
- 3611880
- Math proficiency
- 41% ▼ -12.00%
- Reading proficiency
- 42% ▼ -6.00%
- Median HH income
- $55,045
- Composite
- 36.23/100
- National rank
- #4719
- State rank
- #491 of 590 in NY
Livability — North Gates
- Score
- 75/100
- State rank
- #245
- US rank
- #3859
Category grades
Schools grade is shown separately in the Schools card above.
Census & demographics
- Census place
- North Gates, NY
- County
- Monroe County · 674,131 people
- City population
- 27,478
- Metro
- Rochester, NY
- Population (ZIP)
- 25,538
- Household income
- $55,807
- Rent vs Own
- Severe rent burden
- 986.0
Population outlook (Monroe County) Hauer SSP2
- Today (2025)
- 759,460 people
- By 2030
- 757,154 · -0.3%
- By 2040
- 740,644 · -2.5%
- By 2050
- 714,443 · -5.9%
- By 2075
- 645,883 · -15.0%
- By 2100
- 547,084 · -28.0%
Race, ethnicity, and origin ACS 2023
- Neighborhood character
- Diverse neighborhood (Simpson 0.64)
- Race & ethnicity
- White 51% Black 26% Hispanic / Latino 17% Two or more races 8% Asian 3%
- Hispanic origin (detail)
- Puerto Rican 12% Cuban 2%
- Common ancestry
- Romanian 3% Lithuanian 1% Iranian 1%
- Foreign-born
- 10% · Canada, Vietnam, Philippines
- Languages at home
- 79% English-only · Spanish 12% Other Indo-European 3% Other Asian/Pacific 2%
Political lean MEDSL · Monroe
- 2024 margin
- D (+19.1) · D 59.5% · R 40.5%
- 2008→2024 swing
- +1.4pp toward D · 2008: 17.7pp · 2024: 19.1pp
- All cycles
- 2024: D+19.1 2020: D+21.0 2016: D+14.1 2012: D+17.4 2008: D+17.7
Not yet ingested
- Civics
- —
Market trends
- HPI YoY
- ▼ -62.59%
- Current HPI
- 287.6868
- Rent YoY
- ▲ 6.28%
- Metro
- Rochester, NY
- State GDP YoY
- ▲ 2.60%
- F500 in state
- 92
Industry mix (Fortune 500 HQ in NY)
| Industry | F500 HQs | Revenue |
|---|---|---|
| Financial Services | 10 | $950B |
|
||
| Consumer Goods | 9 | $162B |
|
||
| Insurance | 4 | $225B |
|
||
| Telecommunications | 2 | $144B |
|
||
| Pharmaceuticals | 2 | $112B |
|
||
| Media / Entertainment | 2 | $69B |
|
||
Price history
+222.0% since first listed2 events — show timeline
- 2026-05-28 Listed $239,900 UNYREIS
- 1993-10-07 Sold (Public Records) $74,500 Public Records
Property tax history
+8.2%/yrLatest (2025): $7,750 · +14.8% YoY. Source: county tax records.
Cash-flow waterfall
monthlySold comps — $/sqft
last 12 mo · ≤1 miLoading sold comps…