 Duplex
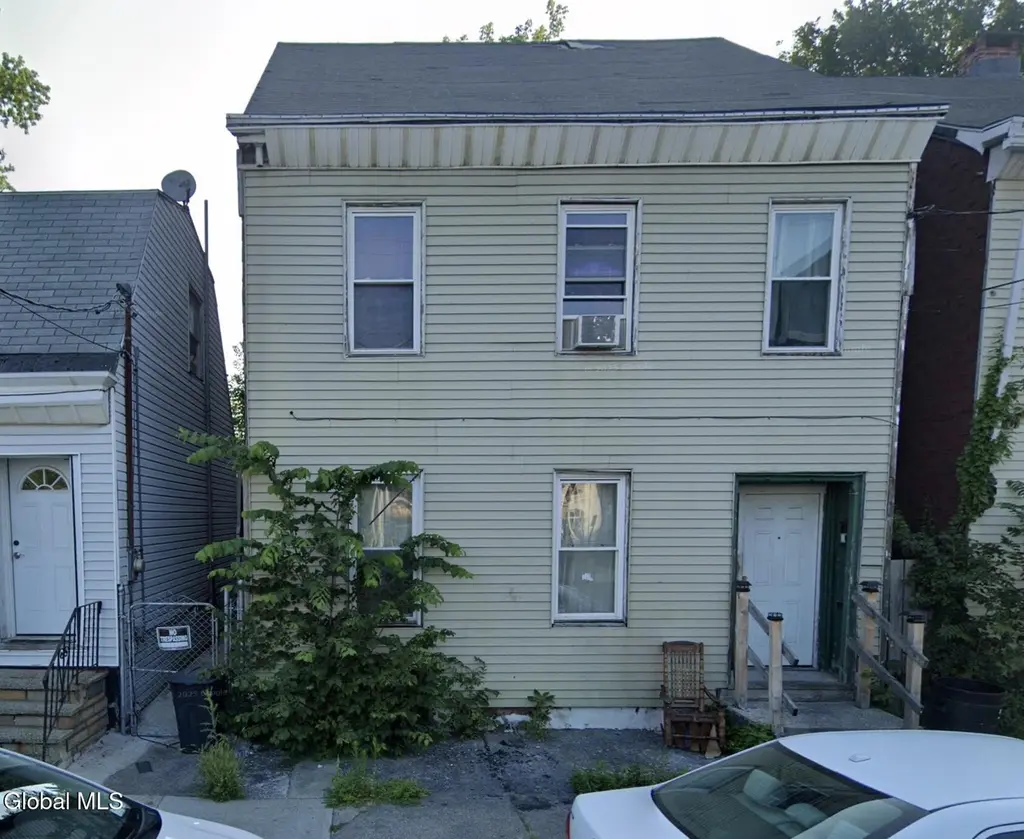
281 Sherman St · Albany, NY
Flood risk 1/10 · Minimal
- FEMA flood zone
- X (unshaded)
- Chance of flooding over 30 yrs
- 0.0%
- Est. flood insurance / yr
- $473 – $860
Fire risk 1/10 · Minimal
- Est. fire insurance / yr
- $691 – $1,283
Heat risk 4/10 · Minor
- Hot days now (above 97°F)
- 7 days/yr
- Hot days in 30 yrs
- 17 days/yr
Wind risk 3/10 · Minor
- Chance of severe wind over 30 yrs
- 6.0%
Air-quality risk 1/10 · Minimal
- Unhealthy air days now
- 0 days/yr
- Unhealthy air days in 30 yrs
- 0 days/yr
Risk factors via First Street. Map © Google.
Why this score? — see what drove the B+ grade
The composite is a weighted blend of 9 inputs, each scored 0–100. Each bar is that input's sub-score; the figure is the points it added to the 100-point composite (weight × sub-score).
- Cash flow +30.0/30.0
- ARV discount +15.0/15.0
- 1% rule +10.0/10.0
- DSCR +10.0/10.0
- Livability +4.0/5.0
- Rent growth +3.8/5.0
- Schools +3.2/10.0
- Condition / age +2.5/5.0
- Appreciation +0.0/10.0
$149,999
🖨 Deal sheet (PDF) 📄 Offer letter ✓ Due diligence
Multi-family units
County records classify this as Multi-Family (2-4 Unit). Listing-text estimate: 2 units. confirmed
Listing remarks MLS
Located in the heart of Albany, this solid 2 family is perfect for new investors or someone looking to add to their portfolio. Each spacious unit has 3 bedrooms and 1 full bath and offers many opportunities for updates. Don't miss the chance to make this investment yours and increase it's value!
Key facts
- 1,742 sq ft lot
- Built 1926
- Listed 135 days
Neighborhood map
What this means for you Summary
Snapshot
- This is a 2 × 3-bed/1.0-bath units multifamily listed at $150k.
Deal economics
- At list price, monthly cash flow is $2k ($22k/yr) — positive. Per door: $916/mo.
- The deal already cash-flows at list — no discount required.
- Meets the 1% rule at list price ($4k rent vs $150k).
- Recommended offer: $132k (12.0% below list) — sets the bar for market timing.
- Cap rate 20.9% vs local median 5.7% in Albany — top-decile yield for the area; either an underpriced asset or a hidden risk that comps aren't pricing in. Stress-test before assuming the spread holds.
Location & tenants
- Location reads 79/100 on livability (#129 in NY, #2,083 nationally) — a middle-class / working-renter tenant base. Strengths: amenities A+, commute A+, housing A+; Watch: employment C-, crime F.
- Albany City School District (urban): math 37% / reading 40% proficiency, ranked #543 of 590 in NY (top 92%) — families likely to look elsewhere, expect single-tenant / working-renter base with shorter leases; 66% free/reduced lunch — lower-income household profile, screen leases tightly.
- Market conditions: Rents rising fast (+5.4%/yr); 89 active listings in the ZIP; 1 comparable units currently listed for rent nearby; lower-income renter base — watch delinquency; 675 units permitted in Albany County in 2024 (451 in 5+ unit buildings).
- At $3,717/mo this rent would consume 107% of the median local household income ($42k/yr) (locally 2035% of renters already pay >50% of income on rent) — very limited rent-growth headroom before tenants either downsize or default.
Forward outlook
- Local home prices are declining (-3.0%/yr); year-one equity from $1k of loan paydown is wiped out by about $4k of value loss. Plan a longer hold.
- Albany County population projected at +9% by 2050 — modest demand growth; plan on rents tracking national, not racing it.
- At projected returns (-3.0% appreciation + 5.4% rent growth), your $42k cash investment doubles in ~3 years — after that, you're playing with house money.
Negotiation context
- It's been on market 135 days — a 12% lower offer ($132k) is reasonable based on typical stale-listing flexibility.
- Current owner paid $90k; list at $150k implies a 67% gain — meaningful room to come down on a strong offer.
Risks & watch-outs
- Watch-outs: built in 1926 — expect roof / HVAC / electrical / plumbing capex.
Questions for the listing agent
- It's been on market 135 days. Have you received any prior offers? Is the seller open to a 12% concession, seller financing, or rate buy-down credit?
- Can we see the unit-by-unit rent roll, current vacancy, and any below-market leases? What's the average tenancy length?
- What capital expenditures (roof, boiler, parking lot, exteriors) have been made in the last 5 years, and what's planned in the next 2?
- Built in 1926 — when were the roof, HVAC, electrical panel, plumbing, and water heater last replaced?
- Why hasn't it sold? Are there any deal-killer items the seller is aware of (foundation, flood, title, zoning, code violations)?
- Is there a deadline driving the sale (1031 exchange, divorce, estate, relocation)? That informs how much negotiation room exists.
- Crime grade is F in this area — have there been break-ins, vandalism, or insurance claims at this property in the last 3 years? What carrier currently insures it and at what premium?
- What's the average days-on-market for RENTAL listings here right now (not sales)? A rising rental-DOM trend means longer vacancies and softer asking-rent achievability than the comps imply.
- What's the recent tenant-quality profile in this submarket — average credit score on applications, eviction rate, late-payment / NSF rate, and stable-employment percentage? A property-management company in the area should have these aggregated.
- How much new apartment / multifamily construction is in the pipeline within 1–3 miles? Heavy new supply (>2% of stock underway) typically softens rents 12–24 months out; light construction supports rent growth.
Investment metrics
- 1% rule
- 2.48% ✓
- Cap rate
- 20.95%
- Cash-on-cash
- 52.34%
- DSCR
- 3.33
- GRM
- 3.4
CMA / ARV
- ARV (median comp)
- $259,640
- List price
- $149,999
- Delta
- -42.23%
- Verdict
- UNDERPRICED
- Comps
- 20 within 1.0 mi
Show comp detail 12 sales within ~0.75 mi
| Address | Dist | Beds/Ba | Sqft | Sold | Price | $/sf | Match |
|---|---|---|---|---|---|---|---|
| 10 Wilkins Ave | 0.48mi | 6/2.0 | 2,294 (+0%) | 1mo | $280,000 | $122 | 76 |
| 534 1st St | 0.23mi | 6/2.0 | 2,464 (+8%) | 0mo | $175,000 | $71 | 76 |
| 351 2nd St | 0.29mi | 6/2.0 | 2,056 (-10%) | 3mo | $184,002 | $89 | 67 |
| 337 3rd St | 0.34mi | 6/2.0 | 2,058 (-10%) | 1mo | $160,000 | $78 | 66 |
| 189-B Quail St | 0.35mi | 6/2.0 | 2,512 (+10%) | 3mo | $185,000 | $74 | 65 |
| 184 N Lake Ave | 0.25mi | 6/2.0 | 1,974 (-14%) | 2mo | $195,000 | $99 | 64 |
| 380-382 Morris St | 0.68mi | 6/2.0 | 2,344 (+2%) | 3mo | $300,000 | $128 | 62 |
| 558 Washington Ave | 0.31mi | 7/3.0 (+1) | 2,562 (+12%) | 3mo | $325,000 | $127 | 54 |
| 459 Hudson Ave | 0.46mi | 6/2.0 | 2,584 (+13%) | 3mo | $235,000 | $91 | 54 |
| 362 Clinton Ave | 0.46mi | 7/4.0 (+1) | 2,490 (+9%) | 2mo | $270,000 | $108 | 50 |
| 538 Myrtle Ave | 0.72mi | 5/5.0 (-1) | 2,216 (-3%) | 2mo | $410,000 | $185 | 42 |
| 9 Pennsylvania Ave | 0.60mi | 5/2.0 (-1) | 1,960 (-14%) | 4mo | $225,000 | $115 | 40 |
Match score weights: distance 35% · size 25% · config 20% · recency 20%. Top-matched comps best support the ARV.
Projected returns pro-forma
-3.0% appreciation · 5.37% rent growth · sell at horizon
- IRR
- 53.1%
- Equity multiple
- 3.42×
- Total profit
- $101,531
- Equity at exit
- $22,365
- IRR
- 59.2%
- Equity multiple
- 7.62×
- Total profit
- $278,119
- Equity at exit
- $12,969
Cash invested: $42,000 (down + closing). Projections, not guarantees.
Landlord ↔ Tenant lean methodology
- Overall (STATE)
- 15 Strongly Tenant-Friendly
- State New York
- 15 Strongly Tenant-Friendly · D+10
- County
- — inherits STATE
- City
- — inherits STATE
ZIP-level market 12206
- Home prices YoY
- -9.9%
- Rents YoY
- 5.4%
- Active inventory
- 89
- Price-to-rent
- 6.7×
Monthly cashflow live
- Estimated rent
- $3,717 high interval (Pro) →
- Mortgage (P&I)
- −$787
- Tax from tax record
- −$256 /mo · $3,067/yr
- Insurance
- −$62
- HOA
- −$0
- Vacancy / Maint / Mgmt
- −$781
- Net cashflow
- $1,832
Break-even live
Sensitivity live
| Price | -10% $1,917 | -5% $1,874 | +0% $1,832 | +5% $1,789 | +10% $1,747 |
|---|---|---|---|---|---|
| Rent | -10% $1,538 | -5% $1,685 | +0% $1,832 | +5% $1,979 | +10% $2,125 |
| Rate | -1.0pp $1,907 | -0.5pp $1,870 | base $1,832 | +0.5pp $1,793 | +1.0pp $1,753 |
2-unit breakdown (identical units grouped — click to expand)
| Units | Beds | Baths | Est. rent |
|---|---|---|---|
| 2× units | 3 | 1 | $3,716 |
| #1 | 3 | 1 | $1,858 |
| #2 | 3 | 1 | $1,858 |
| Total (2 units) | $3,717 | ||
UW: 25.0% down · 7.5% · 30yr · 1.5% tax · 5.0% vac · 8.0% maint · 8.0% mgmt
Financing live
Cash to close
- Down payment
- $37,500
- Closing costs
- $4,500
- Reserves months
- —
- Total cash needed
- —
Loan-product check · same deal, 3 products live
Conventional
25% down · 7.5% · 30yr
- Down + closing
- —
- Monthly P&I
- —
- Monthly cashflow
- —
- DSCR
- —
- Eligible?
- —
Personal DTI + credit; lowest rate.
DSCR
20% down · 8.5% · 30yr
- Down + closing
- —
- Monthly P&I
- —
- Monthly cashflow
- —
- DSCR
- —
- Eligible?
- —
No personal income docs; deal must DSCR.
Hard money
10% down · 12.0% · 12mo
- Down + closing
- —
- Monthly P&I
- —
- Monthly cashflow
- —
- DSCR
- —
- Eligible?
- —
Short-term bridge; refi at stabilization.
Rent comps 1 comps
| Address | Beds | Baths | Sqft | Rent | $/sqft | DOM | Units | Dist |
|---|---|---|---|---|---|---|---|---|
| 69 Winthrop Ave Albany, NY | 6.0 | 2.0 | 2800 | $2,795 | $1.00 | 25d | 1 | 1.29mi |
Listing history 19 events
-
2026-06-21days on market $149,999 Active 135 DOM
-
2026-06-18days on market $149,999 Active 132 DOM
-
2026-06-17days on market $149,999 Active 131 DOM
-
2026-06-16days on market $149,999 Active 130 DOM
-
2026-06-15days on market $149,999 Active 129 DOM
-
2026-06-14days on market $149,999 Active 127 DOM
-
2026-06-10days on market $149,999 Active 124 DOM
-
2026-06-08days on market $149,999 Active 122 DOM
-
2026-06-07days on market $149,999 Active 121 DOM
-
2026-06-03days on market $149,999 Active 117 DOM
-
2026-06-02days on market $149,999 Active 116 DOM
-
2026-06-01days on market $149,999 Active 115 DOM
-
2026-05-31days on market $149,999 Active 114 DOM
-
2026-05-31days on market $149,999 Active 113 DOM
-
2026-03-13price $149,999 296-char remark
Show marketing remark (296 chars)
Located in the heart of Albany, this solid 2 family is perfect for new investors or someone looking to add to their portfolio. Each spacious unit has 3 bedrooms and 1 full bath and offers many opportunities for updates. Don't miss the chance to make this investment yours and increase it's value!
-
2026-02-05$159,999 Active 296-char remark
Show marketing remark (296 chars)
Located in the heart of Albany, this solid 2 family is perfect for new investors or someone looking to add to their portfolio. Each spacious unit has 3 bedrooms and 1 full bath and offers many opportunities for updates. Don't miss the chance to make this investment yours and increase it's value!
-
2025-11-18soldstatus $90,000
-
2011-10-24soldstatus $33,000
-
2005-05-09soldstatus $30,000
ⓘ Source: listings_history table (triggers on properties + properties_extension) + one-shot
backfill from property_details.listing_events for pre-trigger history.
Tax reassessment forecast NY · Partial reset (capped growth)
- Current annual tax
- $3,067 · $256/mo
- Projected year-2 tax
- $3,067 · $256/mo
- Expected delta
- $0/yr ($0/mo · 0.0%)
ⓘ Screening estimate from a state-policy table — verify with the county assessor before closing.
Climate risk First Street
- Flood 1/10 Low FEMA zone X (unshaded) · 0% chance over 30 yrs
- Wildfire 1/10 Low
- Heat 4/10 Moderate 7 d/yr ≥97°F today · 17 d/yr by 30 yrs out
- Wind 3/10 Moderate 6% chance of damaging wind over 30 yrs
- Air quality 1/10 Low 0 unhealthy d/yr today · 0 by 30 yrs out
Nearby sold comps map
Loading sold comps map…
Walkable amenities ~0.75 mi
Loading nearby amenities…
Taxation est. · year 1
- Rental income
- $44,604
- − Mortgage interest
- −$8,402
- − Property taxes
- −$3,067
- − Insurance
- −$750
- − Repairs & maintenance
- −$3,568
- − Management
- −$3,568
- − Depreciation
- −$4,364
- Taxable income
- $20,885
- Est. tax owed @ 24.0%
- −$5,012
- After-tax cash flow
- $16,969/yr
For passive investors: Depreciation is non-cash, so a rental often shows a tax loss while cash-flowing — sheltering income. Rental losses are passive: they offset passive income freely, and up to $25,000/yr can offset ordinary (W-2) income if you actively participate and your MAGI is under $100k (phasing out to $0 by $150k); unused losses carry forward. On sale, claimed depreciation is recaptured at up to 25%, and gains may owe capital-gains tax (a 1031 exchange can defer both). Figures are a year-1 estimate at your 24.0% rate — not tax advice; consult a CPA.
Schools (NCES district)
- District
- Albany City School District
- NCES district ID
- 3602460
- Math proficiency
- 37% ▲ 6.00%
- Reading proficiency
- 40% ▲ 7.00%
- Median HH income
- $40,568
- Composite
- 32.34/100
- National rank
- #5744
- State rank
- #543 of 590 in NY
Livability — Albany
- Score
- 79/100
- State rank
- #129
- US rank
- #2083
Category grades
Schools grade is shown separately in the Schools card above.
Census & demographics
- Census place
- Albany, NY
- County
- Albany County · 196,626 people
- City population
- 116,921
- Metro
- Albany-Schenectady-Troy, NY
- Population (ZIP)
- 14,572
- Household income
- $41,548
- Rent vs Own
- Severe rent burden
- 2035.0
Population outlook (Albany County) Hauer SSP2
- Today (2025)
- 320,794 people
- By 2030
- 327,401 · +2.1%
- By 2040
- 338,218 · +5.4%
- By 2050
- 348,467 · +8.6%
- By 2075
- 381,693 · +19.0%
- By 2100
- 393,809 · +22.8%
Race, ethnicity, and origin ACS 2023
- Neighborhood character
- Highly diverse neighborhood (Simpson 0.75)
- Race & ethnicity
- Black 38% White 27% Hispanic / Latino 15% Two or more races 12% Asian 10%
- Hispanic origin (detail)
- Puerto Rican 10% Dominican 1%
- Common ancestry
- Italian 2% Lithuanian 2% Romanian 1%
- Foreign-born
- 22% · Canada, China
- Languages at home
- 75% English-only · Spanish 10% Other Indo-European 5% Chinese 3%
Political lean MEDSL · Albany
- 2024 margin
- Strong D (+25.8) · D 62.9% · R 37.1%
- 2008→2024 swing
- -3.6pp toward R · 2008: 29.4pp · 2024: 25.8pp
- All cycles
- 2024: D+25.8 2020: D+31.4 2016: D+24.3 2012: D+31.0 2008: D+29.4
Not yet ingested
- Civics
- —
Market trends
- HPI YoY
- ▼ -30.24%
- Current HPI
- 275.8109
- Rent YoY
- ▲ 5.37%
- Metro
- Albany-Schenectady-Troy, NY
- State GDP YoY
- ▲ 2.60%
- F500 in state
- 92
Industry mix (Fortune 500 HQ in NY)
| Industry | F500 HQs | Revenue |
|---|---|---|
| Financial Services | 10 | $950B |
|
||
| Consumer Goods | 9 | $162B |
|
||
| Insurance | 4 | $225B |
|
||
| Telecommunications | 2 | $144B |
|
||
| Pharmaceuticals | 2 | $112B |
|
||
| Media / Entertainment | 2 | $69B |
|
||
Price history
+400.0% since first listed5 events — show timeline
- 2026-03-13 Price Changed $149,999 Global MLS
- 2026-02-05 Listed $159,999 Global MLS
- 2025-11-18 Sold (Public Records) $90,000 Public Records
- 2011-10-24 Sold (Public Records) $33,000 Public Records
- 2005-05-09 Sold (Public Records) $30,000 Public Records
Property tax history
+8.3%/yrLatest (2025): $3,067 · -0.7% YoY. Source: county tax records.
Cash-flow waterfall
monthlySold comps — $/sqft
last 12 mo · ≤1 miLoading sold comps…