953 Prestonwood Ln · Keene, TX
Flood risk No data
- FEMA flood zone
- —
- Chance of flooding over 30 yrs
- —
- Est. flood insurance / yr
- —
Fire risk No data
- Est. fire insurance / yr
- —
Heat risk No data
- Hot days now (above threshold)
- —
- Hot days in 30 yrs
- —
Wind risk No data
- Chance of severe wind over 30 yrs
- —
Air-quality risk No data
- Unhealthy air days now
- —
- Unhealthy air days in 30 yrs
- —
Risk factors via First Street. Map © Google.
Why this score? — see what drove the D- grade
The composite is a weighted blend of 9 inputs, each scored 0–100. Each bar is that input's sub-score; the figure is the points it added to the 100-point composite (weight × sub-score).
- Cash flow +11.9/30.0
- ARV discount +8.4/15.0
- 1% rule +3.7/10.0
- Livability +3.6/5.0
- DSCR +3.5/10.0
- Schools +2.9/10.0
- Rent growth +2.5/5.0
- Condition / age +2.5/5.0
- Appreciation +0.0/10.0
$238,709
🖨 Deal sheet 📄 Offer letter ✓ Due diligence
Listing remarks
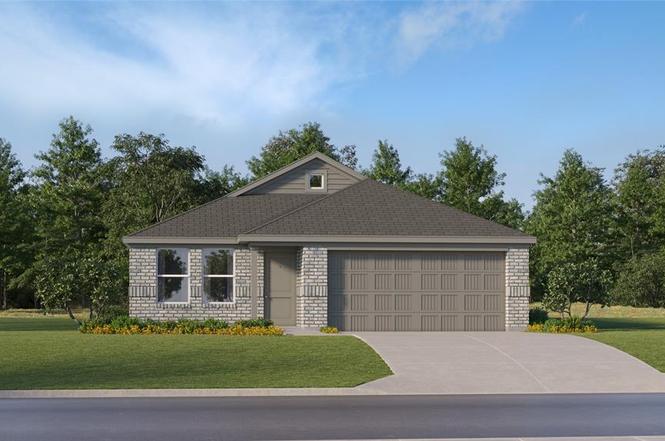
LENNAR -Watermill Collection at Ashton Home Place Newlin plan This single-level home showcases a spacious open floorplan shared between the kitchen, dining area and family room for easy entertaining. An owner’s suite enjoys a private location in a rear corner of the home, complemented by an en-suite bathroom and walk-in closet. There are two secondary bedrooms at the front of the home, which are comfortable spaces for household members and overnight guests.
Key facts
- Walk-in closet
- Open floorplan
- Secondary bedrooms
Tags
Property features AI
Finance
- Other: Builder special listing condition; Possession at closing/funding
- Financial info: Listing accepts Cash, Conventional, FHA and VA financing
- HOA & community: Mandatory association; Annual association fee of $600; Association management: Vision Communities; Association fees cover full use of facilities and grounds maintenance
Exterior
- Parking: Private driveway; Attached 2-car garage
- Security: Carbon monoxide detectors; Fire alarm; Smoke detectors; Other security features
- Utilities: City water; City sewer; Curbs; Sidewalk
- Home design: Single family residence; Residential property; One story; Property is not attached; Smart home features included
- Construction: Composition roof; Slab foundation; Year built: 2025
- Exterior features: Landscaped yard; Wood fencing
Interior
- Kitchen: Dishwasher; Garbage disposal; Electric oven; Electric range
- Bedrooms: 3 bedrooms (all on the main level); Primary bedroom on the main level with dual sinks
- Flooring: Carpet; Other flooring
- Bathrooms: 2 full bathrooms
- Heating & cooling: Central heating; Central air; Ceiling fan(s)
- Interior features: Built-in features; Cable TV available; Decorative lighting; High-speed internet available; One living area; One dining area; 5 total rooms; Levels: One
Neighborhood map
What this means for you Summary
Snapshot
- This is a 3-bed/2.0-bath single-family listed at $239k.
Deal economics
- At list price, monthly cash flow is $-62 ($-748/yr) — negative.
- To cash-flow at today's rent, offer at most $230k (3.8% below list).
- To meet the 1% rule (rent ≥ 1% of price), the offer needs to be $207k (13.2% below list).
- Recommended offer: $207k (13.2% below list) — sets the bar for 1% rule.
- Cap rate 6.0% vs local median 3.2% in Keene — top-decile yield for the area; either an underpriced asset or a hidden risk that comps aren't pricing in. Stress-test before assuming the spread holds.
Location & tenants
- Location reads 72/100 on livability (#249 in TX) — a middle-class / working-renter tenant base. Strengths: crime A+, cost of living A+, housing A+; Watch: schools D+, employment D+, amenities F.
- Cleburne ISD (town): math 34% / reading 33% proficiency, ranked #537 of 826 in TX (top 65%) — families likely to look elsewhere, expect single-tenant / working-renter base with shorter leases.
- Market conditions: 73 active listings in the ZIP; 4 comparable units currently listed for rent nearby; rentals lingering (median 44d on market — plan ~5-8 weeks vacancy on turnover, expect pricing pressure); 50% of comp listings sitting > 30 days — soft ceiling on asking rent; 2,152 units permitted in Johnson County in 2024 (76 in 5+ unit buildings).
Forward outlook
- Local home prices are declining (-3.0%/yr); year-one equity from $2k of loan paydown is wiped out by about $7k of value loss. Plan a longer hold.
- Johnson County population projected at +24% by 2050 — long-run rental-demand tailwind backs the buy-and-hold thesis.
Negotiation context
- It's been on market 47 days — a 3% lower offer ($232k) is reasonable based on typical stale-listing flexibility.
- 3 sale attempts with the ask held roughly flat each time — persistent listings suggest the price (not the market) is what's stuck; bring a comps-based counter.
Questions for the listing agent
- What do current leases actually rent for vs. the listed asking? Can we see a recent rent roll and the last 12 months of T-12 income?
- It's been on market 47 days. Have you received any prior offers? Is the seller open to a 13% concession, seller financing, or rate buy-down credit?
- What does the HOA fee cover, when was the last increase, and are there any pending special assessments or reserve-fund shortfalls?
- Is there a deadline driving the sale (1031 exchange, divorce, estate, relocation)? That informs how much negotiation room exists.
- Schools are D-rated, which usually means shorter tenancies and higher turnover. Who's the typical renter profile here, and what's been the actual vacancy rate?
- The area grade is low — what's the realistic commute time and amenity access for the typical tenant pool here? Any planned neighborhood developments (good or bad) we should know about?
- What's the average days-on-market for RENTAL listings here right now (not sales)? A rising rental-DOM trend means longer vacancies and softer asking-rent achievability than the comps imply.
- What's the recent tenant-quality profile in this submarket — average credit score on applications, eviction rate, late-payment / NSF rate, and stable-employment percentage? A property-management company in the area should have these aggregated.
- How much new for-sale + rental construction is in the pipeline within 1–3 miles? Heavy new supply typically softens prices + rents 12–24 months out; constrained supply supports both.
Investment metrics
- 1% rule
- 0.87% ✗
- Cap rate
- 5.98%
- Cash-on-cash
- -1.12%
- DSCR
- 0.95
- GRM
- 9.6
CMA / ARV
- ARV (on-the-fly)
- $243,520
- Comps found
- 12
Show comp detail 12 sales within ~0.75 mi
| Address | Dist | Beds/Ba | Sqft | Sold | Price | $/sf | Match |
|---|---|---|---|---|---|---|---|
| 988 Prestonwood Ln | 0.06mi | 3/2.0 | 1,522 (0%) | 7mo | $244,849 | $161 | 92 |
| 985 Prestonwood Ln | 0.06mi | 3/2.0 | 1,522 (0%) | 6mo | $238,599 | $157 | 92 |
| 1949 Autumn Ln | 0.26mi | 3/2.0 | 1,522 (0%) | 3mo | $243,499 | $160 | 85 |
| 1937 Autumn Ln | 0.24mi | 3/2.0 | 1,522 (0%) | 6mo | $245,849 | $162 | 84 |
| 1944 Autumn Ln | 0.24mi | 3/2.0 | 1,522 (0%) | 7mo | $245,999 | $162 | 83 |
| 1204 Honeysuckle Dr | 0.46mi | 3/2.0 | 1,499 (-2%) | 5mo | $319,900 | $213 | 72 |
| 965 Prestonwood Ln | 0.02mi | 4/2.0 (+1) | 1,720 (+13%) | 3mo | $259,399 | $151 | 69 |
| 989 Prestonwood Ln | 0.07mi | 4/2.0 (+1) | 1,720 (+13%) | 7mo | $242,499 | $141 | 65 |
| 1945 Autumn Ln | 0.25mi | 4/2.0 (+1) | 1,720 (+13%) | 3mo | $253,399 | $147 | 59 |
| 1940 Autumn Ln | 0.23mi | 3/2.0 | 1,302 (-14%) | 8mo | $232,999 | $179 | 59 |
| 1936 Autumn Ln | 0.22mi | 4/2.0 (+1) | 1,720 (+13%) | 8mo | $254,999 | $148 | 57 |
| 1948 Autumn Ln | 0.24mi | 4/2.0 (+1) | 1,720 (+13%) | 7mo | $243,849 | $142 | 56 |
Match score weights: distance 35% · size 25% · config 20% · recency 20%. Top-matched comps best support the ARV.
Projected returns pro-forma
-3.0% appreciation · 3.0% rent growth · sell at horizon
- IRR
- -18.1%
- Equity multiple
- 0.36×
- Total profit
- $-42,591
- Equity at exit
- $35,592
- IRR
- -10.3%
- Equity multiple
- 0.37×
- Total profit
- $-41,950
- Equity at exit
- $20,639
Cash invested: $66,839 (down + closing). Projections, not guarantees.
Landlord ↔ Tenant lean methodology
- Overall (STATE)
- 87 Strongly Landlord-Friendly
- State Texas
- 87 Strongly Landlord-Friendly · R+5
- County
- — inherits STATE
- City
- — inherits STATE
ZIP-level market 76059
- Home prices YoY
- -7.0%
- Active inventory
- 73
- Price-to-rent
- 9.6×
Monthly cashflow live
- Estimated rent
- $2,073 medium interval (Pro) →
- Mortgage (P&I)
- −$1,252
- Tax est. 1.5%
- −$298 /mo · $3,581/yr
- Insurance
- −$99
- HOA
- −$50
- Vacancy / Maint / Mgmt
- −$435
- Net cashflow
- $-62
Break-even live
UW: 25.0% down · 7.5% · 30yr · 1.5% tax · 5.0% vac · 8.0% maint · 8.0% mgmt
Financing live
Cash to close
- Down payment
- $59,677
- Closing costs
- $7,161
- Reserves months
- —
- Total cash needed
- —
Loan-product check · same deal, 3 products live
Conventional
25% down · 7.5% · 30yr
- Down + closing
- —
- Monthly P&I
- —
- Monthly cashflow
- —
- DSCR
- —
- Eligible?
- —
Personal DTI + credit; lowest rate.
DSCR
20% down · 8.5% · 30yr
- Down + closing
- —
- Monthly P&I
- —
- Monthly cashflow
- —
- DSCR
- —
- Eligible?
- —
No personal income docs; deal must DSCR.
Hard money
10% down · 12.0% · 12mo
- Down + closing
- —
- Monthly P&I
- —
- Monthly cashflow
- —
- DSCR
- —
- Eligible?
- —
Short-term bridge; refi at stabilization.
Rent comps 4 comps
| Address | Beds | Baths | Sqft | Rent | $/sqft | DOM | Units | Dist |
|---|---|---|---|---|---|---|---|---|
| 961 Prestonwood Ln Cleburne, TX | 4.0 | 2.0 | 1760 | $2,245 | $1.28 | 43d | 1 | 0.02mi |
| 27 Blue Star Dr #27 Keene, TX | 3.0 | 2.0 | 1064 | $925 | $0.87 | 43d | 1 | 0.94mi |
| 204 Woodlawn Dr Keene, TX | 4.0 | 3.0 | 1960 | $1,950 | $0.99 | 1d | 1 | 1.00mi |
| 804 Alaska St Keene, TX | 3.0 | 2.0 | 1204 | $1,288 | $1.07 | 1d | 4 | 1.14mi |
HOA detail
- Monthly dues
- $50 · $600/yr
- Likely covers
- water
Listing history 20 events
-
2026-06-18days on market $238,709 Active 47 DOM
-
2026-06-17days on market $238,709 Active 46 DOM
-
2026-06-16days on market $238,709 Active 45 DOM
-
2026-06-15days on market $238,709 Active 44 DOM
-
2026-06-13days on market $238,709 Active 42 DOM
-
2026-06-09days on market $238,709 Active 38 DOM
-
2026-06-08days on market $238,709 Active 37 DOM
-
2026-06-07days on market $238,709 Active 36 DOM
-
2026-06-04days on market $238,709 Active 33 DOM
-
2026-06-03days on market $238,709 Active 32 DOM
-
2026-06-02days on market $238,709 Active 31 DOM
-
2026-06-01days on market $238,709 Active 30 DOM
-
2026-05-31days on market $238,709 Active 29 DOM
-
2026-05-21price $238,709
-
2026-05-20status Active
-
2026-03-20status Pending
-
2026-03-09price $250,999
-
2026-03-09status Active
-
2026-01-16status Pending
-
2026-01-06$243,999 Active
ⓘ Source: listings_history table (triggers on properties + properties_extension) + one-shot
backfill from property_details.listing_events for pre-trigger history.
Nearby sold comps map
Loading sold comps map…
Walkable amenities ~0.75 mi
Loading nearby amenities…
Taxation est. · year 1
- Rental income
- $24,870
- − Mortgage interest
- −$13,371
- − Property taxes
- −$3,581
- − Insurance
- −$1,194
- − Repairs & maintenance
- −$1,990
- − Management
- −$1,990
- − HOA
- −$600
- − Depreciation
- −$6,944
- Taxable loss
- −$4,799
- Est. tax savings @ 24.0%
- +$1,152
- After-tax cash flow
- $403/yr
For passive investors: Depreciation is non-cash, so a rental often shows a tax loss while cash-flowing — sheltering income. Rental losses are passive: they offset passive income freely, and up to $25,000/yr can offset ordinary (W-2) income if you actively participate and your MAGI is under $100k (phasing out to $0 by $150k); unused losses carry forward. On sale, claimed depreciation is recaptured at up to 25%, and gains may owe capital-gains tax (a 1031 exchange can defer both). Figures are a year-1 estimate at your 24.0% rate — not tax advice; consult a CPA.
Schools (NCES district)
- District
- Cleburne ISD
- NCES district ID
- 4814310
- Math proficiency
- 34% ▼ -2.00%
- Reading proficiency
- 33% ▼ -2.00%
- Median HH income
- $48,788
- Composite
- 29.0/100
- National rank
- #6618
- State rank
- #537 of 826 in TX
Livability — Keene
- Score
- 72/100
- State rank
- #249
- US rank
- #5923
Category grades
Schools grade is shown separately in the Schools card above.
Census & demographics
- Census place
- Keene, TX
- City population
- 5,333
- Population (ZIP)
- 5,333
Population outlook (Johnson County) Hauer SSP2
- Today (2025)
- 179,678 people
- By 2030
- 189,208 · +5.3%
- By 2040
- 207,261 · +15.4%
- By 2050
- 223,064 · +24.1%
- By 2075
- 259,979 · +44.7%
- By 2100
- 275,395 · +53.3%
Race, ethnicity, and origin ACS 2023
- Neighborhood character
- Diverse neighborhood (Simpson 0.60)
- Race & ethnicity
- White 54% Hispanic / Latino 32% Two or more races 13% Asian 6% Black 2%
- Hispanic origin (detail)
- Mexican 25% Puerto Rican 2%
- Common ancestry
- Italian 2% Estonian 1% Slovak 1%
- Foreign-born
- 16% · Canada, Dominican Republic
- Languages at home
- 69% English-only · Spanish 27% Tagalog/Filipino 2% Other Indo-European 2%
Political lean MEDSL · Johnson
- 2024 margin
- Solid R (+51.4) · D 23.9% · R 75.3%
- 2008→2024 swing
- -3.9pp toward R · 2008: -47.5pp · 2024: -51.4pp
- All cycles
- 2024: R+51.4 2020: R+53.0 2016: R+58.3 2012: R+55.6 2008: R+47.5
Not yet ingested
- Civics
- —
Market trends
- HPI YoY
- ▼ -17.86%
- Current HPI
- 237.62
- Rent YoY
- —
- Metro
- —
- State GDP YoY
- ▲ 3.95%
- F500 in state
- 110
Industry mix (Fortune 500 HQ in TX)
| Industry | F500 HQs | Revenue |
|---|---|---|
| Energy | 16 | $1,198B |
|
||
| Technology | 5 | $198B |
|
||
| Engineering / Construction | 4 | $72B |
|
||
| Energy Services | 3 | $60B |
|
||
| Utilities | 3 | $41B |
|
||
| Healthcare | 2 | $330B |
|
||
Price history
-2.2% since first listed7 events — show timeline
- 2026-05-21 Price Changed $238,709 NTREIS
- 2026-05-20 Relisted — NTREIS
- 2026-03-20 Pending — NTREIS
- 2026-03-09 Price Changed $250,999 NTREIS
- 2026-03-09 Relisted — NTREIS
- 2026-01-16 Pending — NTREIS
- 2026-01-06 Listed $243,999 NTREIS
Cash-flow waterfall
monthlySold comps — $/sqft
last 12 mo · ≤1 miLoading sold comps…