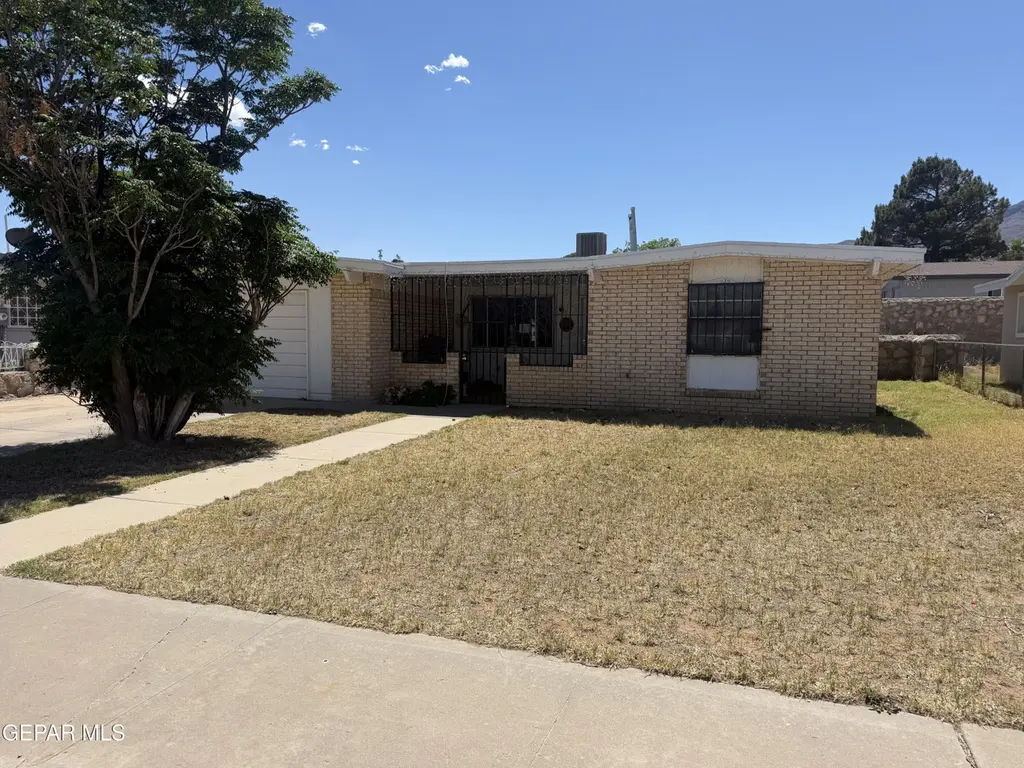
10429 Cronus Dr · El Paso, TX
Flood risk 9/10 · Severe
- FEMA flood zone
- X
- Chance of flooding over 30 yrs
- 0.99%
- Est. flood insurance / yr
- $507 – $1,088
Fire risk 4/10 · Minor
- Est. fire insurance / yr
- $1,222 – $2,270
Heat risk 6/10 · Moderate
- Hot days now (above 100°F)
- 8 days/yr
- Hot days in 30 yrs
- 29 days/yr
Wind risk 1/10 · Minimal
- Chance of severe wind over 30 yrs
- —
Air-quality risk 3/10 · Minor
- Unhealthy air days now
- 2 days/yr
- Unhealthy air days in 30 yrs
- 2 days/yr
Risk factors via First Street. Map © Google.
Why this score? — see what drove the C- grade
The composite is a weighted blend of 9 inputs, each scored 0–100. Each bar is that input's sub-score; the figure is the points it added to the 100-point composite (weight × sub-score).
- Cash flow +15.9/30.0
- ARV discount +15.0/15.0
- 1% rule +5.6/10.0
- DSCR +4.9/10.0
- Livability +4.0/5.0
- Rent growth +3.6/5.0
- Schools +2.7/10.0
- Condition / age +2.5/5.0
- Appreciation +0.0/10.0
$150,000
🖨 Deal sheet (PDF) 📄 Offer letter ✓ Due diligence
Listing remarks
Cash buyers and investors, look no further! This just listed in El Paso property is the perfect addition to your portfolio, offering an incredible opportunity for a profitable fix-and-flip or a high-yielding rental. Located in a highly desirable area, this North East home for sale boasts massive value-add potential. The heavy lifting has already been done! This home features a brand-new roof, a newly installed water heater, and a new refrigerated AC and furnace system, saving you thousands in upfront capital expenditures. The layout includes 3 bedrooms, plus an excellent garage conversion equipped with its own private entry/exit--perfect for a 4th bedroom or maximizing rental income. Situat
Key facts
- Expansive bonus room
- Garage conversion
- Flexible layout
Tags
Property features AI
Finance
- HOA & community: No HOA fee inclusions
Exterior
- Home design: Single family residence; Pitched roof
- Construction: Brick construction
- Exterior features: See remarks; Back yard fencing; Open patio/porch
Interior
- Kitchen: See remarks
- Flooring: See remarks
- Bathrooms: 2 full bathrooms; 1 three-quarter bathroom
- Fireplace: 1 fireplace
- Heating & cooling: Central heating; Refrigerated cooling
- Interior features: See remarks
Neighborhood map
What this means for you Summary
Snapshot
- This is a 3-bed/2.0-bath single-family listed at $150k.
Deal economics
- At list price, monthly cash flow is $5 ($56/yr) — positive.
- The deal already cash-flows at list — no discount required.
- Meets the 1% rule at list price ($2k rent vs $150k).
Location & tenants
- Location reads 81/100 on livability (#23 in TX, #1,375 nationally) — a professional / high-income tenant draw. Strengths: commute A+, cost of living A+, housing A+; Watch: employment D+.
- El Paso ISD (urban): math 27% / reading 37% proficiency, ranked #591 of 826 in TX (top 72%) — families likely to look elsewhere, expect single-tenant / working-renter base with shorter leases; 65% free/reduced lunch — lower-income household profile, screen leases tightly.
- Zoned schools: Charles Middle (math 25% / reading 34%, grade F, #1,077 of 1,662 statewide, top 66%, 450 students, 84% FRL); Andress H S (math 19% / reading 34%, grade F, #1,228 of 1,632 statewide, top 76%, 1,530 students, 83% FRL) — zoned schools average 84% FRL vs 65% district-wide (19 pts higher); higher-poverty schools than district average — tighter screening recommended.
- Market conditions: Rents rising fast (+4.5%/yr); 248 active listings in the ZIP; 30 comparable units currently listed for rent nearby; rentals at typical pace (median 26d on market — plan ~3-4 weeks tenant-placement turnaround); 2,196 units permitted in El Paso County in 2024 (143 in 5+ unit buildings).
- This rent runs 33% of the median local income ($57k/yr) — at the standard rent-burdened threshold; future hikes will face affordability resistance.
Forward outlook
- Local home prices are declining (-3.0%/yr); year-one equity from $1k of loan paydown is wiped out by about $4k of value loss. Plan a longer hold.
- El Paso County population projected at +10% by 2050 — modest demand growth; plan on rents tracking national, not racing it.
Negotiation context
- Only 5 days on market — expect competitive offers; lowballing is unlikely to land.
- 5 sale attempts since 26y ago with the ask held roughly flat each time — persistent listings suggest the price (not the market) is what's stuck; bring a comps-based counter.
- Current owner paid $37k; list at $150k implies a 305% gain — meaningful room to come down on a strong offer.
Risks & watch-outs
- Watch-outs: property tax is 2.7% of price; flood insurance adds $66/mo.
- Climate carrying-cost: severe flood risk; extreme-heat days projected 8→29/yr by 2055 (HVAC capex compounding) — expect insurance premiums to compound above CPI over the hold.
Questions for the listing agent
- Built in 1975 — when were the roof, HVAC, electrical panel, plumbing, and water heater last replaced?
- Property tax is high relative to price — has the assessment been appealed recently, and will the sale trigger a re-assessment?
- What's the actual annual flood-insurance premium (NFIP or private), and is the property in a SFHA with mandatory coverage?
- Is there a deadline driving the sale (1031 exchange, divorce, estate, relocation)? That informs how much negotiation room exists.
- Schools are B-rated — typically a magnet for longer-tenancy family renters. What's the average tenant stay here, and is there a school-zone premium baked into asking?
- What's the average days-on-market for RENTAL listings here right now (not sales)? A rising rental-DOM trend means longer vacancies and softer asking-rent achievability than the comps imply.
- What's the recent tenant-quality profile in this submarket — average credit score on applications, eviction rate, late-payment / NSF rate, and stable-employment percentage? A property-management company in the area should have these aggregated.
- How much new for-sale + rental construction is in the pipeline within 1–3 miles? Heavy new supply typically softens prices + rents 12–24 months out; constrained supply supports both.
Investment metrics
- 1% rule
- 1.06% ✓
- Cap rate
- 6.86%
- Cash-on-cash
- 2.03%
- DSCR
- 1.09
- GRM
- 7.9
CMA / ARV
- ARV (on-the-fly)
- $202,248
- Comps found
- 2
Show comp detail 2 sales within ~0.75 mi
| Address | Dist | Beds/Ba | Sqft | Sold | Price | $/sf | Match |
|---|---|---|---|---|---|---|---|
| 4800 Trojan Dr | 0.23mi | 3/2.0 | 1,450 (+14%) | 0mo | $230,000 | $159 | 66 |
| 5201 Capistrano Dr | 0.55mi | 3/1.0 | 1,092 (-14%) | 8mo | $170,000 | $156 | 40 |
Match score weights: distance 35% · size 25% · config 20% · recency 20%. Top-matched comps best support the ARV.
Projected returns pro-forma
-3.0% appreciation · 4.5% rent growth · sell at horizon
- IRR
- -14.0%
- Equity multiple
- 0.49×
- Total profit
- $-21,421
- Equity at exit
- $22,365
- IRR
- -2.4%
- Equity multiple
- 0.82×
- Total profit
- $-7,352
- Equity at exit
- $12,969
Cash invested: $42,000 (down + closing). Projections, not guarantees.
Landlord ↔ Tenant lean methodology
- Overall (STATE)
- 87 Strongly Landlord-Friendly
- State Texas
- 87 Strongly Landlord-Friendly · R+5
- County
- — inherits STATE
- City
- — inherits STATE
ZIP-level market 79924
- Home prices YoY
- -13.2%
- Rents YoY
- 4.5%
- Active inventory
- 248
- Price-to-rent
- 7.9×
Monthly cashflow live
- Estimated rent
- $1,587 high interval (Pro) →
- Mortgage (P&I)
- −$787
- Tax from tax record
- −$334 /mo · $4,005/yr
- Insurance
- −$62
- Flood insurance flood zone
- −$66 /mo · $798/yr
- HOA
- −$0
- Vacancy / Maint / Mgmt
- −$333
- Net cashflow
- $5
Break-even live
Sensitivity live
| Price | -10% $90 | -5% $47 | +0% $5 | +5% $-38 | +10% $-80 |
|---|---|---|---|---|---|
| Rent | -10% $-121 | -5% $-58 | +0% $5 | +5% $67 | +10% $130 |
| Rate | -1.0pp $80 | -0.5pp $43 | base $5 | +0.5pp $-34 | +1.0pp $-74 |
UW: 25.0% down · 7.5% · 30yr · 1.5% tax · 5.0% vac · 8.0% maint · 8.0% mgmt
Financing live
Cash to close
- Down payment
- $37,500
- Closing costs
- $4,500
- Reserves months
- —
- Total cash needed
- —
Loan-product check · same deal, 3 products live
Conventional
25% down · 7.5% · 30yr
- Down + closing
- —
- Monthly P&I
- —
- Monthly cashflow
- —
- DSCR
- —
- Eligible?
- —
Personal DTI + credit; lowest rate.
DSCR
20% down · 8.5% · 30yr
- Down + closing
- —
- Monthly P&I
- —
- Monthly cashflow
- —
- DSCR
- —
- Eligible?
- —
No personal income docs; deal must DSCR.
Hard money
10% down · 12.0% · 12mo
- Down + closing
- —
- Monthly P&I
- —
- Monthly cashflow
- —
- DSCR
- —
- Eligible?
- —
Short-term bridge; refi at stabilization.
Rent comps 30 comps
| Address | Beds | Baths | Sqft | Rent | $/sqft | DOM | Units | Dist |
|---|---|---|---|---|---|---|---|---|
| 10429 Persephone Dr El Paso, TX | 4.0 | 2.0 | 1238 | $1,790 | $1.45 | 5d | 1 | 0.17mi |
| 10452 Persephone Dr El Paso, TX | 3.0 | 2.0 | 1014 | $1,250 | $1.23 | 16d | 1 | 0.17mi |
| 10521 Gala Pl El Paso, TX | 3.0 | 2.0 | 1346 | $1,485 | $1.10 | 45d | 1 | 0.32mi |
| 5012 Salem Dr El Paso, TX | 3.0 | 2.0 | 1306 | $1,850 | $1.42 | 25d | 1 | 0.34mi |
| 4917 Royal Dr El Paso, TX | 3.0 | 2.0 | 1034 | $1,425 | $1.38 | 25d | 1 | 0.43mi |
| 4713 Harvest Ln El Paso, TX | 3.0 | 2.0 | 1220 | $1,475 | $1.21 | 25d | 1 | 0.61mi |
| 10345 Biscaine St El Paso, TX | 4.0 | 2.0 | 1778 | $1,675 | $0.94 | 25d | 1 | 0.65mi |
| 5140 Tropicana Ave El Paso, TX | 3.0 | 1.0 | 998 | $1,100 | $1.10 | 13d | 1 | 0.75mi |
| 5140 Tropicana Ave El Paso, TX | 3.0 | 1.0 | 998 | $1,050 | $1.05 | 5d | 1 | 0.75mi |
| 10899 Northview Dr El Paso, TX | 3.0 | 2.0 | 1532 | $1,500 | $0.98 | 25d | 1 | 0.95mi |
| 5205 Nome Ave El Paso, TX | 4.0 | 2.0 | 1788 | $1,995 | $1.12 | 25d | 1 | 0.97mi |
| 10909 Northview Dr El Paso, TX | 4.0 | 2.0 | 1473 | $1,850 | $1.26 | 16d | 1 | 1.00mi |
| 10720 McAllen Pl El Paso, TX | 3.0 | 2.0 | 1134 | $1,500 | $1.32 | 25d | 1 | 1.04mi |
| 10037 Oakwood Dr El Paso, TX | 3.0 | 1.5 | 1039 | $1,200 | $1.15 | 45d | 1 | 1.11mi |
| 10708 Levelland Pl El Paso, TX | 3.0 | 2.0 | 1064 | $1,400 | $1.32 | 45d | 1 | 1.15mi |
| 10708 Levelland Pl El Paso, TX | 3.0 | 2.0 | 1064 | $1,400 | $1.32 | 16d | 1 | 1.15mi |
| 10004 Odessa Ln El Paso, TX | 4.0 | 2.0 | 1770 | $1,495 | $0.84 | 45d | 1 | 1.15mi |
| 10983 Duke Snider Cir El Paso, TX | 4.0 | 2.0 | 1760 | $1,850 | $1.05 | 45d | 1 | 1.23mi |
| 10344 Redwood St El Paso, TX | 3.0 | 2.0 | 1179 | $1,275 | $1.08 | 25d | 1 | 1.24mi |
| 10902 Yogi Berra Dr El Paso, TX | 3.0 | 2.0 | 1167 | $1,300 | $1.11 | 25d | 1 | 1.26mi |
| 5613 Creston Ave El Paso, TX | 3.0 | 2.0 | 1364 | $1,550 | $1.14 | 5d | 1 | 1.27mi |
| 10969 Duke Snider Cir El Paso, TX | 3.0 | 2.0 | 1003 | $1,385 | $1.38 | 13d | 1 | 1.28mi |
| 10948 Casey Stengel Pl El Paso, TX | 3.0 | 2.0 | 1304 | $1,625 | $1.25 | 45d | 1 | 1.28mi |
| 5732 Arrowhead Dr El Paso, TX | 3.0 | 1.0 | 957 | $1,175 | $1.23 | 45d | 1 | 1.30mi |
| 5741 Arrowhead Dr El Paso, TX | 3.0 | 2.0 | 1080 | $1,175 | $1.09 | 45d | 1 | 1.31mi |
| 10901 Joe Dimaggio Cir El Paso, TX | 4.0 | 2.0 | 1400 | $1,750 | $1.25 | 23d | 1 | 1.34mi |
| 5516 Fairbanks Dr El Paso, TX | 3.0 | 2.0 | 1303 | $1,500 | $1.15 | 45d | 1 | 1.35mi |
| 5104 Paris Ave El Paso, TX | 3.0 | 2.0 | 1196 | $1,495 | $1.25 | 5d | 1 | 1.39mi |
| 10096 Ontario St El Paso, TX | 4.0 | 2.0 | 1774 | $1,859 | $1.05 | 45d | 1 | 1.41mi |
| 5845 Wrangler Dr El Paso, TX | 3.0 | 1.5 | 1196 | $1,550 | $1.30 | 25d | 1 | 1.46mi |
Listing history 6 events
-
2026-06-07statusdays on market $150,000 Pending 5 DOM
-
2026-06-05days on market $150,000 Active 4 DOM
-
2026-06-03days on market $150,000 Active 3 DOM
-
2026-06-03days on market $150,000 Active 2 DOM
-
2026-06-01remarks 699-char remark
-
2026-06-01$150,000 Active 1 DOM
ⓘ Source: listings_history table (triggers on properties + properties_extension) + one-shot
backfill from property_details.listing_events for pre-trigger history.
Tax reassessment forecast TX · Resets to sale price
- Current annual tax
- $4,005 · $334/mo
- Projected year-2 tax
- $4,005 · $334/mo
- Expected delta
- $0/yr ($0/mo · 0.0%)
ⓘ Screening estimate from a state-policy table — verify with the county assessor before closing.
Climate risk First Street
- Flood 9/10 Extreme FEMA zone X · 99% chance over 30 yrs
- Wildfire 4/10 Moderate
- Heat 6/10 Major 8 d/yr ≥100°F today · 29 d/yr by 30 yrs out
- Wind 1/10 Low
- Air quality 3/10 Moderate 2 unhealthy d/yr today · 2 by 30 yrs out
Nearby sold comps map
Loading sold comps map…
Walkable amenities ~0.75 mi
Loading nearby amenities…
Taxation est. · year 1
- Rental income
- $19,048
- − Mortgage interest
- −$8,402
- − Property taxes
- −$4,005
- − Insurance
- −$1,547
- − Repairs & maintenance
- −$1,524
- − Management
- −$1,524
- − Depreciation
- −$4,364
- Taxable loss
- −$2,318
- Est. tax savings @ 24.0%
- +$556
- After-tax cash flow
- $613/yr
For passive investors: Depreciation is non-cash, so a rental often shows a tax loss while cash-flowing — sheltering income. Rental losses are passive: they offset passive income freely, and up to $25,000/yr can offset ordinary (W-2) income if you actively participate and your MAGI is under $100k (phasing out to $0 by $150k); unused losses carry forward. On sale, claimed depreciation is recaptured at up to 25%, and gains may owe capital-gains tax (a 1031 exchange can defer both). Figures are a year-1 estimate at your 24.0% rate — not tax advice; consult a CPA.
Schools (NCES district)
- District
- El Paso ISD
- NCES district ID
- 4818300
- Math proficiency
- 27% ▼ -24.00%
- Reading proficiency
- 37% ▼ -7.00%
- Median HH income
- $38,704
- Composite
- 26.75/100
- National rank
- #7138
- State rank
- #591 of 826 in TX
Livability — El Paso
- Score
- 81/100
- State rank
- #23
- US rank
- #1375
Category grades
Schools grade is shown separately in the Schools card above.
Census & demographics
- Census place
- El Paso, TX
- County
- El Paso County · 761,266 people
- City population
- 630,223
- Metro
- El Paso, TX
- Population (ZIP)
- 60,364
- Household income
- $56,976
- Rent vs Own
- Severe rent burden
- 1903.0
Population outlook (El Paso County) Hauer SSP2
- Today (2025)
- 897,899 people
- By 2030
- 922,694 · +2.8%
- By 2040
- 960,492 · +7.0%
- By 2050
- 982,919 · +9.5%
- By 2075
- 997,266 · +11.1%
- By 2100
- 900,630 · +0.3%
Race, ethnicity, and origin ACS 2023
- Neighborhood character
- Predominantly Hispanic (72%)
- Race & ethnicity
- Hispanic / Latino 72% Two or more races 35% White 16% Black 7% Asian 1% Native American 1%
- Hispanic origin (detail)
- Mexican 66% Puerto Rican 2%
- Common ancestry
- Lithuanian 1% Italian 1% Romanian 1%
- Foreign-born
- 19% · Canada, South Korea
- Languages at home
- 42% English-only · Spanish 56% German/W. Germanic 1% Korean 1%
Political lean MEDSL · El Paso
- 2024 margin
- D (+15.1) · D 57.0% · R 41.8% · Other 1.2%
- 2008→2024 swing
- -17.4pp toward R · 2008: 32.5pp · 2024: 15.1pp
- All cycles
- 2024: D+15.1 2020: D+35.1 2016: D+43.2 2012: D+32.6 2008: D+32.5
Not yet ingested
- Civics
- —
Market trends
- HPI YoY
- ▼ -40.46%
- Current HPI
- 265.8729
- Rent YoY
- ▲ 4.50%
- Metro
- El Paso, TX
- State GDP YoY
- ▲ 3.95%
- F500 in state
- 110
Industry mix (Fortune 500 HQ in TX)
| Industry | F500 HQs | Revenue |
|---|---|---|
| Energy | 16 | $1,198B |
|
||
| Technology | 5 | $198B |
|
||
| Engineering / Construction | 4 | $72B |
|
||
| Energy Services | 3 | $60B |
|
||
| Utilities | 3 | $41B |
|
||
| Healthcare | 2 | $330B |
|
||
Price history
+305.4% since first listed14 events — show timeline
- 2026-05-30 Listed $150,000 GEPARMLS
- 2026-03-09 Listing Removed — GEPARMLS
- 2026-02-23 Relisted — GEPARMLS
- 2026-02-23 Price Changed $149,000 GEPARMLS
- 2026-02-05 Contingent — GEPARMLS
- 2026-01-31 Listed $149,888 GEPARMLS
- 2019-06-05 Sold (Public Records) — Public Records
- 2018-12-06 Listing Removed — GEPARMLS
- 2006-05-23 Sold (Public Records) — Public Records
- 2002-03-15 Sold (Public Records) — Public Records
- 2002-01-05 Listed $60,000 GEPARMLS
- 2000-11-17 Listed $61,900 GEPARMLS
- 1979-06-01 Sold (Public Records) $37,000 Public Records
- 1977-07-04 Sold (Public Records) — Public Records
Property tax history
+4.8%/yrLatest (2025): $4,005 · +12.0% YoY. Source: county tax records.
Cash-flow waterfall
monthlySold comps — $/sqft
last 12 mo · ≤1 miLoading sold comps…