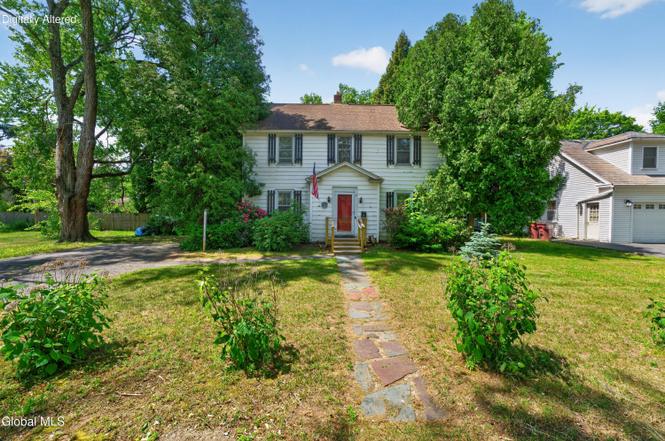
2 Providence St · Albany, NY
Flood risk 1/10 · Minimal
- FEMA flood zone
- X (unshaded)
- Chance of flooding over 30 yrs
- 0.0%
- Est. flood insurance / yr
- $473 – $860
Fire risk 2/10 · Minimal
- Est. fire insurance / yr
- $691 – $1,283
Heat risk 4/10 · Minor
- Hot days now (above 98°F)
- 7 days/yr
- Hot days in 30 yrs
- 16 days/yr
Wind risk 3/10 · Minor
- Chance of severe wind over 30 yrs
- 6.0%
Air-quality risk 1/10 · Minimal
- Unhealthy air days now
- 0 days/yr
- Unhealthy air days in 30 yrs
- 0 days/yr
Risk factors via First Street. Map © Google.
Why this score? — see what drove the C grade
The composite is a weighted blend of 9 inputs, each scored 0–100. Each bar is that input's sub-score; the figure is the points it added to the 100-point composite (weight × sub-score).
- Cash flow +19.6/30.0
- ARV discount +7.5/15.0
- 1% rule +7.0/10.0
- DSCR +6.2/10.0
- Schools +5.7/10.0
- Livability +4.0/5.0
- Rent growth +3.0/5.0
- Condition / age +2.5/5.0
- Appreciation +0.0/10.0
$200,000
🖨 Deal sheet (PDF) 📄 Offer letter ✓ Due diligence
Listing remarks
* * Multiple offers received. Best & Final requested Sunday, 6/14 noon * * * Opportunity knocks in one of Guilderland's most sought-after locations! This classic 1930s Colonial presents an excellent opportunity for investors, flippers, or buyers looking to restore a home to its former glory. Owned by the same family for many years, the property retains its original character, including built ins, hardwood floors throughout and a full walk-up attic offering additional possibilities. Featuring 3 bedrooms, 1.5 bathrooms, and timeless charm, this home is ready for a complete renovation and is priced accordingly. Located in the highly regarded Guilderland Central School District, just m
Key facts
- Built ins
- Full walk-up attic
- Hardwood floors
Tags
Property features AI
Exterior
- Parking: Paved driveway with room for 6 vehicles
- Utilities: 150 Amp electric service; Public water; Public sewer; Cable connected
- Home design: Single family residence; Fixer condition; Concrete perimeter foundation; Wood siding construction; Asphalt roof
- Construction: Built with wood siding; Concrete perimeter foundation; Asphalt roof
- Exterior features: Enclosed rear porch; Paved driveway; Back yard fencing
Interior
- Kitchen: Freezer; Refrigerator
- Bedrooms: Primary bedroom on second floor; Two additional bedrooms on second floor
- Flooring: Tile; Hardwood
- Bathrooms: One full bathroom on second floor; One half bathroom on first floor
- Heating & cooling: Natural gas heating
- Interior features: Built-in features; Ceramic tile bath; Full basement; Living room fireplace
- Laundry & utility: Laundry in basement
Neighborhood map
What this means for you Summary
Snapshot
- This is a 3-bed/1.5-bath single-family listed at $200k.
Deal economics
- At list price, monthly cash flow is $229 ($3k/yr) — positive.
- The deal already cash-flows at list — no discount required.
- Meets the 1% rule at list price ($2k rent vs $200k).
- Cap rate 7.7% vs local median 5.7% in Albany — top-decile yield for the area; either an underpriced asset or a hidden risk that comps aren't pricing in. Stress-test before assuming the spread holds.
Location & tenants
- Location reads 79/100 on livability (#129 in NY, #2,083 nationally) — a middle-class / working-renter tenant base. Strengths: amenities A+, commute A+, housing A+; Watch: employment C-, crime F.
- Guilderland Central School District (suburban): math 61% / reading 68% proficiency, ranked #166 of 590 in NY (top 28%) — acceptable for families but not a draw, mixed tenant base, ~2y average lease; only 10% free/reduced lunch — higher-income household profile.
- Zoned schools: Westmere Elementary School (math 52% / reading 62%, grade C+, #842 of 2,108 statewide, top 43%, 539 students, 26% FRL); Farnsworth Middle School (math 42% / reading 68%, grade B-, #212 of 729 statewide, top 29%, 1,151 students, 24% FRL); Guilderland High School (math 97% / reading 82%, grade A+, #265 of 1,100 statewide, top 26%, 1,462 students, 23% FRL).
- Market conditions: Rents rising (+1.9%/yr); 127 active listings in the ZIP; 8 comparable units currently listed for rent nearby; rentals at typical pace (median 23d on market — plan ~3-4 weeks tenant-placement turnaround); solid renter incomes; 675 units permitted in Albany County in 2024 (451 in 5+ unit buildings).
- This rent runs 35% of the median local income ($83k/yr) — at the standard rent-burdened threshold; future hikes will face affordability resistance.
Forward outlook
- Local home prices are declining (-3.0%/yr); year-one equity from $1k of loan paydown is wiped out by about $6k of value loss. Plan a longer hold.
- Albany County population projected at +9% by 2050 — modest demand growth; plan on rents tracking national, not racing it.
Negotiation context
- Only 6 days on market — expect competitive offers; lowballing is unlikely to land.
Risks & watch-outs
- Watch-outs: property tax is 3.2% of price; built in 1934 — expect roof / HVAC / electrical / plumbing capex.
Questions for the listing agent
- Built in 1934 — when were the roof, HVAC, electrical panel, plumbing, and water heater last replaced?
- Property tax is high relative to price — has the assessment been appealed recently, and will the sale trigger a re-assessment?
- Is there a deadline driving the sale (1031 exchange, divorce, estate, relocation)? That informs how much negotiation room exists.
- Crime grade is F in this area — have there been break-ins, vandalism, or insurance claims at this property in the last 3 years? What carrier currently insures it and at what premium?
- What's the average days-on-market for RENTAL listings here right now (not sales)? A rising rental-DOM trend means longer vacancies and softer asking-rent achievability than the comps imply.
- What's the recent tenant-quality profile in this submarket — average credit score on applications, eviction rate, late-payment / NSF rate, and stable-employment percentage? A property-management company in the area should have these aggregated.
- How much new for-sale + rental construction is in the pipeline within 1–3 miles? Heavy new supply typically softens prices + rents 12–24 months out; constrained supply supports both.
Investment metrics
- 1% rule
- 1.20% ✓
- Cap rate
- 7.67%
- Cash-on-cash
- 4.91%
- DSCR
- 1.22
- GRM
- 6.9
CMA / ARV
- ARV (on-the-fly)
- $425,472
- Comps found
- 8
Show comp detail 8 sales within ~0.75 mi
| Address | Dist | Beds/Ba | Sqft | Sold | Price | $/sf | Match |
|---|---|---|---|---|---|---|---|
| 22 Elmwood St | 0.11mi | 3/1.5 | 1,560 (-6%) | 15mo | $349,900 | $224 | 72 |
| 27 E Parkwood St | 0.19mi | 3/1.5 | 1,570 (-6%) | 13mo | $375,000 | $239 | 71 |
| 58 E Highland Dr | 0.38mi | 3/2.0 | 1,557 (-6%) | 2mo | $350,000 | $225 | 68 |
| 18 E Highland Dr | 0.48mi | 3/2.0 | 1,651 (-1%) | 14mo | $425,000 | $257 | 62 |
| 1449 Western Ave | 0.30mi | 4/2.0 (+1) | 1,655 (-0%) | 21mo | $335,000 | $202 | 61 |
| 20 E Highland Dr | 0.48mi | 3/2.5 | 1,552 (-7%) | 11mo | $432,000 | $278 | 53 |
| 31 Tryon Ct | 0.73mi | 3/2.0 | 1,504 (-10%) | 9mo | $385,000 | $256 | 40 |
| 203 Woodscape Dr | 0.75mi | 4/2.0 (+1) | 1,512 (-9%) | 5mo | $420,000 | $278 | 38 |
Match score weights: distance 35% · size 25% · config 20% · recency 20%. Top-matched comps best support the ARV.
Projected returns pro-forma
-3.0% appreciation · 1.85% rent growth · sell at horizon
- IRR
- -10.1%
- Equity multiple
- 0.64×
- Total profit
- $-20,366
- Equity at exit
- $29,821
- IRR
- -2.6%
- Equity multiple
- 0.84×
- Total profit
- $-9,129
- Equity at exit
- $17,292
Cash invested: $56,000 (down + closing). Projections, not guarantees.
Landlord ↔ Tenant lean methodology
- Overall (STATE)
- 15 Strongly Tenant-Friendly
- State New York
- 15 Strongly Tenant-Friendly · D+10
- County
- — inherits STATE
- City
- — inherits STATE
ZIP-level market 12203
- Home prices YoY
- -31.0%
- Rents YoY
- 1.9%
- Active inventory
- 127
- Price-to-rent
- 6.9×
Monthly cashflow live
- Estimated rent
- $2,409 high interval (Pro) →
- Mortgage (P&I)
- −$1,049
- Tax from tax record
- −$542 /mo · $6,500/yr
- Insurance
- −$83
- HOA
- −$0
- Vacancy / Maint / Mgmt
- −$506
- Net cashflow
- $229
Break-even live
Sensitivity live
| Price | -10% $342 | -5% $286 | +0% $229 | +5% $172 | +10% $116 |
|---|---|---|---|---|---|
| Rent | -10% $39 | -5% $134 | +0% $229 | +5% $324 | +10% $419 |
| Rate | -1.0pp $330 | -0.5pp $280 | base $229 | +0.5pp $177 | +1.0pp $124 |
UW: 25.0% down · 7.5% · 30yr · 1.5% tax · 5.0% vac · 8.0% maint · 8.0% mgmt
Financing live
Cash to close
- Down payment
- $50,000
- Closing costs
- $6,000
- Reserves months
- —
- Total cash needed
- —
Loan-product check · same deal, 3 products live
Conventional
25% down · 7.5% · 30yr
- Down + closing
- —
- Monthly P&I
- —
- Monthly cashflow
- —
- DSCR
- —
- Eligible?
- —
Personal DTI + credit; lowest rate.
DSCR
20% down · 8.5% · 30yr
- Down + closing
- —
- Monthly P&I
- —
- Monthly cashflow
- —
- DSCR
- —
- Eligible?
- —
No personal income docs; deal must DSCR.
Hard money
10% down · 12.0% · 12mo
- Down + closing
- —
- Monthly P&I
- —
- Monthly cashflow
- —
- DSCR
- —
- Eligible?
- —
Short-term bridge; refi at stabilization.
Rent comps 8 comps
| Address | Beds | Baths | Sqft | Rent | $/sqft | DOM | Units | Dist |
|---|---|---|---|---|---|---|---|---|
| 55 Woodlake Rd Albany, NY | 1.0–2.0 | 1.0–2.0 | 903 | $2,050 | $2.27 | 15d | 1 | 0.62mi |
| 416 Greenhill Ct Albany, NY | 2.0 | 1.5 | 1350 | $2,200 | $1.63 | 45d | 1 | 0.90mi |
| 62 Homestead St Albany, NY | 4.0 | 2.0 | 1600 | $2,600 | $1.62 | 45d | 1 | 0.97mi |
| 1700 Western Ave Albany, NY | 1.0–2.0 | 1.0–2.0 | 1438 | $2,500 | $1.74 | 15d | 1 | 1.04mi |
| 32 Moreland Ave Unit NA Albany, NY | 3.0 | 1.5 | 1500 | $2,300 | $1.53 | 22d | 1 | 1.17mi |
| 1000 Apex Ln Albany, NY | 1.0–3.0 | 1.0–2.0 | 1525 | $4,175 | $2.74 | 15d | 29 | 1.21mi |
| 23 The Concourse Unit 21 Albany, NY | 2.0 | 1.0 | 1200 | $2,000 | $1.67 | 15d | 1 | 1.38mi |
| 35 Cherry St Apt B Albany, NY | 2.0 | 1.0 | 1400 | $1,800 | $1.29 | 45d | 1 | 1.38mi |
Listing history 4 events
-
2026-06-16statusdays on market $200,000 Pending 6 DOM
-
2026-06-15days on market $200,000 Active 5 DOM
-
2026-06-14remarks 695-char remark
-
2026-06-14$200,000 Active 3 DOM
ⓘ Source: listings_history table (triggers on properties + properties_extension) + one-shot
backfill from property_details.listing_events for pre-trigger history.
Tax reassessment forecast NY · Partial reset (capped growth)
- Current annual tax
- $6,500 · $542/mo
- Projected year-2 tax
- $6,500 · $542/mo
- Expected delta
- $0/yr ($0/mo · 0.0%)
ⓘ Screening estimate from a state-policy table — verify with the county assessor before closing.
Climate risk First Street
- Flood 1/10 Low FEMA zone X (unshaded) · 0% chance over 30 yrs
- Wildfire 2/10 Low
- Heat 4/10 Moderate 7 d/yr ≥98°F today · 16 d/yr by 30 yrs out
- Wind 3/10 Moderate 6% chance of damaging wind over 30 yrs
- Air quality 1/10 Low 0 unhealthy d/yr today · 0 by 30 yrs out
Nearby sold comps map
Loading sold comps map…
Walkable amenities ~0.75 mi
Loading nearby amenities…
Taxation est. · year 1
- Rental income
- $28,903
- − Mortgage interest
- −$11,203
- − Property taxes
- −$6,500
- − Insurance
- −$1,000
- − Repairs & maintenance
- −$2,312
- − Management
- −$2,312
- − Depreciation
- −$5,818
- Taxable loss
- −$243
- Est. tax savings @ 24.0%
- +$58
- After-tax cash flow
- $2,806/yr
For passive investors: Depreciation is non-cash, so a rental often shows a tax loss while cash-flowing — sheltering income. Rental losses are passive: they offset passive income freely, and up to $25,000/yr can offset ordinary (W-2) income if you actively participate and your MAGI is under $100k (phasing out to $0 by $150k); unused losses carry forward. On sale, claimed depreciation is recaptured at up to 25%, and gains may owe capital-gains tax (a 1031 exchange can defer both). Figures are a year-1 estimate at your 24.0% rate — not tax advice; consult a CPA.
Schools (NCES district)
- District
- Guilderland Central School District
- NCES district ID
- 3613080
- Math proficiency
- 61% ▼ -8.00%
- Reading proficiency
- 68% ▲ 5.00%
- Median HH income
- $75,669
- Composite
- 57.24/100
- National rank
- #1093
- State rank
- #166 of 590 in NY
Livability — Albany
- Score
- 79/100
- State rank
- #129
- US rank
- #2083
Category grades
Schools grade is shown separately in the Schools card above.
Census & demographics
- County
- Albany County · 196,626 people
- City population
- 116,921
- Metro
- Albany-Schenectady-Troy, NY
- Population (ZIP)
- 30,771
- Household income
- $83,147
- Rent vs Own
- Severe rent burden
- 1704.0
Population outlook (Albany County) Hauer SSP2
- Today (2025)
- 320,794 people
- By 2030
- 327,401 · +2.1%
- By 2040
- 338,218 · +5.4%
- By 2050
- 348,467 · +8.6%
- By 2075
- 381,693 · +19.0%
- By 2100
- 393,809 · +22.8%
Race, ethnicity, and origin ACS 2023
- Neighborhood character
- Predominantly White (69%)
- Race & ethnicity
- White 69% Black 10% Asian 8% Hispanic / Latino 7% Two or more races 7%
- Hispanic origin (detail)
- Mexican 2% Puerto Rican 2%
- Common ancestry
- Romanian 5% Lithuanian 3% Slovak 2%
- Foreign-born
- 16% · Canada, China, South Korea
- Languages at home
- 82% English-only · Other Indo-European 6% Spanish 3% Russian/Polish/Slavic 2%
Political lean MEDSL · Albany
- 2024 margin
- Strong D (+25.8) · D 62.9% · R 37.1%
- 2008→2024 swing
- -3.6pp toward R · 2008: 29.4pp · 2024: 25.8pp
- All cycles
- 2024: D+25.8 2020: D+31.4 2016: D+24.3 2012: D+31.0 2008: D+29.4
Not yet ingested
- Civics
- —
Market trends
- HPI YoY
- ▼ -133.05%
- Current HPI
- 296.0467
- Rent YoY
- ▲ 1.85%
- Metro
- Albany-Schenectady-Troy, NY
- State GDP YoY
- ▲ 2.60%
- F500 in state
- 92
Industry mix (Fortune 500 HQ in NY)
| Industry | F500 HQs | Revenue |
|---|---|---|
| Financial Services | 10 | $950B |
|
||
| Consumer Goods | 9 | $162B |
|
||
| Insurance | 4 | $225B |
|
||
| Telecommunications | 2 | $144B |
|
||
| Pharmaceuticals | 2 | $112B |
|
||
| Media / Entertainment | 2 | $69B |
|
||
Price history
1 event — show timeline
- 2026-06-10 Listed $200,000 Global MLS
Property tax history
+1.6%/yrLatest (2025): $6,500 · +1.3% YoY. Source: county tax records.
Cash-flow waterfall
monthlySold comps — $/sqft
last 12 mo · ≤1 miLoading sold comps…