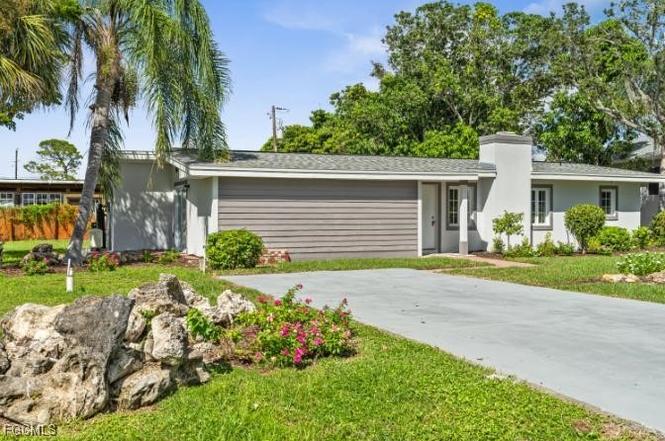
4970 Riverside Dr · Estero, FL
Flood risk 9/10 · Severe
- FEMA flood zone
- AE
- Chance of flooding over 30 yrs
- 0.99%
- Est. flood insurance / yr
- $1,737 – $8,500
Fire risk 3/10 · Minor
- Est. fire insurance / yr
- $947 – $1,759
Heat risk 10/10 · Severe
- Hot days now (above 107°F)
- 7 days/yr
- Hot days in 30 yrs
- 31 days/yr
Wind risk 10/10 · Severe
- Chance of severe wind over 30 yrs
- 99.0%
Air-quality risk 3/10 · Minor
- Unhealthy air days now
- 2 days/yr
- Unhealthy air days in 30 yrs
- 2 days/yr
Risk factors via First Street. Map © Google.
Why this score? — see what drove the D+ grade
The composite is a weighted blend of 9 inputs, each scored 0–100. Each bar is that input's sub-score; the figure is the points it added to the 100-point composite (weight × sub-score).
- Cash flow +17.5/30.0
- ARV discount +7.5/15.0
- DSCR +5.5/10.0
- Schools +4.1/10.0
- 1% rule +4.0/10.0
- Livability +4.0/5.0
- Condition / age +2.5/5.0
- Rent growth +2.1/5.0
- Appreciation +0.0/10.0
$499,000
🖨 Deal sheet 📄 Offer letter ✓ Due diligence
Listing remarks
Exceptional Location • Pool Home • Nearly Half an Acre • Fully Updated Discover this beautifully remodeled and super charming 3-bedroom, 2-bath pool home set on almost ½ acre directly across from the Estero River. This home has been extensively updated with a New Roof, New A/C, New water system, New Water heater, new electric, new plumbing, new bathrooms, flooring, walk in closets, impact sliding doors that open to a picture perfect, charming pool area. Inside, you’ll find a gorgeous new kitchen, an inviting dining room, and a cozy fireplace, blending modern comfort with timeless character. Enjoy effortless access to the water with the community boat ramp just a
Key facts
- New water heater
- New a/c
- New electric
Tags
Property features AI
Finance
- Financial info: Pets allowed
- HOA & community: Annual association fee of $300; Community amenities include boat dock, boat ramp, pier, boat slip, barbecue, picnic area, playground and park
Exterior
- Security: Security/high impact doors; Smoke detectors
- Utilities: Well water; Septic tank; Cable available
- Home design: Single-story; Entry level 1; Resale property; Faces southwest; Zoned RS-1
- Construction: Block, concrete and stucco construction; Shingle roof; Built as single-story (1)
- Exterior features: Fruit trees; Outbuilding; Oversized lot; Public maintained road; Northeast exposure; Private in-ground pool; Security/high impact doors; Smoke detectors
Interior
- Kitchen: Dishwasher; Microwave; Range; Refrigerator
- Flooring: Tile
- Bathrooms: 2 full bathrooms
- Heating & cooling: Central heating (electric); Central air conditioning (electric)
- Interior features: Breakfast area; Eat-in kitchen; Fireplace; Workshop; Unfurnished; See remarks
- Laundry & utility: Washer; Dryer; Laundry inside
Neighborhood map
What this means for you Summary
Snapshot
- This is a 2-bed/1.0-bath single-family listed at $499k.
Deal economics
- At list price, monthly cash flow is $-39 ($-470/yr) — negative.
- To cash-flow at today's rent, offer at most $492k (1.4% below list).
- To meet the 1% rule (rent ≥ 1% of price), the offer needs to be $449k (9.9% below list).
- Recommended offer: $439k (12.0% below list) — sets the bar for market timing.
- Cap rate 7.2% vs local median 3.4% in Estero — top-decile yield for the area; either an underpriced asset or a hidden risk that comps aren't pricing in. Stress-test before assuming the spread holds.
Location & tenants
- Location reads 79/100 on livability (#149 in FL, #2,242 nationally) — a middle-class / working-renter tenant base. Strengths: crime A+, employment A+, housing A+; Watch: amenities F, commute F, cost of living D-.
- Lee (suburban): math 47% / reading 50% proficiency, ranked #42 of 73 in FL (top 58%) — families likely to look elsewhere, expect single-tenant / working-renter base with shorter leases.
- Market conditions: Rents soft (-1.4%/yr); 668 active listings in the ZIP; 7 comparable units currently listed for rent nearby; rentals at typical pace (median 24d on market — plan ~3-4 weeks tenant-placement turnaround); solid renter incomes; 15,411 units permitted in Lee County in 2024 (4,686 in 5+ unit buildings).
- At $4,494/mo this rent would consume 53% of the median local household income ($103k/yr) (locally 606% of renters already pay >50% of income on rent) — very limited rent-growth headroom before tenants either downsize or default.
Forward outlook
- Local home prices are declining (-3.0%/yr); year-one equity from $3k of loan paydown is wiped out by about $15k of value loss. Plan a longer hold.
- Lee County population projected at +44% by 2050 — long-run rental-demand tailwind backs the buy-and-hold thesis.
Negotiation context
- It's been on market 212 days — a 12% lower offer ($439k) is reasonable based on typical stale-listing flexibility.
- Current owner paid $247k; list at $499k implies a 102% gain — meaningful room to come down on a strong offer.
Risks & watch-outs
- Watch-outs: flood insurance adds $427/mo.
- Climate carrying-cost: in FEMA flood zone AE (mandatory federal flood insurance); severe wind risk, 99% chance of damaging wind over 30y; extreme-heat days projected 7→31/yr by 2055 (HVAC capex compounding) — expect insurance premiums to compound above CPI over the hold.
Questions for the listing agent
- What do current leases actually rent for vs. the listed asking? Can we see a recent rent roll and the last 12 months of T-12 income?
- It's been on market 212 days. Have you received any prior offers? Is the seller open to a 12% concession, seller financing, or rate buy-down credit?
- Built in 1962 — when were the roof, HVAC, electrical panel, plumbing, and water heater last replaced?
- What's the actual annual flood-insurance premium (NFIP or private), and is the property in a SFHA with mandatory coverage?
- What does the HOA fee cover, when was the last increase, and are there any pending special assessments or reserve-fund shortfalls?
- Why hasn't it sold? Are there any deal-killer items the seller is aware of (foundation, flood, title, zoning, code violations)?
- Is there a deadline driving the sale (1031 exchange, divorce, estate, relocation)? That informs how much negotiation room exists.
- Schools are A-rated — typically a magnet for longer-tenancy family renters. What's the average tenant stay here, and is there a school-zone premium baked into asking?
- The area grade is low — what's the realistic commute time and amenity access for the typical tenant pool here? Any planned neighborhood developments (good or bad) we should know about?
- What's the average days-on-market for RENTAL listings here right now (not sales)? A rising rental-DOM trend means longer vacancies and softer asking-rent achievability than the comps imply.
- What's the recent tenant-quality profile in this submarket — average credit score on applications, eviction rate, late-payment / NSF rate, and stable-employment percentage? A property-management company in the area should have these aggregated.
- How much new for-sale + rental construction is in the pipeline within 1–3 miles? Heavy new supply typically softens prices + rents 12–24 months out; constrained supply supports both.
Investment metrics
- 1% rule
- 0.90% ✗
- Cap rate
- 7.22%
- Cash-on-cash
- 3.33%
- DSCR
- 1.15
- GRM
- 9.3
CMA / ARV
No comps found within radius.
Projected returns pro-forma
-3.0% appreciation · 0.0% rent growth · sell at horizon
- IRR
- -20.4%
- Equity multiple
- 0.31×
- Total profit
- $-96,369
- Equity at exit
- $74,403
- IRR
- -22.5%
- Equity multiple
- 0.02×
- Total profit
- $-137,397
- Equity at exit
- $43,144
Cash invested: $139,720 (down + closing). Projections, not guarantees.
Landlord ↔ Tenant lean methodology
- Overall (STATE)
- 87 Strongly Landlord-Friendly
- State Florida
- 87 Strongly Landlord-Friendly · R+3
- County
- — inherits STATE
- City
- — inherits STATE
ZIP-level market 33928
- Rents YoY
- -1.4%
- Active inventory
- 668
- Price-to-rent
- 9.3×
Monthly cashflow live
- Estimated rent
- $4,494 high interval (Pro) →
- Mortgage (P&I)
- −$2,617
- Tax from tax record
- −$313 /mo · $3,756/yr
- Insurance
- −$208
- Flood insurance flood zone
- −$427 /mo · $5,118/yr
- HOA
- −$25
- Vacancy / Maint / Mgmt
- −$944
- Net cashflow
- $-39
Break-even live
UW: 25.0% down · 7.5% · 30yr · 1.5% tax · 5.0% vac · 8.0% maint · 8.0% mgmt
Financing live
Cash to close
- Down payment
- $124,750
- Closing costs
- $14,970
- Reserves months
- —
- Total cash needed
- —
Loan-product check · same deal, 3 products live
Conventional
25% down · 7.5% · 30yr
- Down + closing
- —
- Monthly P&I
- —
- Monthly cashflow
- —
- DSCR
- —
- Eligible?
- —
Personal DTI + credit; lowest rate.
DSCR
20% down · 8.5% · 30yr
- Down + closing
- —
- Monthly P&I
- —
- Monthly cashflow
- —
- DSCR
- —
- Eligible?
- —
No personal income docs; deal must DSCR.
Hard money
10% down · 12.0% · 12mo
- Down + closing
- —
- Monthly P&I
- —
- Monthly cashflow
- —
- DSCR
- —
- Eligible?
- —
Short-term bridge; refi at stabilization.
Rent comps 7 comps
| Address | Beds | Baths | Sqft | Rent | $/sqft | DOM | Units | Dist |
|---|---|---|---|---|---|---|---|---|
| 4761 W Bay Blvd Unit 1545976P Estero, FL | 3.0 | 3.0 | 1743 | $4,994 | $2.87 | 14d | 1 | 0.89mi |
| 4751 W Bay Blvd #402 Estero, FL | 3.0 | 3.0 | 1608 | $7,500 | $4.66 | 23d | 1 | 0.94mi |
| 4751 W Bay Blvd #402 Estero, FL | 3.0 | 3.0 | 1608 | $7,500 | $4.66 | 15d | 1 | 0.94mi |
| 20151 Ian Ct #201 Estero, FL | 2.0 | 2.0 | 1429 | $3,000 | $2.10 | 23d | 1 | 0.99mi |
| 4640 Turnberry Lake Dr #403 Estero, FL | 2.0 | 2.0 | 1207 | $5,500 | $4.56 | 23d | 1 | 1.02mi |
| 3783 Pino Vista Way #201 Estero, FL | 3.0 | 2.0 | 1523 | $3,300 | $2.17 | 23d | 1 | 1.12mi |
| 3702 Pino Vista Way #3 Estero, FL | 3.0 | 2.0 | 1610 | $2,300 | $1.43 | 3d | 1 | 1.27mi |
HOA detail
- Monthly dues
- $25 · $300/yr
- Likely covers
- waterelectricpool
Listing history 14 events
-
2026-06-17days on market $499,000 Active 212 DOM
-
2026-06-16days on market $499,000 Active 211 DOM
-
2026-06-16days on market $499,000 Active 210 DOM
-
2026-06-13days on market $499,000 Active 208 DOM
-
2026-06-09days on market $499,000 Active 204 DOM
-
2026-06-07days on market $499,000 Active 202 DOM
-
2026-06-02days on market $499,000 Active 197 DOM
-
2026-06-01days on market $499,000 Active 196 DOM
-
2026-06-01days on market $499,000 Active 195 DOM
-
2026-05-07price $539,900
-
2026-02-11price $550,000
-
2025-11-17$590,000 Active
-
2022-12-28soldstatus $247,000
-
1992-10-14soldstatus $65,000
ⓘ Source: listings_history table (triggers on properties + properties_extension) + one-shot
backfill from property_details.listing_events for pre-trigger history.
Tax reassessment forecast FL · Resets to sale price
- Current annual tax
- $3,756 · $313/mo
- Projected year-2 tax
- $4,142 · $345/mo
- Expected delta
- +$386/yr (+$32/mo · 10.3%)
ⓘ Screening estimate from a state-policy table — verify with the county assessor before closing.
Climate risk First Street
- Flood 9/10 Extreme FEMA zone AE · 99% chance over 30 yrs
- Wildfire 3/10 Moderate
- Heat 10/10 Extreme 7 d/yr ≥107°F today · 31 d/yr by 30 yrs out
- Wind 10/10 Extreme 99% chance of damaging wind over 30 yrs
- Air quality 3/10 Moderate 2 unhealthy d/yr today · 2 by 30 yrs out
Nearby sold comps map
Loading sold comps map…
Walkable amenities ~0.75 mi
Loading nearby amenities…
Taxation est. · year 1
- Rental income
- $53,926
- − Mortgage interest
- −$27,952
- − Property taxes
- −$3,756
- − Insurance
- −$7,614
- − Repairs & maintenance
- −$4,314
- − Management
- −$4,314
- − HOA
- −$300
- − Depreciation
- −$14,516
- Taxable loss
- −$8,840
- Est. tax savings @ 24.0%
- +$2,122
- After-tax cash flow
- $1,652/yr
For passive investors: Depreciation is non-cash, so a rental often shows a tax loss while cash-flowing — sheltering income. Rental losses are passive: they offset passive income freely, and up to $25,000/yr can offset ordinary (W-2) income if you actively participate and your MAGI is under $100k (phasing out to $0 by $150k); unused losses carry forward. On sale, claimed depreciation is recaptured at up to 25%, and gains may owe capital-gains tax (a 1031 exchange can defer both). Figures are a year-1 estimate at your 24.0% rate — not tax advice; consult a CPA.
Schools (NCES district)
- District
- Lee
- NCES district ID
- 1201080
- Math proficiency
- 47% ▼ -11.00%
- Reading proficiency
- 50% ▼ -4.00%
- Median HH income
- $49,518
- Composite
- 41.49/100
- National rank
- #3458
- State rank
- #42 of 73 in FL
Livability — Estero
- Score
- 79/100
- State rank
- #149
- US rank
- #2242
Category grades
Schools grade is shown separately in the Schools card above.
Census & demographics
- Census place
- Estero, FL
- County
- Lee County · 788,662 people
- City population
- 31,926
- Metro
- Cape Coral-Fort Myers, FL
- Population (ZIP)
- 31,926
- Household income
- $102,624
- Rent vs Own
- Severe rent burden
- 606.0
Population outlook (Lee County) Hauer SSP2
- Today (2025)
- 871,946 people
- By 2030
- 955,468 · +9.6%
- By 2040
- 1,113,587 · +27.7%
- By 2050
- 1,256,891 · +44.1%
- By 2075
- 1,560,270 · +78.9%
- By 2100
- 1,726,848 · +98.0%
Race, ethnicity, and origin ACS 2023
- Neighborhood character
- Predominantly White (85%)
- Race & ethnicity
- White 85% Hispanic / Latino 8% Two or more races 7% Asian 3% Black 1%
- Hispanic origin (detail)
- Mexican 2% Puerto Rican 2% Cuban 1%
- Common ancestry
- Romanian 5% Lithuanian 3% Slovak 2%
- Foreign-born
- 11% · Canada, China, Jamaica
- Languages at home
- 90% English-only · Spanish 5% Other Indo-European 1% French/Haitian/Cajun 1%
Political lean MEDSL · Lee
- 2024 margin
- Strong R (+28.4) · D 35.5% · R 63.9%
- 2008→2024 swing
- -18.0pp toward R · 2008: -10.4pp · 2024: -28.4pp
- All cycles
- 2024: R+28.4 2020: R+19.2 2016: R+20.4 2012: R+16.6 2008: R+10.4
Not yet ingested
- Civics
- —
Market trends
- HPI YoY
- ▼ -109.49%
- Current HPI
- 197.5913
- Rent YoY
- ▼ -1.42%
- Metro
- Cape Coral-Fort Myers, FL
- State GDP YoY
- ▲ 3.28%
- F500 in state
- 36
Industry mix (Fortune 500 HQ in FL)
| Industry | F500 HQs | Revenue |
|---|---|---|
| Industrial Technology | 2 | $29B |
|
||
| Insurance | 2 | $17B |
|
||
| Retail | 1 | $60B |
|
||
| Technology Distribution | 1 | $58B |
|
||
| Homebuilding | 1 | $35B |
|
||
| Technology Manufacturing | 1 | $35B |
|
||
Price history
+730.6% since first listed5 events — show timeline
- 2026-05-07 Price Changed $539,900 FORTMLS
- 2026-02-11 Price Changed $550,000 FORTMLS
- 2025-11-17 Listed $590,000 FORTMLS
- 2022-12-28 Sold (Public Records) $247,000 Public Records
- 1992-10-14 Sold (Public Records) $65,000 Public Records
Property tax history
+14.5%/yrLatest (2025): $3,756 · -6.3% YoY. Source: county tax records.
Cash-flow waterfall
monthlySold comps — $/sqft
last 12 mo · ≤1 miLoading sold comps…