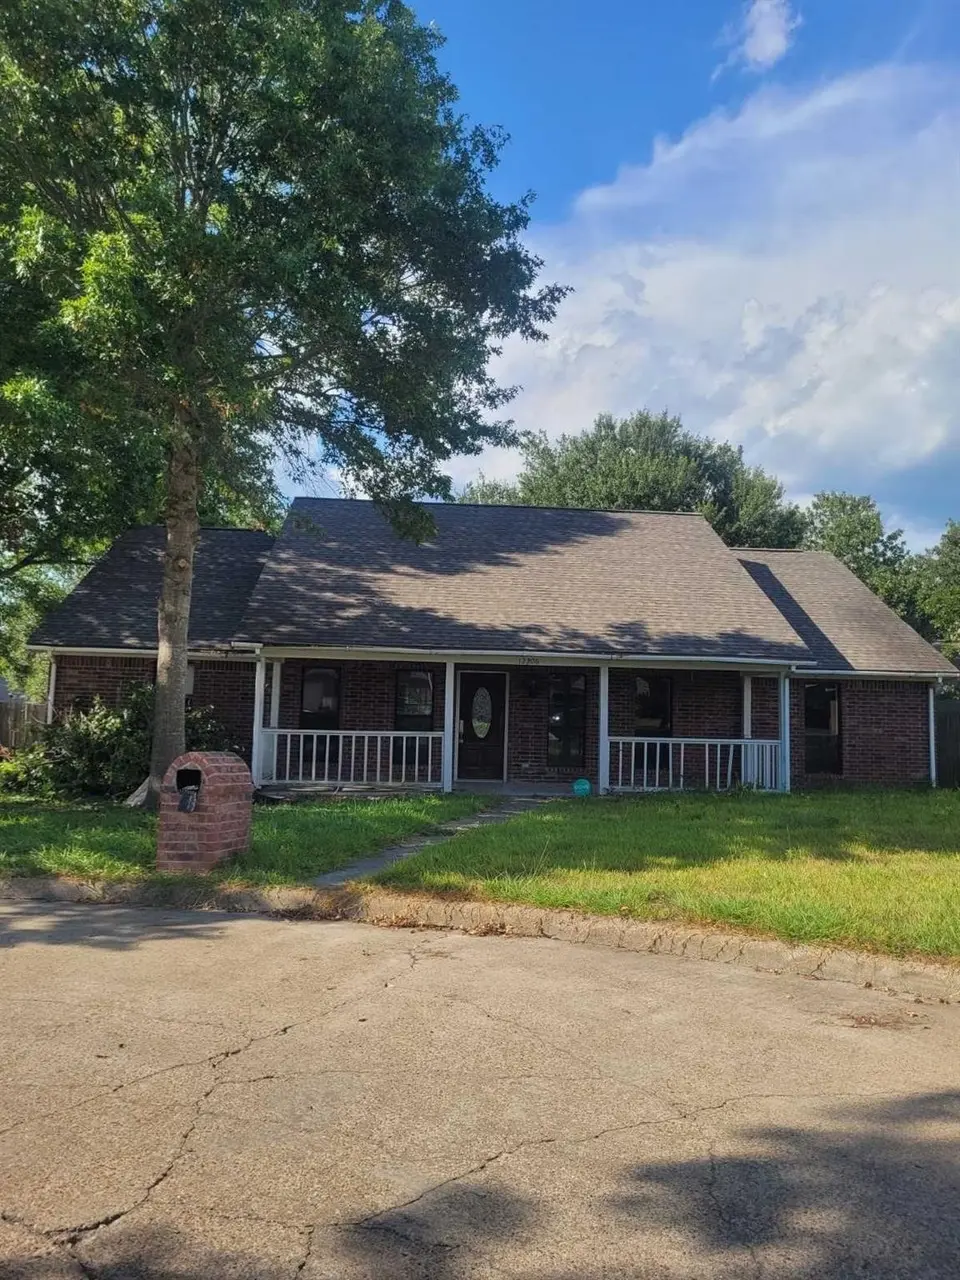
12206 Fairhaven Ln · Conroe, TX
Flood risk 1/10 · Minimal
- FEMA flood zone
- X (unshaded)
- Chance of flooding over 30 yrs
- 0.0%
- Est. flood insurance / yr
- $507 – $1,088
Fire risk 1/10 · Minimal
- Est. fire insurance / yr
- $1,222 – $2,270
Heat risk 8/10 · Major
- Hot days now (above 110°F)
- 7 days/yr
- Hot days in 30 yrs
- 24 days/yr
Wind risk 8/10 · Major
- Chance of severe wind over 30 yrs
- 99.0%
Air-quality risk 2/10 · Minimal
- Unhealthy air days now
- 1 days/yr
- Unhealthy air days in 30 yrs
- 1 days/yr
Risk factors via First Street. Map © Google.
Why this score? — see what drove the D grade
The composite is a weighted blend of 9 inputs, each scored 0–100. Each bar is that input's sub-score; the figure is the points it added to the 100-point composite (weight × sub-score).
- ARV discount +15.0/15.0
- Cash flow +7.8/30.0
- Schools +5.4/10.0
- 1% rule +4.3/10.0
- Livability +3.7/5.0
- Condition / age +2.5/5.0
- DSCR +1.9/10.0
- Rent growth +1.7/5.0
- Appreciation +0.0/10.0
$219,500
🖨 Deal sheet (PDF) 📄 Offer letter ✓ Due diligence
Listing remarks MLS
This property offers a fantastic opportunity in a quiet, well-established, and highly desirable neighborhood known for its charm and beautiful surroundings. Nestled in a peaceful estate setting, the home is surrounded by well-kept properties, making it an attractive location for future value and long-term living. The house does require some work and updates, but it presents great potential for customization and added value. Whether you're an experienced investor looking for your next flip, a homeowner wanting to renovate and create your dream home, or a buyer seeking a solid investment property, this home has strong upside. The home is not fully completed and is best suited for a cash investor. With the right vision and improvements, this property can truly shine. Priced to sell “as-is,” it reflects an excellent chance to get into a great area at a competitive price. Don’t miss out on turning this hidden gem into something special!
Key facts
- 2 garage spots
- Built 1988
- Listed 61 days
Neighborhood map
What this means for you Summary
Snapshot
- This is a 3-bed/2.5-bath single-family listed at $220k.
Deal economics
- At list price, monthly cash flow is $-244 ($-3k/yr) — negative.
- To cash-flow at today's rent, offer at most $176k (19.6% below list).
- To meet the 1% rule (rent ≥ 1% of price), the offer needs to be $205k (6.6% below list).
- Recommended offer: $176k (19.6% below list) — sets the bar for cash-flow.
- Cap rate 5.0% vs local median 3.1% in Conroe — top-decile yield for the area; either an underpriced asset or a hidden risk that comps aren't pricing in. Stress-test before assuming the spread holds.
Location & tenants
- Location reads 74/100 on livability (#169 in TX, #4,447 nationally) — a middle-class / working-renter tenant base. Strengths: cost of living A+, housing A+, amenities B; Watch: commute F, health & safety F.
- Montgomery ISD (rural): math 63% / reading 57% proficiency, ranked #49 of 826 in TX (top 6%) — acceptable for families but not a draw, mixed tenant base, ~2y average lease.
- Zoned schools: Madeley Ranch El (math 59% / reading 55%, grade C+, #505 of 4,322 statewide, top 13%, 786 students, 26% FRL); Montgomery J H (math 68% / reading 54%, grade B+, #145 of 1,662 statewide, top 9%, 1,045 students, 30% FRL); Montgomery H S (math 53% / reading 62%, grade C, #327 of 1,632 statewide, top 20%, 1,556 students, 25% FRL) — zoned schools at 27% FRL track the district average.
- Market conditions: Rents falling (-3.3%/yr); 1069 active listings in the ZIP; 6 comparable units currently listed for rent nearby; rentals at typical pace (median 21d on market — plan ~3-4 weeks tenant-placement turnaround); solid renter incomes; 13,259 units permitted in Montgomery County in 2024 (1,402 in 5+ unit buildings).
Forward outlook
- Local home prices are declining (-3.0%/yr); year-one equity from $2k of loan paydown is wiped out by about $7k of value loss. Plan a longer hold.
- Montgomery County population projected at +65% by 2050 — long-run rental-demand tailwind backs the buy-and-hold thesis.
Negotiation context
- It's been on market 61 days — a 6% lower offer ($206k) is reasonable based on typical stale-listing flexibility.
- 11 sale attempts since 19y ago with the ask held roughly flat each time — persistent listings suggest the price (not the market) is what's stuck; bring a comps-based counter.
Risks & watch-outs
- Watch-outs: property tax is 2.8% of price.
- Climate carrying-cost: severe wind risk, 99% chance of damaging wind over 30y; extreme-heat days projected 7→24/yr by 2055 (HVAC capex compounding) — expect insurance premiums to compound above CPI over the hold.
Questions for the listing agent
- What do current leases actually rent for vs. the listed asking? Can we see a recent rent roll and the last 12 months of T-12 income?
- It's been on market 61 days. Have you received any prior offers? Is the seller open to a 20% concession, seller financing, or rate buy-down credit?
- Property tax is high relative to price — has the assessment been appealed recently, and will the sale trigger a re-assessment?
- What does the HOA fee cover, when was the last increase, and are there any pending special assessments or reserve-fund shortfalls?
- Why hasn't it sold? Are there any deal-killer items the seller is aware of (foundation, flood, title, zoning, code violations)?
- Is there a deadline driving the sale (1031 exchange, divorce, estate, relocation)? That informs how much negotiation room exists.
- Schools are D-rated, which usually means shorter tenancies and higher turnover. Who's the typical renter profile here, and what's been the actual vacancy rate?
- The area grade is low — what's the realistic commute time and amenity access for the typical tenant pool here? Any planned neighborhood developments (good or bad) we should know about?
- What's the average days-on-market for RENTAL listings here right now (not sales)? A rising rental-DOM trend means longer vacancies and softer asking-rent achievability than the comps imply.
- What's the recent tenant-quality profile in this submarket — average credit score on applications, eviction rate, late-payment / NSF rate, and stable-employment percentage? A property-management company in the area should have these aggregated.
- How much new for-sale + rental construction is in the pipeline within 1–3 miles? Heavy new supply typically softens prices + rents 12–24 months out; constrained supply supports both.
Investment metrics
- 1% rule
- 0.93% ✗
- Cap rate
- 4.96%
- Cash-on-cash
- -4.76%
- DSCR
- 0.79
- GRM
- 8.9
CMA / ARV
- ARV (median comp)
- $360,263
- List price
- $219,500
- Delta
- -39.07%
- Verdict
- UNDERPRICED
- Comps
- 20 within 1.0 mi
Show comp detail 12 sales within ~0.75 mi
| Address | Dist | Beds/Ba | Sqft | Sold | Price | $/sf | Match |
|---|---|---|---|---|---|---|---|
| 12206 Fairhaven Ln | 0.00mi | 3/2.0 | 2,212 (0%) | 1mo | $219,500 | $99 | 97 |
| 3407 Fitzgerald Dr | 0.38mi | 3/2.0 | 2,193 (-1%) | 1mo | $335,000 | $153 | 78 |
| 3713 Walden Estates Dr | 0.34mi | 3/2.0 | 2,252 (+2%) | 1mo | $464,000 | $206 | 78 |
| 12018 Brightwood Dr | 0.27mi | 3/2.5 | 2,344 (+6%) | 2mo | $445,000 | $190 | 76 |
| 12014 Rainforest Ln | 0.20mi | 4/2.0 (+1) | 2,116 (-4%) | 3mo | $180,000 | $85 | 74 |
| 3430 Willowrun Dr | 0.45mi | 4/3.0 (+1) | 2,216 (+0%) | 1mo | $365,000 | $165 | 71 |
| 3307 Hemingway Dr | 0.38mi | 4/2.0 (+1) | 2,271 (+3%) | 2mo | $364,500 | $161 | 69 |
| 7 Brookhaven Pt | 0.66mi | 3/2.0 | 2,191 (-1%) | 2mo | $939,000 | $429 | 64 |
| 11705 Marina View Dr | 0.33mi | 4/3.0 (+1) | 2,050 (-7%) | 3mo | $379,990 | $185 | 63 |
| 11717 Marina View Dr | 0.35mi | 4/3.5 (+1) | 2,344 (+6%) | 3mo | $399,495 | $170 | 62 |
| 3030 Hemingway Dr | 0.61mi | 3/2.0 | 2,354 (+6%) | 3mo | $325,000 | $138 | 56 |
| 3218 W Woodchuck Rd W | 0.52mi | 3/2.0 | 1,983 (-10%) | 1mo | $239,900 | $121 | 56 |
Match score weights: distance 35% · size 25% · config 20% · recency 20%. Top-matched comps best support the ARV.
Projected returns pro-forma
-3.0% appreciation · 0.0% rent growth · sell at horizon
- IRR
- -28.6%
- Equity multiple
- 0.07×
- Total profit
- $-56,860
- Equity at exit
- $32,728
- IRR
- -52.2%
- Equity multiple
- -0.49×
- Total profit
- $-91,732
- Equity at exit
- $18,978
Cash invested: $61,460 (down + closing). Projections, not guarantees.
Landlord ↔ Tenant lean methodology
- Overall (STATE)
- 87 Strongly Landlord-Friendly
- State Texas
- 87 Strongly Landlord-Friendly · R+5
- County
- — inherits STATE
- City
- — inherits STATE
ZIP-level market 77356
- Home prices YoY
- -30.3%
- Rents YoY
- -3.3%
- Active inventory
- 1069
- Price-to-rent
- 8.9×
Monthly cashflow live
- Estimated rent
- $2,049 high interval (Pro) →
- Mortgage (P&I)
- −$1,151
- Tax from tax record
- −$517 /mo · $6,209/yr
- Insurance
- −$91
- HOA
- −$103
- Vacancy / Maint / Mgmt
- −$430
- Net cashflow
- $-244
Break-even live
Sensitivity live
| Price | -10% $-120 | -5% $-182 | +0% $-244 | +5% $-306 | +10% $-368 |
|---|---|---|---|---|---|
| Rent | -10% $-406 | -5% $-325 | +0% $-244 | +5% $-163 | +10% $-82 |
| Rate | -1.0pp $-133 | -0.5pp $-188 | base $-244 | +0.5pp $-301 | +1.0pp $-359 |
UW: 25.0% down · 7.5% · 30yr · 1.5% tax · 5.0% vac · 8.0% maint · 8.0% mgmt
Financing live
Cash to close
- Down payment
- $54,875
- Closing costs
- $6,585
- Reserves months
- —
- Total cash needed
- —
Loan-product check · same deal, 3 products live
Conventional
25% down · 7.5% · 30yr
- Down + closing
- —
- Monthly P&I
- —
- Monthly cashflow
- —
- DSCR
- —
- Eligible?
- —
Personal DTI + credit; lowest rate.
DSCR
20% down · 8.5% · 30yr
- Down + closing
- —
- Monthly P&I
- —
- Monthly cashflow
- —
- DSCR
- —
- Eligible?
- —
No personal income docs; deal must DSCR.
Hard money
10% down · 12.0% · 12mo
- Down + closing
- —
- Monthly P&I
- —
- Monthly cashflow
- —
- DSCR
- —
- Eligible?
- —
Short-term bridge; refi at stabilization.
Rent comps 6 comps
| Address | Beds | Baths | Sqft | Rent | $/sqft | DOM | Units | Dist |
|---|---|---|---|---|---|---|---|---|
| 12255 Trail Hollow Dr Montgomery, TX | 3.0 | 2.0 | 1657 | $1,950 | $1.18 | 17d | 1 | 0.23mi |
| 11243 Glenforest Dr Montgomery, TX | 3.0 | 2.0 | 1442 | $1,699 | $1.18 | 7d | 1 | 0.80mi |
| 11231 Glenforest Dr Montgomery, TX | 3.0 | 2.0 | 1479 | $1,499 | $1.01 | 24d | 1 | 0.81mi |
| 3804 Mystic Cir Montgomery, TX | 3.0 | 2.0 | 1888 | $2,100 | $1.11 | 46d | 1 | 1.25mi |
| 3679 Windswept Dr Montgomery, TX | 3.0 | 2.0 | 1842 | $2,000 | $1.09 | 21d | 1 | 1.38mi |
| 3813 Breckenridge Dr Montgomery, TX | 4.0 | 3.0 | 2850 | $2,499 | $0.88 | 7d | 1 | 1.49mi |
HOA detail
- Monthly dues
- $103 · $1,236/yr
Listing history 36 events
-
2026-04-17price $219,500 969-char remark
Show marketing remark (969 chars)
This property offers a fantastic opportunity in a quiet, well-established, and highly desirable neighborhood known for its charm and beautiful surroundings. Nestled in a peaceful estate setting, the home is surrounded by well-kept properties, making it an attractive location for future value and long-term living. The house does require some work and updates, but it presents great potential for customization and added value. Whether you're an experienced investor looking for your next flip, a homeowner wanting to renovate and create your dream home, or a buyer seeking a solid investment property, this home has strong upside. The home is not fully completed and is best suited for a cash investor. With the right vision and improvements, this property can truly shine. Priced to sell “as-is,” it reflects an excellent chance to get into a great area at a competitive price. Don’t miss out on turning this hidden gem into something special!
-
2026-03-27$230,000 Active 969-char remark
Show marketing remark (969 chars)
This property offers a fantastic opportunity in a quiet, well-established, and highly desirable neighborhood known for its charm and beautiful surroundings. Nestled in a peaceful estate setting, the home is surrounded by well-kept properties, making it an attractive location for future value and long-term living. The house does require some work and updates, but it presents great potential for customization and added value. Whether you're an experienced investor looking for your next flip, a homeowner wanting to renovate and create your dream home, or a buyer seeking a solid investment property, this home has strong upside. The home is not fully completed and is best suited for a cash investor. With the right vision and improvements, this property can truly shine. Priced to sell “as-is,” it reflects an excellent chance to get into a great area at a competitive price. Don’t miss out on turning this hidden gem into something special!
-
2025-11-26historical
-
2025-07-02price $245,000
-
2025-06-16$295,000 Active
-
2024-04-27historical
-
2024-01-13price $275,000
-
2024-01-09price $285,000
-
2023-08-29soldstatus
-
2023-08-23$300,000 Active
-
2022-07-14soldstatus
-
2022-05-24soldstatus
-
2013-11-07soldstatus
-
2013-10-17soldstatus Sold
-
2013-09-03status Pending
-
2013-08-13status Pending, Continue to Show
-
2013-08-03status Option Pending
-
2013-07-13status Active
-
2013-07-12historical
-
2013-07-11status Active
-
2013-07-03status Option Pending
-
2013-06-25status Active
-
2013-06-25historical
-
2013-06-24status Active
-
2013-06-19status Option Pending
-
2013-06-13price $149,900
-
2013-05-03price $154,900
-
2013-04-01price $159,900
-
2013-03-08$164,900 Active
-
2009-07-28historical
-
2009-01-27$169,900
-
2008-09-19historical
-
2008-03-19$188,000
-
2008-01-30historical
-
2007-07-20$199,900
-
1988-04-01soldstatus
ⓘ Source: listings_history table (triggers on properties + properties_extension) + one-shot
backfill from property_details.listing_events for pre-trigger history.
Tax reassessment forecast TX · Resets to sale price
- Current annual tax
- $6,209 · $517/mo
- Projected year-2 tax
- $6,209 · $517/mo
- Expected delta
- $0/yr ($0/mo · 0.0%)
ⓘ Screening estimate from a state-policy table — verify with the county assessor before closing.
Climate risk First Street
- Flood 1/10 Low FEMA zone X (unshaded) · 0% chance over 30 yrs
- Wildfire 1/10 Low
- Heat 8/10 Severe 7 d/yr ≥110°F today · 24 d/yr by 30 yrs out
- Wind 8/10 Severe 99% chance of damaging wind over 30 yrs
- Air quality 2/10 Low 1 unhealthy d/yr today · 1 by 30 yrs out
Nearby sold comps map
Loading sold comps map…
Walkable amenities ~0.75 mi
Loading nearby amenities…
Taxation est. · year 1
- Rental income
- $24,594
- − Mortgage interest
- −$12,295
- − Property taxes
- −$6,209
- − Insurance
- −$1,098
- − Repairs & maintenance
- −$1,968
- − Management
- −$1,968
- − HOA
- −$1,236
- − Depreciation
- −$6,385
- Taxable loss
- −$6,564
- Est. tax savings @ 24.0%
- +$1,575
- After-tax cash flow
- $-1,351/yr
For passive investors: Depreciation is non-cash, so a rental often shows a tax loss while cash-flowing — sheltering income. Rental losses are passive: they offset passive income freely, and up to $25,000/yr can offset ordinary (W-2) income if you actively participate and your MAGI is under $100k (phasing out to $0 by $150k); unused losses carry forward. On sale, claimed depreciation is recaptured at up to 25%, and gains may owe capital-gains tax (a 1031 exchange can defer both). Figures are a year-1 estimate at your 24.0% rate — not tax advice; consult a CPA.
Schools (NCES district)
- District
- Montgomery ISD
- NCES district ID
- 4831260
- Math proficiency
- 63% ▼ -3.00%
- Reading proficiency
- 57% ▼ -3.00%
- Median HH income
- $75,596
- Composite
- 53.55/100
- National rank
- #1445
- State rank
- #49 of 826 in TX
Livability — Conroe
- Score
- 74/100
- State rank
- #169
- US rank
- #4447
Category grades
Schools grade is shown separately in the Schools card above.
Census & demographics
- County
- Montgomery County · 663,713 people
- City population
- 205,417
- Metro
- Houston-The Woodlands-Sugar Land, TX
- Population (ZIP)
- 32,583
- Household income
- $106,804
- Rent vs Own
- Severe rent burden
- 414.0
Population outlook (Montgomery County) Hauer SSP2
- Today (2025)
- 713,896 people
- By 2030
- 805,263 · +12.8%
- By 2040
- 992,708 · +39.1%
- By 2050
- 1,179,590 · +65.2%
- By 2075
- 1,628,084 · +128.1%
- By 2100
- 1,937,880 · +171.5%
Race, ethnicity, and origin ACS 2023
- Neighborhood character
- Predominantly White (87%)
- Race & ethnicity
- White 87% Two or more races 5% Hispanic / Latino 5% Black 4%
- Common ancestry
- Lithuanian 8% Slovak 2% Romanian 2%
- Foreign-born
- 3% · Canada, China
- Languages at home
- 96% English-only · Spanish 3%
Political lean MEDSL · Montgomery
- 2024 margin
- Solid R (+45.5) · D 26.8% · R 72.3%
- 2008→2024 swing
- +7.2pp toward D · 2008: -52.7pp · 2024: -45.5pp
- All cycles
- 2024: R+45.5 2020: R+43.8 2016: R+51.4 2012: R+60.7 2008: R+52.7
Not yet ingested
- Civics
- —
Market trends
- HPI YoY
- ▼ -101.28%
- Current HPI
- 233.0032
- Rent YoY
- ▼ -3.30%
- Metro
- Houston-The Woodlands-Sugar Land, TX
- State GDP YoY
- ▲ 3.95%
- F500 in state
- 110
Industry mix (Fortune 500 HQ in TX)
| Industry | F500 HQs | Revenue |
|---|---|---|
| Energy | 16 | $1,198B |
|
||
| Technology | 5 | $198B |
|
||
| Engineering / Construction | 4 | $72B |
|
||
| Energy Services | 3 | $60B |
|
||
| Utilities | 3 | $41B |
|
||
| Healthcare | 2 | $330B |
|
||
Price history
+9.8% since first listed36 events — show timeline
- 2026-04-17 Price Changed $219,500 HARMLS
- 2026-03-27 Listed $230,000 HARMLS
- 2025-11-26 Listing Removed — HARMLS
- 2025-07-02 Price Changed $245,000 HARMLS
- 2025-06-16 Listed $295,000 HARMLS
- 2024-04-27 Listing Removed — HARMLS
- 2024-01-13 Price Changed $275,000 HARMLS
- 2024-01-09 Price Changed $285,000 HARMLS
- 2023-08-29 Sold (Public Records) — Public Records
- 2023-08-23 Listed $300,000 HARMLS
- 2022-07-14 Sold (Public Records) — Public Records
- 2022-05-24 Sold (Public Records) — Public Records
- 2013-11-07 Sold (Public Records) — Public Records
- 2013-10-17 Sold (MLS) — HARMLS
- 2013-09-03 Pending — HARMLS
- 2013-08-13 Pending — HARMLS
- 2013-08-03 Pending — HARMLS
- 2013-07-13 Relisted — HARMLS
- 2013-07-12 Listing Removed — HARMLS
- 2013-07-11 Relisted — HARMLS
- 2013-07-03 Pending — HARMLS
- 2013-06-25 Relisted — HARMLS
- 2013-06-25 Listing Removed — HARMLS
- 2013-06-24 Relisted — HARMLS
- 2013-06-19 Pending — HARMLS
- 2013-06-13 Price Changed $149,900 HARMLS
- 2013-05-03 Price Changed $154,900 HARMLS
- 2013-04-01 Price Changed $159,900 HARMLS
- 2013-03-08 Listed $164,900 HARMLS
- 2009-07-28 Listing Removed — HARMLS
- 2009-01-27 Listed $169,900 HARMLS
- 2008-09-19 Listing Removed — HARMLS
- 2008-03-19 Listed $188,000 HARMLS
- 2008-01-30 Listing Removed — HARMLS
- 2007-07-20 Listed $199,900 HARMLS
- 1988-04-01 Sold (Public Records) — Public Records
Property tax history
+4.0%/yrLatest (2025): $6,209 · +0.6% YoY. Source: county tax records.
Cash-flow waterfall
monthlySold comps — $/sqft
last 12 mo · ≤1 miLoading sold comps…