6706 Red Blf · San Antonio, TX
Flood risk 5/10 · Moderate
- FEMA flood zone
- X (unshaded)
- Chance of flooding over 30 yrs
- 0.24%
- Est. flood insurance / yr
- $507 – $1,088
Fire risk 1/10 · Minimal
- Est. fire insurance / yr
- $1,222 – $2,270
Heat risk 8/10 · Major
- Hot days now (above 108°F)
- 7 days/yr
- Hot days in 30 yrs
- 22 days/yr
Wind risk 8/10 · Major
- Chance of severe wind over 30 yrs
- 80.0%
Air-quality risk 2/10 · Minimal
- Unhealthy air days now
- 0 days/yr
- Unhealthy air days in 30 yrs
- 1 days/yr
Risk factors via First Street. Map © Google.
Why this score? — see what drove the D grade
The composite is a weighted blend of 9 inputs, each scored 0–100. Each bar is that input's sub-score; the figure is the points it added to the 100-point composite (weight × sub-score).
- ARV discount +9.8/15.0
- Cash flow +8.2/30.0
- Appreciation +5.0/10.0
- Livability +4.0/5.0
- Schools +3.8/10.0
- 1% rule +3.0/10.0
- Rent growth +2.5/5.0
- Condition / age +2.5/5.0
- DSCR +2.2/10.0
$182,500
🖨 Deal sheet (PDF) 📄 Offer letter ✓ Due diligence
Listing remarks MLS
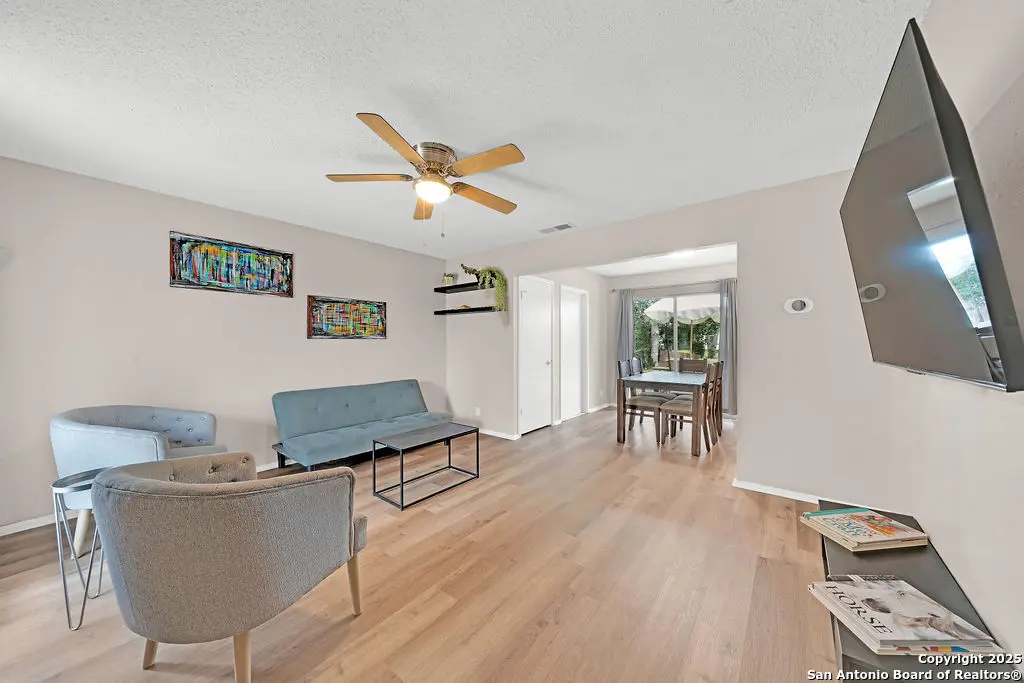
Airbnb approved! Ideal for short term rental income. This charming one-story home in Terrell Hills is perfect for those looking for comfort and convenience. Featuring 3 bedrooms and 1.5 bathrooms. The one-car garage, along with a large driveway, provides plenty of parking options for you and your guests. The expansive backyard is a fantastic spot for outdoor activities or entertaining. It's location near shopping centers, BAMC, Loop 410, and I-35 makes commuting and accessing local amenities. This home is an excellent starter home, offering a wonderful opportunity to settle in a desirable neighborhood. Don't miss out on the chance to make it your own!
Key facts
- Large driveway
- One story home
- Expansive backyard
Tags
Neighborhood map
What this means for you Summary
Snapshot
- This is a 3-bed/1.0-bath single-family listed at $182k.
Deal economics
- At list price, monthly cash flow is $-173 ($-2k/yr) — negative.
- To cash-flow at today's rent, offer at most $152k (16.7% below list).
- To meet the 1% rule (rent ≥ 1% of price), the offer needs to be $146k (20.0% below list).
- Recommended offer: $146k (20.0% below list) — sets the bar for 1% rule.
- Cap rate 5.2% vs local median 3.8% in San Antonio — top-decile yield for the area; either an underpriced asset or a hidden risk that comps aren't pricing in. Stress-test before assuming the spread holds.
Location & tenants
- Location reads 80/100 on livability (#31 in TX, #1,616 nationally) — a professional / high-income tenant draw. Strengths: amenities A+, commute A+, cost of living A+; Watch: schools C-, crime F.
- North East ISD (urban): math 38% / reading 49% proficiency, ranked #276 of 826 in TX (top 33%) — families likely to look elsewhere, expect single-tenant / working-renter base with shorter leases.
- Market conditions: 1 active listings in the ZIP; 40 comparable units currently listed for rent nearby; rentals at typical pace (median 23d on market — plan ~3-4 weeks tenant-placement turnaround); 8,308 units permitted in Bexar County in 2024 (2,506 in 5+ unit buildings).
Forward outlook
- In year one you build about $7k of equity ($1k loan paydown + $5k appreciation (3.0% local appreciation)).
- Bexar County population projected at +50% by 2050 — long-run rental-demand tailwind backs the buy-and-hold thesis.
- By year 6, paydown + projected appreciation supports a ~$36k cash-out refi (75% LTV) — recoverable capital for the next deal without selling this one.
Negotiation context
- It's been on market 474 days — a 12% lower offer ($161k) is reasonable based on typical stale-listing flexibility.
- 3 sale attempts since 4y ago; this cycle's ask has dropped $22k (11%) from the opening price — seller is motivated, your offer sets the floor, not the list.
Risks & watch-outs
- Climate carrying-cost: moderate flood risk; severe wind risk, 80% chance of damaging wind over 30y; extreme-heat days projected 7→22/yr by 2055 (HVAC capex compounding) — expect insurance premiums to compound above CPI over the hold.
Questions for the listing agent
- What do current leases actually rent for vs. the listed asking? Can we see a recent rent roll and the last 12 months of T-12 income?
- It's been on market 474 days. Have you received any prior offers? Is the seller open to a 20% concession, seller financing, or rate buy-down credit?
- Built in 1971 — when were the roof, HVAC, electrical panel, plumbing, and water heater last replaced?
- Why hasn't it sold? Are there any deal-killer items the seller is aware of (foundation, flood, title, zoning, code violations)?
- Is there a deadline driving the sale (1031 exchange, divorce, estate, relocation)? That informs how much negotiation room exists.
- Crime grade is F in this area — have there been break-ins, vandalism, or insurance claims at this property in the last 3 years? What carrier currently insures it and at what premium?
- The area grade is low — what's the realistic commute time and amenity access for the typical tenant pool here? Any planned neighborhood developments (good or bad) we should know about?
- What's the average days-on-market for RENTAL listings here right now (not sales)? A rising rental-DOM trend means longer vacancies and softer asking-rent achievability than the comps imply.
- What's the recent tenant-quality profile in this submarket — average credit score on applications, eviction rate, late-payment / NSF rate, and stable-employment percentage? A property-management company in the area should have these aggregated.
- How much new for-sale + rental construction is in the pipeline within 1–3 miles? Heavy new supply typically softens prices + rents 12–24 months out; constrained supply supports both.
Investment metrics
- 1% rule
- 0.80% ✗
- Cap rate
- 5.16%
- Cash-on-cash
- -4.05%
- DSCR
- 0.82
- GRM
- 10.4
CMA / ARV
- ARV (median comp)
- $192,396
- List price
- $182,500
- Delta
- -5.14%
- Verdict
- FAIR
- Comps
- 20 within 1.0 mi
Show comp detail 12 sales within ~0.75 mi
| Address | Dist | Beds/Ba | Sqft | Sold | Price | $/sf | Match |
|---|---|---|---|---|---|---|---|
| 4110 Moana Dr | 0.35mi | 3/1.0 | 952 (-7%) | 3mo | $145,000 | $152 | 70 |
| 215 Antrim | 0.47mi | 3/1.0 | 988 (-4%) | 8mo | $150,000 | $152 | 65 |
| 4207 Tallulah | 0.36mi | 3/2.0 | 1,100 (+7%) | 9mo | $195,000 | $177 | 60 |
| 3702 La Sabre Dr | 0.59mi | 2/1.0 (-1) | 1,027 (+0%) | 9mo | $185,000 | $180 | 59 |
| 926 Olney Dr | 0.64mi | 3/1.0 | 1,020 (-0%) | 13mo | $149,000 | $146 | 59 |
| 4122 Diamondhead Dr | 0.46mi | 3/1.0 | 912 (-11%) | 2mo | $135,000 | $148 | 58 |
| 339 Timberlane | 0.65mi | 3/2.0 | 1,033 (+1%) | 10mo | $175,000 | $169 | 56 |
| 3730 La Sabre Dr | 0.52mi | 3/2.0 | 1,104 (+8%) | 6mo | $149,000 | $135 | 54 |
| 130 Antrim | 0.65mi | 3/2.0 | 1,044 (+2%) | 13mo | $165,000 | $158 | 52 |
| 3954 Bikini Dr | 0.28mi | 2/1.0 (-1) | 904 (-12%) | 14mo | $149,000 | $165 | 50 |
| 4106 Tropical | 0.24mi | 4/2.0 (+1) | 1,161 (+13%) | 9mo | $220,000 | $189 | 50 |
| 4311 Eisenhauer Rd | 0.67mi | 3/2.0 | 1,150 (+12%) | 12mo | $193,000 | $168 | 35 |
Match score weights: distance 35% · size 25% · config 20% · recency 20%. Top-matched comps best support the ARV.
Projected returns pro-forma
3.0% appreciation · 3.0% rent growth · sell at horizon
- IRR
- 3.8%
- Equity multiple
- 1.22×
- Total profit
- $11,056
- Equity at exit
- $82,060
- IRR
- 7.1%
- Equity multiple
- 2.07×
- Total profit
- $54,875
- Equity at exit
- $126,464
Cash invested: $51,100 (down + closing). Projections, not guarantees.
Landlord ↔ Tenant lean methodology
- Overall (STATE)
- 87 Strongly Landlord-Friendly
- State Texas
- 87 Strongly Landlord-Friendly · R+5
- County
- — inherits STATE
- City
- — inherits STATE
ZIP-level market 78218-3446
- Active inventory
- 1
- Price-to-rent
- 10.4×
Monthly cashflow live
- Estimated rent
- $1,460 high interval (Pro) →
- Mortgage (P&I)
- −$957
- Tax from tax record
- −$293 /mo · $3,515/yr
- Insurance
- −$76
- HOA
- −$0
- Vacancy / Maint / Mgmt
- −$307
- Net cashflow
- $-173
Break-even live
Sensitivity live
| Price | -10% $-69 | -5% $-121 | +0% $-173 | +5% $-224 | +10% $-276 |
|---|---|---|---|---|---|
| Rent | -10% $-288 | -5% $-230 | +0% $-173 | +5% $-115 | +10% $-57 |
| Rate | -1.0pp $-81 | -0.5pp $-126 | base $-173 | +0.5pp $-220 | +1.0pp $-268 |
UW: 25.0% down · 7.5% · 30yr · 1.5% tax · 5.0% vac · 8.0% maint · 8.0% mgmt
Financing live
Cash to close
- Down payment
- $45,625
- Closing costs
- $5,475
- Reserves months
- —
- Total cash needed
- —
Loan-product check · same deal, 3 products live
Conventional
25% down · 7.5% · 30yr
- Down + closing
- —
- Monthly P&I
- —
- Monthly cashflow
- —
- DSCR
- —
- Eligible?
- —
Personal DTI + credit; lowest rate.
DSCR
20% down · 8.5% · 30yr
- Down + closing
- —
- Monthly P&I
- —
- Monthly cashflow
- —
- DSCR
- —
- Eligible?
- —
No personal income docs; deal must DSCR.
Hard money
10% down · 12.0% · 12mo
- Down + closing
- —
- Monthly P&I
- —
- Monthly cashflow
- —
- DSCR
- —
- Eligible?
- —
Short-term bridge; refi at stabilization.
Rent comps 40 comps
| Address | Beds | Baths | Sqft | Rent | $/sqft | DOM | Units | Dist |
|---|---|---|---|---|---|---|---|---|
| 354 Brettonwood Dr Unit 1 San Antonio, TX | 3.0 | 1.0 | 1056 | $1,395 | $1.32 | 44d | 1 | 0.35mi |
| 258 Antrim Dr San Antonio, TX | 3.0 | 2.0 | 1252 | $1,595 | $1.27 | 44d | 1 | 0.37mi |
| 339 Brettonwood Dr San Antonio, TX | 3.0 | 2.0 | 1063 | $2,000 | $1.88 | 25d | 1 | 0.38mi |
| 4102 Waikiki Dr San Antonio, TX | 3.0 | 1.0 | 1167 | $1,395 | $1.20 | 15d | 1 | 0.39mi |
| 4229 Renault Dr San Antonio, TX | 3.0 | 2.0 | 1152 | $1,525 | $1.32 | 18d | 1 | 0.44mi |
| 4207 Waikiki Dr San Antonio, TX | 3.0 | 2.0 | 1144 | $1,475 | $1.29 | 44d | 1 | 0.47mi |
| 226 Antrim Dr San Antonio, TX | 3.0 | 1.0 | 960 | $1,395 | $1.45 | 4d | 1 | 0.47mi |
| 258 Cresham Dr San Antonio, TX | 3.0 | 2.0 | 1383 | $1,650 | $1.19 | 44d | 1 | 0.53mi |
| 3730 La Sabre Dr San Antonio, TX | 4.0 | 2.0 | 1434 | $1,900 | $1.32 | 44d | 1 | 0.53mi |
| 1006 Sumner Dr San Antonio, TX | 3.0 | 2.0 | 1314 | $1,697 | $1.29 | 25d | 1 | 0.58mi |
| 4431 Myrna Dr San Antonio, TX | 2.0 | 2.0 | 1186 | $1,035 | $0.87 | 16d | 1 | 0.60mi |
| 106 Covina Ave San Antonio, TX | 3.0 | 2.0 | 1421 | $2,000 | $1.41 | 3d | 1 | 0.63mi |
| 206 Covina Ave San Antonio, TX | 3.0 | 2.0 | 1332 | $2,000 | $1.50 | 25d | 1 | 0.67mi |
| 842 Corinne Dr #21 San Antonio, TX | 3.0 | 2.0 | 1248 | $49,000 | $39.26 | 23d | 1 | 0.74mi |
| 6810 Glendora Ave Unit 15 San Antonio, TX | 2.0 | 1.0 | 1000 | $865 | $0.86 | 44d | 1 | 0.76mi |
| 3600 Eisenhauer Rd San Antonio, TX | 1.0–2.0 | 1.0–2.0 | 681 | $1,219 | $1.79 | 4d | 19 | 0.85mi |
| 2530 Harry Wurzbach Rd San Antonio, TX | 1.0–3.0 | 1.0–2.0 | 950 | $1,420 | $1.49 | 4d | 10 | 0.88mi |
| 3400 Northeast Pkwy Apt 1116 San Antonio, TX | 2.0 | 1.5 | 950 | $1,199 | $1.26 | 44d | 1 | 0.91mi |
| 343 Blaze Ave San Antonio, TX | 3.0 | 2.0 | 1438 | $1,750 | $1.22 | 17d | 1 | 0.91mi |
| 3400 Northeast Pkwy Unit 1808 San Antonio, TX | 2.0 | 2.0 | 1039 | $1,199 | $1.15 | 44d | 1 | 0.93mi |
| 3400 Northeast Pkwy Apt 710 San Antonio, TX | 2.0 | 2.0 | 950 | $1,043 | $1.10 | 4d | 1 | 0.93mi |
| 2447 Harry Wurzbach Rd Unit 203-B San Antonio, TX | 2.0 | 2.0 | 1000 | $950 | $0.95 | 23d | 1 | 0.95mi |
| 2447 Harry Wurzbach Rd Unit 231-I San Antonio, TX | 2.0 | 2.0 | 1000 | $899 | $0.90 | 16d | 1 | 0.95mi |
| 742 Olney Dr San Antonio, TX | 3.0 | 2.0 | 1469 | $1,445 | $0.98 | 44d | 1 | 1.00mi |
| 547 Cicero Ave Unit NA San Antonio, TX | 3.0 | 2.0 | 1500 | $1,525 | $1.02 | 44d | 1 | 1.01mi |
| 143 Huxley Dr San Antonio, TX | 3.0 | 2.0 | 1290 | $2,000 | $1.55 | 25d | 1 | 1.09mi |
| 538 Lanark Dr San Antonio, TX | 2.0 | 1.0 | 987 | $1,295 | $1.31 | 17d | 1 | 1.16mi |
| 538 Lanark Dr San Antonio, TX | 2.0 | 1.0 | 987 | $1,295 | $1.31 | 25d | 1 | 1.16mi |
| 4848 Goldfield San Antonio, TX | 2.0 | 1.0 | 930 | $1,325 | $1.42 | 44d | 1 | 1.20mi |
| 630 Sumner Dr San Antonio, TX | 4.0 | 2.0 | 1368 | $1,975 | $1.44 | 18d | 1 | 1.20mi |
| 245 Deerwood Dr San Antonio, TX | 2.0 | 1.0 | 770 | $695 | $0.90 | 4d | 1 | 1.33mi |
| 2355 Austin Hwy Apt 710 San Antonio, TX | 2.0 | 2.0 | 908 | $881 | $0.97 | 4d | 1 | 1.35mi |
| 3202 Eisenhauer Rd San Antonio, TX | 2.0–3.0 | 2.0–2.5 | 1375 | $1,795 | $1.30 | 4d | 2 | 1.35mi |
| 3202 Eisenhauer Rd #801 San Antonio, TX | 2.0 | 2.0 | 1407 | $1,795 | $1.28 | 4d | 1 | 1.35mi |
| 515 Blakeley Dr San Antonio, TX | 3.0 | 2.0 | 1118 | $2,000 | $1.79 | 17d | 1 | 1.36mi |
| 236 Deerwood Dr San Antonio, TX | 1.0–2.0 | 1.0 | 712 | $1,004 | $1.41 | 15d | 10 | 1.37mi |
| 4811 Village Vw San Antonio, TX | 3.0 | 2.0 | 1288 | $1,450 | $1.13 | 8d | 1 | 1.37mi |
| 3158 Eisenhauer Rd San Antonio, TX | 2.0 | 1.0 | 733 | $1,099 | $1.50 | 44d | 1 | 1.38mi |
| 438 Sumner Dr San Antonio, TX | 2.0 | 1.0 | 816 | $1,350 | $1.65 | 8d | 1 | 1.40mi |
| 217 Deerwood Dr San Antonio, TX | 2.0 | 1.0 | 1100 | $1,200 | $1.09 | 44d | 1 | 1.43mi |
Listing history 25 events
-
2026-06-21days on market $182,500 Active 474 DOM
-
2026-06-18days on market $182,500 Active 471 DOM
-
2026-06-17days on market $182,500 Active 470 DOM
-
2026-06-16days on market $182,500 Active 469 DOM
-
2026-06-13days on market $182,500 Active 466 DOM
-
2026-06-13days on market $182,500 Active 465 DOM
-
2026-06-09days on market $182,500 Active 462 DOM
-
2026-06-08days on market $182,500 Active 461 DOM
-
2026-06-07days on market $182,500 Active 460 DOM
-
2026-06-04days on market $182,500 Active 457 DOM
-
2026-06-03days on market $182,500 Active 456 DOM
-
2026-06-02days on market $182,500 Active 455 DOM
-
2026-06-01days on market $182,500 Active 454 DOM
-
2026-05-31days on market $182,500 Active 453 DOM
-
2026-01-20price $182,500 660-char remark
Show marketing remark (660 chars)
Airbnb approved! Ideal for short term rental income. This charming one-story home in Terrell Hills is perfect for those looking for comfort and convenience. Featuring 3 bedrooms and 1.5 bathrooms. The one-car garage, along with a large driveway, provides plenty of parking options for you and your guests. The expansive backyard is a fantastic spot for outdoor activities or entertaining. It's location near shopping centers, BAMC, Loop 410, and I-35 makes commuting and accessing local amenities. This home is an excellent starter home, offering a wonderful opportunity to settle in a desirable neighborhood. Don't miss out on the chance to make it your own!
-
2025-04-09price $195,000 660-char remark
Show marketing remark (660 chars)
Airbnb approved! Ideal for short term rental income. This charming one-story home in Terrell Hills is perfect for those looking for comfort and convenience. Featuring 3 bedrooms and 1.5 bathrooms. The one-car garage, along with a large driveway, provides plenty of parking options for you and your guests. The expansive backyard is a fantastic spot for outdoor activities or entertaining. It's location near shopping centers, BAMC, Loop 410, and I-35 makes commuting and accessing local amenities. This home is an excellent starter home, offering a wonderful opportunity to settle in a desirable neighborhood. Don't miss out on the chance to make it your own!
-
2025-03-04$204,900 New 660-char remark
Show marketing remark (660 chars)
Airbnb approved! Ideal for short term rental income. This charming one-story home in Terrell Hills is perfect for those looking for comfort and convenience. Featuring 3 bedrooms and 1.5 bathrooms. The one-car garage, along with a large driveway, provides plenty of parking options for you and your guests. The expansive backyard is a fantastic spot for outdoor activities or entertaining. It's location near shopping centers, BAMC, Loop 410, and I-35 makes commuting and accessing local amenities. This home is an excellent starter home, offering a wonderful opportunity to settle in a desirable neighborhood. Don't miss out on the chance to make it your own!
-
2022-12-02soldstatus
-
2022-11-29historical
-
2022-07-14$220,000 New
-
2022-05-13soldstatus Sold
-
2022-05-13soldstatus
-
2022-05-01historical Active Option
-
2022-04-28$159,000 New
-
2022-04-25soldstatus
ⓘ Source: listings_history table (triggers on properties + properties_extension) + one-shot
backfill from property_details.listing_events for pre-trigger history.
Tax reassessment forecast TX · Resets to sale price
- Current annual tax
- $3,515 · $293/mo
- Projected year-2 tax
- $3,515 · $293/mo
- Expected delta
- $0/yr ($0/mo · 0.0%)
ⓘ Screening estimate from a state-policy table — verify with the county assessor before closing.
Climate risk First Street
- Flood 5/10 Major FEMA zone X (unshaded) · 24% chance over 30 yrs
- Wildfire 1/10 Low
- Heat 8/10 Severe 7 d/yr ≥108°F today · 22 d/yr by 30 yrs out
- Wind 8/10 Severe 80% chance of damaging wind over 30 yrs
- Air quality 2/10 Low 0 unhealthy d/yr today · 1 by 30 yrs out
Nearby sold comps map
Loading sold comps map…
Walkable amenities ~0.75 mi
Loading nearby amenities…
Taxation est. · year 1
- Rental income
- $17,520
- − Mortgage interest
- −$10,223
- − Property taxes
- −$3,515
- − Insurance
- −$912
- − Repairs & maintenance
- −$1,402
- − Management
- −$1,402
- − Depreciation
- −$5,309
- Taxable loss
- −$5,242
- Est. tax savings @ 24.0%
- +$1,258
- After-tax cash flow
- $-813/yr
For passive investors: Depreciation is non-cash, so a rental often shows a tax loss while cash-flowing — sheltering income. Rental losses are passive: they offset passive income freely, and up to $25,000/yr can offset ordinary (W-2) income if you actively participate and your MAGI is under $100k (phasing out to $0 by $150k); unused losses carry forward. On sale, claimed depreciation is recaptured at up to 25%, and gains may owe capital-gains tax (a 1031 exchange can defer both). Figures are a year-1 estimate at your 24.0% rate — not tax advice; consult a CPA.
Schools (NCES district)
- District
- North East ISD
- NCES district ID
- 4832940
- Math proficiency
- 38% ▼ -14.00%
- Reading proficiency
- 49% ▼ -4.00%
- Median HH income
- $57,715
- Composite
- 38.1/100
- National rank
- #4276
- State rank
- #276 of 826 in TX
Livability — San Antonio
- Score
- 80/100
- State rank
- #31
- US rank
- #1616
Category grades
Schools grade is shown separately in the Schools card above.
Census & demographics
- Census place
- San Antonio, TX
Population outlook (Bexar County) Hauer SSP2
- Today (2025)
- 2,336,851 people
- By 2030
- 2,560,728 · +9.6%
- By 2040
- 3,020,569 · +29.3%
- By 2050
- 3,493,522 · +49.5%
- By 2075
- 4,668,459 · +99.8%
- By 2100
- 5,533,242 · +136.8%
Not yet ingested
- Political lean
- —
- Race & ethnicity
- —
- Common origin
- —
- Civics
- —
Market trends
- HPI YoY
- —
- Current HPI
- —
- Rent YoY
- —
- Metro
- —
- State GDP YoY
- ▲ 3.95%
- F500 in state
- 110
Industry mix (Fortune 500 HQ in TX)
| Industry | F500 HQs | Revenue |
|---|---|---|
| Energy | 16 | $1,198B |
|
||
| Technology | 5 | $198B |
|
||
| Engineering / Construction | 4 | $72B |
|
||
| Energy Services | 3 | $60B |
|
||
| Utilities | 3 | $41B |
|
||
| Healthcare | 2 | $330B |
|
||
Price history
+14.8% since first listed11 events — show timeline
- 2026-01-20 Price Changed $182,500 LERA
- 2025-04-09 Price Changed $195,000 LERA
- 2025-03-04 Listed $204,900 LERA
- 2022-12-02 Sold (Public Records) — Public Records
- 2022-11-29 Listing Removed — LERA
- 2022-07-14 Listed $220,000 LERA
- 2022-05-13 Sold (MLS) — LERA
- 2022-05-13 Sold (Public Records) — Public Records
- 2022-05-01 Contingent — LERA
- 2022-04-28 Listed $159,000 LERA
- 2022-04-25 Sold (Public Records) — Public Records
Property tax history
+5.4%/yrLatest (2025): $3,515 · -7.4% YoY. Source: county tax records.
Cash-flow waterfall
monthlySold comps — $/sqft
last 12 mo · ≤1 miLoading sold comps…