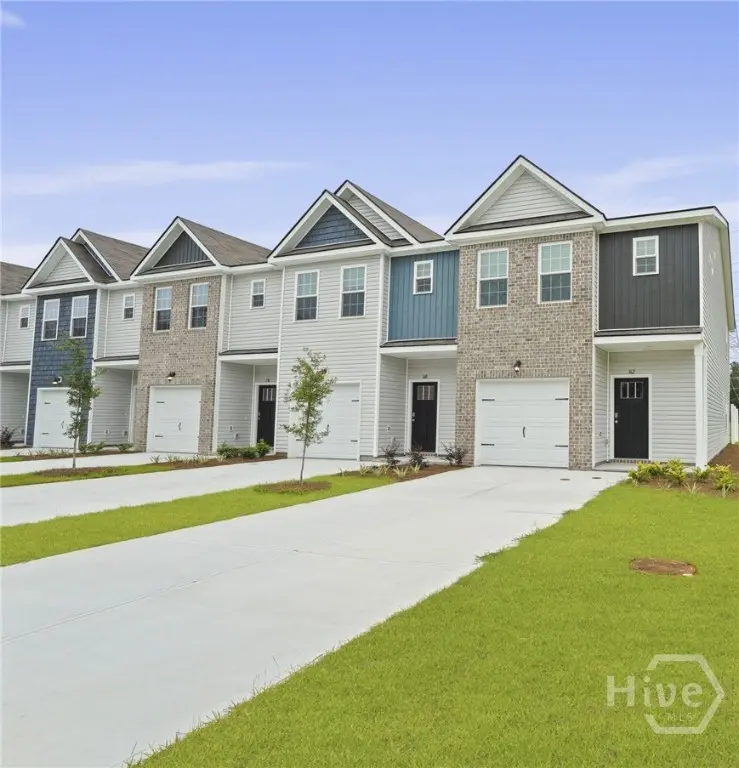
158 Stone Crab Cir · Savannah, GA
Flood risk No data
- FEMA flood zone
- —
- Chance of flooding over 30 yrs
- —
- Est. flood insurance / yr
- —
Fire risk No data
- Est. fire insurance / yr
- —
Heat risk No data
- Hot days now (above threshold)
- —
- Hot days in 30 yrs
- —
Wind risk No data
- Chance of severe wind over 30 yrs
- —
Air-quality risk No data
- Unhealthy air days now
- —
- Unhealthy air days in 30 yrs
- —
Risk factors via First Street. Map © Google.
Why this score? — see what drove the C- grade
The composite is a weighted blend of 9 inputs, each scored 0–100. Each bar is that input's sub-score; the figure is the points it added to the 100-point composite (weight × sub-score).
- Cash flow +17.5/30.0
- ARV discount +11.4/15.0
- DSCR +5.5/10.0
- Condition / age +5.0/5.0
- 1% rule +4.4/10.0
- Livability +4.3/5.0
- Schools +2.0/10.0
- Rent growth +1.1/5.0
- Appreciation +0.0/10.0
$255,000
🖨 Deal sheet 📄 Offer letter ✓ Due diligence
Listing remarks MLS
Remarks Move-In-Ready Middle Unit! The Amberjack Floor Plan by Beacon New Homes Features 3 Bedrooms with 2.5 Bathrooms located in the Palms at New Hampstead just minutes away from Savannah and Pooler! The Kitchen Showcases Stainless-Steel Appliances, an Island with Granite Countertops! Tray Ceiling in Master Bedroom and Quartz Countertops in all Bathrooms! Can Close in 30 Days or Less! Book Your Showing Today!
Key facts
- $125 HOA
- Garage
- Community pool
Tags
Neighborhood map
What this means for you Summary
Snapshot
- This is a 3-bed/2.5-bath townhouse listed at $255k. Condition is rated excellent.
Deal economics
- At list price, monthly cash flow is $197 ($2k/yr) — positive.
- The deal already cash-flows at list — no discount required.
- To meet the 1% rule (rent ≥ 1% of price), the offer needs to be $239k (6.2% below list).
- Recommended offer: $224k (12.0% below list) — sets the bar for market timing.
- Cap rate 7.2% vs local median 4.0% in Savannah — top-decile yield for the area; either an underpriced asset or a hidden risk that comps aren't pricing in. Stress-test before assuming the spread holds.
Location & tenants
- Location reads 86/100 on livability (#1 in GA, #397 nationally) — a professional / high-income tenant draw. Strengths: crime A+, amenities A+, commute A+; Watch: employment D, schools F.
- Savannah-Chatham County (urban): math 20% / reading 26% proficiency, ranked #134 of 174 in GA (top 77%) — low school quality limits family demand, transient renter base, plan for 1-2y turnover.
- Market conditions: Rents falling (-5.5%/yr); 262 active listings in the ZIP; 18 comparable units currently listed for rent nearby; rentals lingering (median 44d on market — plan ~5-8 weeks vacancy on turnover, expect pricing pressure); 89% of comp listings sitting > 30 days — soft ceiling on asking rent; 2,694 units permitted in Chatham County in 2024 (973 in 5+ unit buildings).
- This rent runs 42% of the median local income ($69k/yr) — at the standard rent-burdened threshold; future hikes will face affordability resistance.
Forward outlook
- Local home prices are declining (-3.0%/yr); year-one equity from $2k of loan paydown is wiped out by about $8k of value loss. Plan a longer hold.
- Chatham County population projected at +33% by 2050 — long-run rental-demand tailwind backs the buy-and-hold thesis.
Negotiation context
- It's been on market 156 days — a 12% lower offer ($224k) is reasonable based on typical stale-listing flexibility.
- 3 sale attempts; this cycle's ask has dropped $15k (6%) from the opening price — seller is motivated, your offer sets the floor, not the list.
Questions for the listing agent
- It's been on market 156 days. Have you received any prior offers? Is the seller open to a 12% concession, seller financing, or rate buy-down credit?
- What does the HOA fee cover, when was the last increase, and are there any pending special assessments or reserve-fund shortfalls?
- Why hasn't it sold? Are there any deal-killer items the seller is aware of (foundation, flood, title, zoning, code violations)?
- Is there a deadline driving the sale (1031 exchange, divorce, estate, relocation)? That informs how much negotiation room exists.
- Schools are F-rated, which usually means shorter tenancies and higher turnover. Who's the typical renter profile here, and what's been the actual vacancy rate?
- What's the average days-on-market for RENTAL listings here right now (not sales)? A rising rental-DOM trend means longer vacancies and softer asking-rent achievability than the comps imply.
- What's the recent tenant-quality profile in this submarket — average credit score on applications, eviction rate, late-payment / NSF rate, and stable-employment percentage? A property-management company in the area should have these aggregated.
- How much new for-sale + rental construction is in the pipeline within 1–3 miles? Heavy new supply typically softens prices + rents 12–24 months out; constrained supply supports both.
Investment metrics
- 1% rule
- 0.94% ✗
- Cap rate
- 7.22%
- Cash-on-cash
- 3.30%
- DSCR
- 1.15
- GRM
- 8.9
CMA / ARV
- ARV (median comp)
- $279,218
- List price
- $255,000
- Delta
- -8.67%
- Verdict
- FAIR
- Comps
- 6 within 1.0 mi
Show comp detail 6 sales within ~0.75 mi
| Address | Dist | Beds/Ba | Sqft | Sold | Price | $/sf | Match |
|---|---|---|---|---|---|---|---|
| 152 Stone Crab Cir | 0.03mi | 3/2.5 | 1,682 (0%) | 8mo | $285,000 | $169 | 92 |
| 160 Stone Crab Cir | 0.16mi | 3/2.5 | 1,682 (0%) | 3mo | $279,838 | $166 | 90 |
| 156 Stone Crab Cir | 0.12mi | 3/2.5 | 1,682 (0%) | 7mo | $285,000 | $169 | 88 |
| 162 Stone Crab Cir | 0.19mi | 3/2.5 | 1,682 (0%) | 8mo | $285,000 | $169 | 84 |
| 109 Islamorada Ln | 0.26mi | 3/2.5 | 1,509 (-10%) | 0mo | $255,000 | $169 | 70 |
| 101 Islamorada Ln | 0.26mi | 3/2.5 | 1,509 (-10%) | 1mo | $255,500 | $169 | 70 |
Match score weights: distance 35% · size 25% · config 20% · recency 20%. Top-matched comps best support the ARV.
Projected returns pro-forma
-3.0% appreciation · 0.0% rent growth · sell at horizon
- IRR
- -14.4%
- Equity multiple
- 0.50×
- Total profit
- $-35,822
- Equity at exit
- $38,021
- IRR
- -11.3%
- Equity multiple
- 0.41×
- Total profit
- $-42,196
- Equity at exit
- $22,048
Cash invested: $71,400 (down + closing). Projections, not guarantees.
Landlord ↔ Tenant lean methodology
- Overall (STATE)
- 90 Strongly Landlord-Friendly
- State Georgia
- 90 Strongly Landlord-Friendly · R+3
- County
- — inherits STATE
- City
- — inherits STATE
ZIP-level market 31302
- Home prices YoY
- -18.5%
- Rents YoY
- -5.5%
- Active inventory
- 262
- Price-to-rent
- 8.9×
Monthly cashflow live
- Estimated rent
- $2,392 high interval (Pro) →
- Mortgage (P&I)
- −$1,337
- Tax from tax record
- −$125 /mo · $1,497/yr
- Insurance
- −$106
- HOA
- −$125
- Vacancy / Maint / Mgmt
- −$502
- Net cashflow
- $197
Break-even live
UW: 25.0% down · 7.5% · 30yr · 1.5% tax · 5.0% vac · 8.0% maint · 8.0% mgmt
Financing live
Cash to close
- Down payment
- $63,750
- Closing costs
- $7,650
- Reserves months
- —
- Total cash needed
- —
Loan-product check · same deal, 3 products live
Conventional
25% down · 7.5% · 30yr
- Down + closing
- —
- Monthly P&I
- —
- Monthly cashflow
- —
- DSCR
- —
- Eligible?
- —
Personal DTI + credit; lowest rate.
DSCR
20% down · 8.5% · 30yr
- Down + closing
- —
- Monthly P&I
- —
- Monthly cashflow
- —
- DSCR
- —
- Eligible?
- —
No personal income docs; deal must DSCR.
Hard money
10% down · 12.0% · 12mo
- Down + closing
- —
- Monthly P&I
- —
- Monthly cashflow
- —
- DSCR
- —
- Eligible?
- —
Short-term bridge; refi at stabilization.
Rent comps 18 comps
| Address | Beds | Baths | Sqft | Rent | $/sqft | DOM | Units | Dist |
|---|---|---|---|---|---|---|---|---|
| 218 Justify Ave Savannah, GA | 4.0 | 2.5 | 2005 | $2,295 | $1.14 | 43d | 1 | 0.46mi |
| 228 Justify Ave Savannah, GA | 4.0 | 2.5 | 2005 | $2,295 | $1.14 | 43d | 1 | 0.46mi |
| 232 Justify Ave Savannah, GA | 4.0 | 2.5 | 2005 | $2,295 | $1.14 | 43d | 1 | 0.47mi |
| 238 Justify Ave Savannah, GA | 4.0 | 2.5 | 2005 | $2,295 | $1.14 | 43d | 1 | 0.47mi |
| 214 Justify Ave Savannah, GA | 4.0 | 2.5 | 2005 | $2,295 | $1.14 | 43d | 1 | 0.48mi |
| 244 Justify Ave Savannah, GA | 4.0 | 2.5 | 2005 | $2,295 | $1.14 | 43d | 1 | 0.48mi |
| 212 Justify Ave Savannah, GA | 4.0 | 2.5 | 2005 | $2,295 | $1.14 | 43d | 1 | 0.49mi |
| 248 Justify Ave Savannah, GA | 4.0 | 2.5 | 2005 | $2,295 | $1.14 | 43d | 1 | 0.49mi |
| 227 Justify Ave Savannah, GA | 4.0 | 2.5 | 2005 | $2,295 | $1.14 | 43d | 1 | 0.50mi |
| 231 Justify Ave Savannah, GA | 4.0 | 2.5 | 2005 | $2,295 | $1.14 | 43d | 1 | 0.51mi |
| 209 Justify Ave Savannah, GA | 4.0 | 2.5 | 2005 | $2,295 | $1.14 | 43d | 1 | 0.51mi |
| 206 Justify Ave Savannah, GA | 4.0 | 2.5 | 2005 | $2,295 | $1.14 | 43d | 1 | 0.52mi |
| 200 Justify Ave Savannah, GA | 4.0 | 2.5 | 2005 | $2,295 | $1.14 | 43d | 1 | 0.54mi |
| 154 Guana Ln Bloomingdale, GA | 4.0 | 3.5 | 1920 | $2,700 | $1.41 | 43d | 1 | 0.62mi |
| 455 Coconut Dr Bloomingdale, GA | 4.0 | 2.5 | 2174 | $2,350 | $1.08 | 43d | 1 | 0.89mi |
| 480 John Carter Rd Bloomingdale, GA | 1.0–3.0 | 1.0–2.0 | 1002 | $2,331 | $2.33 | 14d | 20 | 1.04mi |
| 404 Turpentine Trl Bloomingdale, GA | 4.0 | 2.0 | 1775 | $2,350 | $1.32 | 14d | 1 | 1.08mi |
| 214 Coneflower Rd Bloomingdale, GA | 3.0 | 2.5 | 1418 | $2,300 | $1.62 | 43d | 1 | 1.25mi |
HOA detail
- Monthly dues
- $125 · $1,500/yr
- Likely covers
- pool
Listing history 25 events
-
2026-06-19status $255,000 Pending 156 DOM
-
2026-06-18days on market $255,000 Active 156 DOM
-
2026-06-17days on market $255,000 Active 155 DOM
-
2026-06-16days on market $255,000 Active 154 DOM
-
2026-06-15days on market $255,000 Active 153 DOM
-
2026-06-14days on market $255,000 Active 151 DOM
-
2026-06-13days on market $255,000 Active 150 DOM
-
2026-06-10days on market $255,000 Active 148 DOM
-
2026-06-09days on market $255,000 Active 147 DOM
-
2026-06-08days on market $255,000 Active 146 DOM
-
2026-06-07days on market $255,000 Active 145 DOM
-
2026-06-05days on market $255,000 Active 142 DOM
-
2026-06-03days on market $255,000 Active 141 DOM
-
2026-06-02remarks 417-char remark
-
2026-06-02pricedays on market $255,000 Active 140 DOM
-
2026-06-01days on market $260,000 Active 139 DOM
-
2026-05-31days on market $260,000 Active 138 DOM
-
2026-05-30days on market $260,000 Active 137 DOM
-
2026-02-27price $260,000 414-char remark
Show marketing remark (414 chars)
Remarks Move-In-Ready Middle Unit! The Amberjack Floor Plan by Beacon New Homes Features 3 Bedrooms with 2.5 Bathrooms located in the Palms at New Hampstead just minutes away from Savannah and Pooler! The Kitchen Showcases Stainless-Steel Appliances, an Island with Granite Countertops! Tray Ceiling in Master Bedroom and Quartz Countertops in all Bathrooms! Can Close in 30 Days or Less! Book Your Showing Today!
-
2026-01-13$270,000 Active 414-char remark
Show marketing remark (414 chars)
Remarks Move-In-Ready Middle Unit! The Amberjack Floor Plan by Beacon New Homes Features 3 Bedrooms with 2.5 Bathrooms located in the Palms at New Hampstead just minutes away from Savannah and Pooler! The Kitchen Showcases Stainless-Steel Appliances, an Island with Granite Countertops! Tray Ceiling in Master Bedroom and Quartz Countertops in all Bathrooms! Can Close in 30 Days or Less! Book Your Showing Today!
-
2026-01-08status Active
-
2026-01-08price $270,000
-
2025-07-06historical
-
2025-07-06historical
-
2025-06-19$275,000
ⓘ Source: listings_history table (triggers on properties + properties_extension) + one-shot
backfill from property_details.listing_events for pre-trigger history.
Tax reassessment forecast GA · Resets to sale price
- Current annual tax
- $1,497 · $125/mo
- Projected year-2 tax
- $2,346 · $196/mo
- Expected delta
- +$849/yr (+$71/mo · 56.7%)
ⓘ Screening estimate from a state-policy table — verify with the county assessor before closing.
Nearby sold comps map
Loading sold comps map…
Walkable amenities ~0.75 mi
Loading nearby amenities…
Taxation est. · year 1
- Rental income
- $28,705
- − Mortgage interest
- −$14,284
- − Property taxes
- −$1,497
- − Insurance
- −$1,275
- − Repairs & maintenance
- −$2,296
- − Management
- −$2,296
- − HOA
- −$1,500
- − Depreciation
- −$7,418
- Taxable loss
- −$1,862
- Est. tax savings @ 24.0%
- +$447
- After-tax cash flow
- $2,805/yr
For passive investors: Depreciation is non-cash, so a rental often shows a tax loss while cash-flowing — sheltering income. Rental losses are passive: they offset passive income freely, and up to $25,000/yr can offset ordinary (W-2) income if you actively participate and your MAGI is under $100k (phasing out to $0 by $150k); unused losses carry forward. On sale, claimed depreciation is recaptured at up to 25%, and gains may owe capital-gains tax (a 1031 exchange can defer both). Figures are a year-1 estimate at your 24.0% rate — not tax advice; consult a CPA.
Condition & rehab AI · 12 photos
This move-in-ready townhouse is in excellent condition with new finishes and modern amenities. It's located in a desirable neighborhood and can close in 30 days or less.
Value-add opportunities
- Resale Painting exterior — Enhances curb appeal
- Resale Landscaping — Improves curb appeal
- Both Replace ceiling fans — Aesthetically pleasing and energy-efficient
Renovation cost estimate screening
Value-add ROI direction
- Resale Painting exterior — Enhances curb appeal ↑
- Resale Landscaping — Improves curb appeal ↑
- Both Replace ceiling fans — Aesthetically pleasing and energy-efficient ↑
ⓘ Cost ranges are severity-bucket heuristics (US national rule-of-thumb). Get contractor quotes + a written scope before underwriting a rehab budget.
Schools (NCES district)
- District
- Savannah-Chatham County
- NCES district ID
- 1301020
- Math proficiency
- 20% ▼ -11.00%
- Reading proficiency
- 26% ▼ -5.00%
- Median HH income
- $47,443
- Composite
- 20.14/100
- National rank
- #8639
- State rank
- #134 of 174 in GA
Livability — Savannah
- Score
- 86/100
- State rank
- #1
- US rank
- #397
Category grades
Schools grade is shown separately in the Schools card above.
Census & demographics
- Census place
- Savannah, GA
- County
- Effingham County · 68,439 people
- City population
- 216,564
- Metro
- Savannah, GA
- Population (ZIP)
- 8,899
- Household income
- $68,998
- Rent vs Own
- Severe rent burden
- 188.0
Population outlook (Chatham County) Hauer SSP2
- Today (2025)
- 332,584 people
- By 2030
- 355,508 · +6.9%
- By 2040
- 400,030 · +20.3%
- By 2050
- 443,019 · +33.2%
- By 2075
- 534,579 · +60.7%
- By 2100
- 583,863 · +75.6%
Race, ethnicity, and origin ACS 2023
- Neighborhood character
- Predominantly White (79%)
- Race & ethnicity
- White 79% Black 8% Two or more races 8% Hispanic / Latino 6%
- Hispanic origin (detail)
- Mexican 1%
- Common ancestry
- Serbian 2% Lithuanian 2% Italian 2%
- Foreign-born
- 3% · Canada, Dominican Republic
- Languages at home
- 96% English-only · Spanish 2% German/W. Germanic 1% Other Indo-European 1%
Political lean MEDSL · Chatham
- 2024 margin
- D (+18.0) · D 58.6% · R 40.6%
- 2008→2024 swing
- +3.6pp toward D · 2008: 14.4pp · 2024: 18.0pp
- All cycles
- 2024: D+18.0 2020: D+18.8 2016: D+14.5 2012: D+12.0 2008: D+14.4
Not yet ingested
- Civics
- —
Market trends
- HPI YoY
- ▼ -66.89%
- Current HPI
- 293.9427
- Rent YoY
- ▼ -5.51%
- Metro
- Savannah, GA
- State GDP YoY
- ▲ 2.66%
- F500 in state
- 28
Industry mix (Fortune 500 HQ in GA)
| Industry | F500 HQs | Revenue |
|---|---|---|
| Paper / Packaging | 2 | $29B |
|
||
| Retail | 1 | $160B |
|
||
| Transportation / Logistics | 1 | $91B |
|
||
| Airlines | 1 | $62B |
|
||
| Consumer Goods | 1 | $47B |
|
||
| Utilities | 1 | $25B |
|
||
Price history
-5.5% since first listed7 events — show timeline
- 2026-02-27 Price Changed $260,000 Hive MLS
- 2026-01-13 Listed $270,000 Hive MLS
- 2026-01-08 Relisted — Hive MLS
- 2026-01-08 Price Changed $270,000 Hive MLS
- 2025-07-06 Listing Removed — Hive MLS
- 2025-07-06 Listing Removed — Hive MLS
- 2025-06-19 Listed $275,000 Hive MLS
Cash-flow waterfall
monthlySold comps — $/sqft
last 12 mo · ≤1 miLoading sold comps…