142 Pink Footed Pass · Uhland, TX
Flood risk No data
- FEMA flood zone
- —
- Chance of flooding over 30 yrs
- —
- Est. flood insurance / yr
- —
Fire risk No data
- Est. fire insurance / yr
- —
Heat risk No data
- Hot days now (above threshold)
- —
- Hot days in 30 yrs
- —
Wind risk No data
- Chance of severe wind over 30 yrs
- —
Air-quality risk No data
- Unhealthy air days now
- —
- Unhealthy air days in 30 yrs
- —
Risk factors via First Street. Map © Google.
Why this score? — see what drove the D grade
The composite is a weighted blend of 9 inputs, each scored 0–100. Each bar is that input's sub-score; the figure is the points it added to the 100-point composite (weight × sub-score).
- Cash flow +12.2/30.0
- ARV discount +10.2/15.0
- Condition / age +4.0/5.0
- DSCR +3.6/10.0
- 1% rule +3.5/10.0
- Schools +3.5/10.0
- Livability +2.7/5.0
- Rent growth +2.4/5.0
- Appreciation +0.0/10.0
$204,999
🖨 Deal sheet 📄 Offer letter ✓ Due diligence
Listing remarks
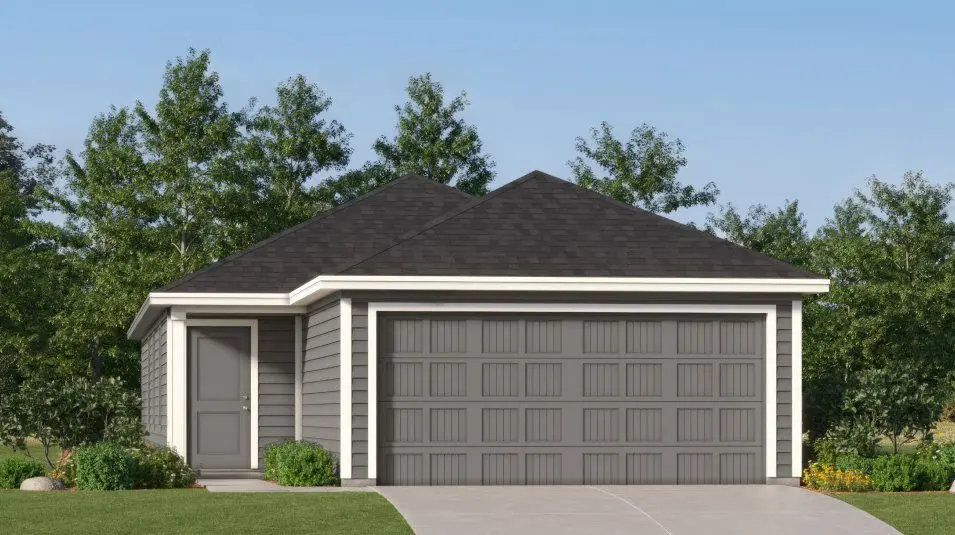
This single-level home showcases a spacious open floorplan shared between the kitchen, dining area and family room for easy entertaining. An owner's suite enjoys a private location at the front of the home, complemented by an en-suite bathroom and walk-in closet. There are two secondary bedrooms just off the main living areas, which are comfortable spaces for household members and overnight guests.
Key facts
- Walk-in closet
- Open floorplan
- Secondary bedrooms
Tags
Property features AI
Finance
- Other: Virtual tour available
- Financial info: List price $204,490
Exterior
- Parking: 2 garage spaces (2 total parking spaces)
- Home design: Single-family home, Gerson plan; Active listing
- Exterior features: Address: 142 Pink Footed Pass, Uhland, TX 78640
Interior
- Bedrooms: 3 bedrooms
- Bathrooms: 2 full bathrooms
- Interior features: Spec home (Gerson plan); Living area approximately 1,354
Neighborhood map
What this means for you Summary
Snapshot
- This is a 3-bed/2.0-bath single-family listed at $205k. Condition is rated good.
Deal economics
- At list price, monthly cash flow is $-43 ($-513/yr) — negative.
- To cash-flow at today's rent, offer at most $199k (3.0% below list).
- To meet the 1% rule (rent ≥ 1% of price), the offer needs to be $174k (15.2% below list).
- Recommended offer: $174k (15.2% below list) — sets the bar for 1% rule.
- Cap rate 6.0% vs local median 5.0% in Uhland — meaningfully above typical; check what's discounted (condition, days-on-market, listing class) to confirm the premium yield is real.
Location & tenants
- Location reads 54/100 on livability (#1,385 in TX) — a working-class tenant base; expect higher turnover. Strengths: cost of living A+, housing A+, crime A; Watch: employment C-, schools F, amenities F.
- Hays CISD (rural): math 35% / reading 41% proficiency, ranked #390 of 826 in TX (top 47%) — families likely to look elsewhere, expect single-tenant / working-renter base with shorter leases.
- Market conditions: Rents soft (-0.3%/yr); 1801 active listings in the ZIP; 6 comparable units currently listed for rent nearby; rentals at typical pace (median 24d on market — plan ~3-4 weeks tenant-placement turnaround); solid renter incomes; 5,270 units permitted in Hays County in 2024 (1,464 in 5+ unit buildings).
Forward outlook
- Local home prices are declining (-3.0%/yr); year-one equity from $1k of loan paydown is wiped out by about $6k of value loss. Plan a longer hold.
- Hays County population projected at +93% by 2050 — long-run rental-demand tailwind backs the buy-and-hold thesis.
Negotiation context
- Only 12 days on market — expect competitive offers; lowballing is unlikely to land.
Questions for the listing agent
- What do current leases actually rent for vs. the listed asking? Can we see a recent rent roll and the last 12 months of T-12 income?
- Is there a deadline driving the sale (1031 exchange, divorce, estate, relocation)? That informs how much negotiation room exists.
- Schools are F-rated, which usually means shorter tenancies and higher turnover. Who's the typical renter profile here, and what's been the actual vacancy rate?
- The area grade is low — what's the realistic commute time and amenity access for the typical tenant pool here? Any planned neighborhood developments (good or bad) we should know about?
- What's the average days-on-market for RENTAL listings here right now (not sales)? A rising rental-DOM trend means longer vacancies and softer asking-rent achievability than the comps imply.
- What's the recent tenant-quality profile in this submarket — average credit score on applications, eviction rate, late-payment / NSF rate, and stable-employment percentage? A property-management company in the area should have these aggregated.
- How much new for-sale + rental construction is in the pipeline within 1–3 miles? Heavy new supply typically softens prices + rents 12–24 months out; constrained supply supports both.
Investment metrics
- 1% rule
- 0.85% ✗
- Cap rate
- 6.04%
- Cash-on-cash
- -0.89%
- DSCR
- 0.96
- GRM
- 9.8
CMA / ARV
- ARV (on-the-fly)
- $217,994
- Comps found
- 12
Show comp detail 12 sales within ~0.75 mi
| Address | Dist | Beds/Ba | Sqft | Sold | Price | $/sf | Match |
|---|---|---|---|---|---|---|---|
| 143 Pink Footed Pass | 0.03mi | 3/2.0 | 1,354 (0%) | 1mo | $207,490 | $153 | 98 |
| 212 Pink Footed Pass | 0.07mi | 3/2.0 | 1,354 (0%) | 4mo | $208,490 | $154 | 94 |
| 183 Pink Footed Pass | 0.06mi | 3/2.0 | 1,380 (+2%) | 3mo | $205,490 | $149 | 92 |
| 707 Whoopers Loop | 0.07mi | 3/2.0 | 1,411 (+4%) | 2mo | $226,990 | $161 | 88 |
| 611 Whoopers Loop | 0.15mi | 3/2.0 | 1,402 (+4%) | 4mo | $216,490 | $154 | 84 |
| 184 Pink Footed Pass | 0.04mi | 3/2.0 | 1,213 (-10%) | 1mo | $203,490 | $168 | 80 |
| 204 Pink Footed Pass | 0.06mi | 3/2.0 | 1,213 (-10%) | 3mo | $205,490 | $169 | 78 |
| 151 Pink Footed Pass | 0.03mi | 4/2.0 (+1) | 1,483 (+10%) | 2mo | $219,490 | $148 | 76 |
| 173 Muscovy Dr | 0.45mi | 3/2.0 | 1,260 (-7%) | 2mo | $215,990 | $171 | 66 |
| 127 Orange Flame Blvd | 0.69mi | 3/2.0 | 1,329 (-2%) | 1mo | $219,990 | $166 | 64 |
| 135 Orange Flame Blvd | 0.68mi | 4/2.0 (+1) | 1,485 (+10%) | 1mo | $231,990 | $156 | 46 |
| 132 Celosia Loop | 0.70mi | 4/2.0 (+1) | 1,485 (+10%) | 3mo | $249,990 | $168 | 44 |
Match score weights: distance 35% · size 25% · config 20% · recency 20%. Top-matched comps best support the ARV.
Projected returns pro-forma
-3.0% appreciation · 0.0% rent growth · sell at horizon
- IRR
- -21.2%
- Equity multiple
- 0.29×
- Total profit
- $-41,012
- Equity at exit
- $30,566
- IRR
- -23.8%
- Equity multiple
- -0.02×
- Total profit
- $-58,808
- Equity at exit
- $17,725
Cash invested: $57,400 (down + closing). Projections, not guarantees.
Landlord ↔ Tenant lean methodology
- Overall (STATE)
- 87 Strongly Landlord-Friendly
- State Texas
- 87 Strongly Landlord-Friendly · R+5
- County
- — inherits STATE
- City
- — inherits STATE
ZIP-level market 78640
- Home prices YoY
- -33.8%
- Rents YoY
- -0.3%
- Active inventory
- 1801
- Price-to-rent
- 9.8×
Monthly cashflow live
- Estimated rent
- $1,739 high interval (Pro) →
- Mortgage (P&I)
- −$1,075
- Tax est. 1.5%
- −$256 /mo · $3,075/yr
- Insurance
- −$85
- HOA
- −$0
- Vacancy / Maint / Mgmt
- −$365
- Net cashflow
- $-43
Break-even live
UW: 25.0% down · 7.5% · 30yr · 1.5% tax · 5.0% vac · 8.0% maint · 8.0% mgmt
Financing live
Cash to close
- Down payment
- $51,250
- Closing costs
- $6,150
- Reserves months
- —
- Total cash needed
- —
Loan-product check · same deal, 3 products live
Conventional
25% down · 7.5% · 30yr
- Down + closing
- —
- Monthly P&I
- —
- Monthly cashflow
- —
- DSCR
- —
- Eligible?
- —
Personal DTI + credit; lowest rate.
DSCR
20% down · 8.5% · 30yr
- Down + closing
- —
- Monthly P&I
- —
- Monthly cashflow
- —
- DSCR
- —
- Eligible?
- —
No personal income docs; deal must DSCR.
Hard money
10% down · 12.0% · 12mo
- Down + closing
- —
- Monthly P&I
- —
- Monthly cashflow
- —
- DSCR
- —
- Eligible?
- —
Short-term bridge; refi at stabilization.
Rent comps 6 comps
| Address | Beds | Baths | Sqft | Rent | $/sqft | DOM | Units | Dist |
|---|---|---|---|---|---|---|---|---|
| 151 Pink Footed Pass Uhland, TX | 4.0 | 2.0 | 1483 | $1,600 | $1.08 | 23d | 1 | 0.03mi |
| 177 Pink Footed Pass Uhland, TX | 4.0 | 2.0 | 1483 | $1,525 | $1.03 | 43d | 1 | 0.04mi |
| 177 Pink Footed Pass Uhland, TX | 4.0 | 2.0 | 1483 | $1,525 | $1.03 | 23d | 1 | 0.04mi |
| 263 Speckled Belly Bnd Uhland, TX | 4.0 | 2.0 | 1600 | $1,650 | $1.03 | 16d | 1 | 0.10mi |
| 129 Pineland Ave Niederwald, TX | 3.0 | 2.0 | 1460 | $1,414 | $0.97 | 12d | 1 | 0.45mi |
| 787 Arnold Loop , TX | 3.0 | 2.5 | 1840 | $2,300 | $1.25 | 1d | 1 | 0.75mi |
Listing history 9 events
-
2026-06-18days on market $204,999 Active 12 DOM
-
2026-06-17pricedays on market $204,999 Active 11 DOM
-
2026-06-16days on market $204,490 Active 10 DOM
-
2026-06-15days on market $204,490 Active 9 DOM
-
2026-06-13days on market $204,490 Active 7 DOM
-
2026-06-09days on market $204,490 Active 3 DOM
-
2026-06-08days on market $204,490 Active 2 DOM
-
2026-06-07remarks 401-char remark
-
2026-06-07$204,490 Active 1 DOM
ⓘ Source: listings_history table (triggers on properties + properties_extension) + one-shot
backfill from property_details.listing_events for pre-trigger history.
Nearby sold comps map
Loading sold comps map…
Walkable amenities ~0.75 mi
Loading nearby amenities…
Taxation est. · year 1
- Rental income
- $20,870
- − Mortgage interest
- −$11,483
- − Property taxes
- −$3,075
- − Insurance
- −$1,025
- − Repairs & maintenance
- −$1,670
- − Management
- −$1,670
- − Depreciation
- −$5,964
- Taxable loss
- −$4,016
- Est. tax savings @ 24.0%
- +$964
- After-tax cash flow
- $451/yr
For passive investors: Depreciation is non-cash, so a rental often shows a tax loss while cash-flowing — sheltering income. Rental losses are passive: they offset passive income freely, and up to $25,000/yr can offset ordinary (W-2) income if you actively participate and your MAGI is under $100k (phasing out to $0 by $150k); unused losses carry forward. On sale, claimed depreciation is recaptured at up to 25%, and gains may owe capital-gains tax (a 1031 exchange can defer both). Figures are a year-1 estimate at your 24.0% rate — not tax advice; consult a CPA.
Condition & rehab AI · 13 photos
This single-level home features a spacious open floorplan with modern appliances and neutral paint. It is in good condition with minor cosmetic updates needed for the exterior and landscaping.
Value-add opportunities
- Resale Paint exterior siding — Enhances curb appeal
- Rental Trim landscaping — Improves curb appeal and enhances property value
Renovation cost estimate screening
Value-add ROI direction
- Resale Paint exterior siding — Enhances curb appeal ↑
- Rental Trim landscaping — Improves curb appeal and enhances property value ↑
ⓘ Cost ranges are severity-bucket heuristics (US national rule-of-thumb). Get contractor quotes + a written scope before underwriting a rehab budget.
Schools (NCES district)
- District
- Hays CISD
- NCES district ID
- 4800010
- Math proficiency
- 35% ▼ -15.00%
- Reading proficiency
- 41% ▼ -5.00%
- Median HH income
- $70,570
- Composite
- 34.78/100
- National rank
- #5118
- State rank
- #390 of 826 in TX
Livability — Uhland
- Score
- 54/100
- State rank
- #1385
- US rank
- #23774
Category grades
Schools grade is shown separately in the Schools card above.
Census & demographics
- Census place
- Uhland, TX
- County
- Hays County · 280,138 people
- Metro
- Austin-Round Rock-Georgetown, TX
- Population (ZIP)
- 77,531
- Household income
- $90,075
- Rent vs Own
- Severe rent burden
- 2552.0
Population outlook (Hays County) Hauer SSP2
- Today (2025)
- 286,948 people
- By 2030
- 336,923 · +17.4%
- By 2040
- 441,894 · +54.0%
- By 2050
- 553,462 · +92.9%
- By 2075
- 838,261 · +192.1%
- By 2100
- 1,063,658 · +270.7%
Race, ethnicity, and origin ACS 2023
- Neighborhood character
- Diverse neighborhood (Simpson 0.56)
- Race & ethnicity
- Hispanic / Latino 55% White 36% Two or more races 29% Black 5% Native American 1%
- Hispanic origin (detail)
- Mexican 47% Puerto Rican 1%
- Common ancestry
- Italian 2% Slovak 2% Lithuanian 1%
- Foreign-born
- 13% · Canada
- Languages at home
- 63% English-only · Spanish 35%
Political lean MEDSL · Hays
- 2024 margin
- Lean D (+5.7) · D 52.1% · R 46.5% · Other 1.4%
- 2008→2024 swing
- +7.7pp toward D · 2008: -2.0pp · 2024: 5.7pp
- All cycles
- 2024: D+5.7 2020: D+10.8 2016: R+0.9 2012: R+10.4 2008: R+2.0
Not yet ingested
- Civics
- —
Market trends
- HPI YoY
- ▼ -92.64%
- Current HPI
- 181.7969
- Rent YoY
- ▼ -0.34%
- Metro
- Austin-Round Rock-Georgetown, TX
- State GDP YoY
- ▲ 3.95%
- F500 in state
- 110
Industry mix (Fortune 500 HQ in TX)
| Industry | F500 HQs | Revenue |
|---|---|---|
| Energy | 16 | $1,198B |
|
||
| Technology | 5 | $198B |
|
||
| Engineering / Construction | 4 | $72B |
|
||
| Energy Services | 3 | $60B |
|
||
| Utilities | 3 | $41B |
|
||
| Healthcare | 2 | $330B |
|
||
Cash-flow waterfall
monthlySold comps — $/sqft
last 12 mo · ≤1 miLoading sold comps…