201 Craft St · Calhoun Falls, SC
Flood risk 1/10 · Minimal
- FEMA flood zone
- X (unshaded)
- Chance of flooding over 30 yrs
- 0.0%
- Est. flood insurance / yr
- $507 – $1,088
Fire risk 4/10 · Minor
- Est. fire insurance / yr
- $783 – $1,453
Heat risk 6/10 · Moderate
- Hot days now (above 106°F)
- 7 days/yr
- Hot days in 30 yrs
- 17 days/yr
Wind risk 6/10 · Moderate
- Chance of severe wind over 30 yrs
- 27.0%
Air-quality risk 3/10 · Minor
- Unhealthy air days now
- 2 days/yr
- Unhealthy air days in 30 yrs
- 4 days/yr
Risk factors via First Street. Map © Google.
Why this score? — see what drove the C+ grade
The composite is a weighted blend of 9 inputs, each scored 0–100. Each bar is that input's sub-score; the figure is the points it added to the 100-point composite (weight × sub-score).
- Cash flow +20.1/30.0
- Appreciation +9.8/10.0
- ARV discount +7.5/15.0
- DSCR +6.4/10.0
- 1% rule +4.2/10.0
- Schools +4.1/10.0
- Livability +3.2/5.0
- Rent growth +2.5/5.0
- Condition / age +2.5/5.0
$93,000
🖨 Deal sheet (PDF) 📄 Offer letter ✓ Due diligence
Listing remarks
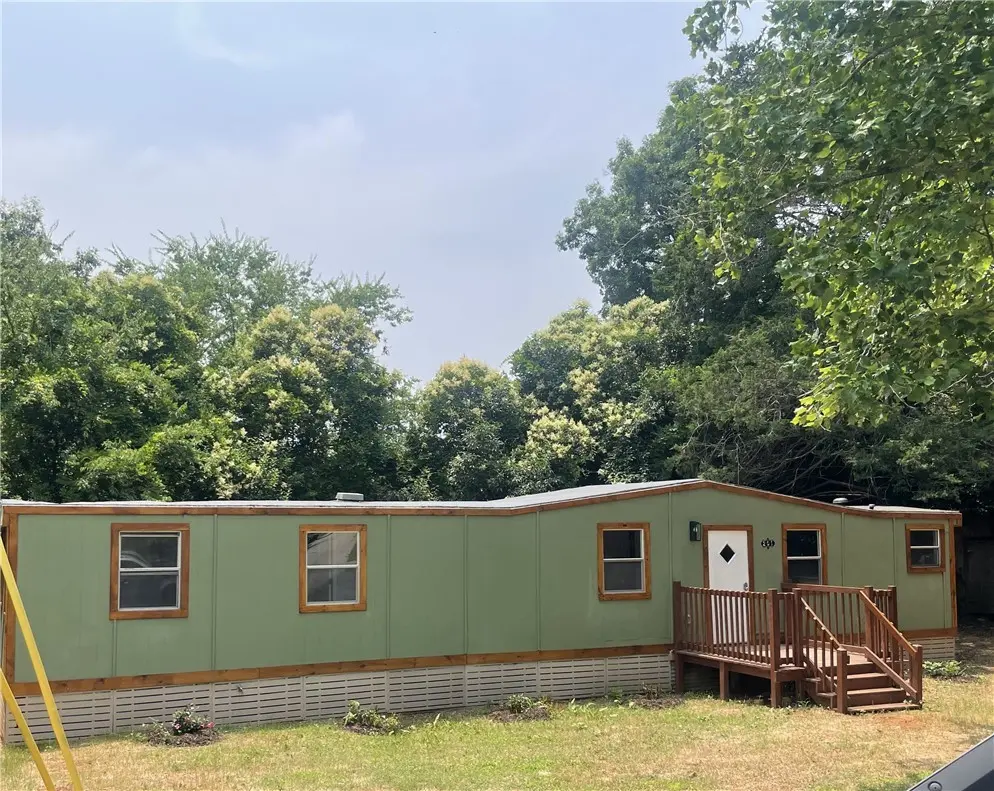
Discover the charm of small-town living in this fully remodeled mobile home, offering an ideal blend of comfort and convenience. This delightful residence provides an exceptional opportunity for a starter home, a savvy investment property, or an affordable lakeside retreat. The home features two inviting bedrooms and one bathroom, meticulously updated to provide a fresh and modern living experience. Enjoy the peace of mind that comes with updated electrical wiring and all-new plumbing and fixtures. Two brand-new decks extend the living space outdoors, perfect for relaxing and enjoying the serene surroundings. The kitchen is well-appointed with a dishwasher, electric range/oven, and refriger
Key facts
- All new plumbing
- Two brand new decks
- 0.25 acre lot
Tags
Property features AI
Finance
- HOA & community: Annual association fee
Exterior
- Utilities: Public sewer
- Home design: Single-story home; Single wide mobile home
- Construction: Cement siding; Over 50 years old
- Exterior features: City lot; Not in a subdivision; Horses allowed
Interior
- Bedrooms: 2 main-level bedrooms
- Flooring: Laminate
- Bathrooms: 1 full bathroom (main level)
- Heating & cooling: Central heating (electric); Central air conditioning (electric)
- Interior features: Laminate flooring
Neighborhood map
What this means for you Summary
Snapshot
- This is a 2-bed/1.0-bath manufactured listed at $93k.
Deal economics
- At list price, monthly cash flow is $116 ($1k/yr) — positive.
- The deal already cash-flows at list — no discount required.
- To meet the 1% rule (rent ≥ 1% of price), the offer needs to be $85k (8.4% below list).
- Recommended offer: $85k (8.4% below list) — sets the bar for 1% rule.
Location & tenants
- Location reads 63/100 on livability (#174 in SC) — a middle-class / working-renter tenant base. Strengths: cost of living A+, housing A+, crime A-; Watch: health & safety C-, amenities F, commute F.
- Abbeville 60 (rural): math 50% / reading 49% proficiency, ranked #15 of 80 in SC (top 19%) — families likely to look elsewhere, expect single-tenant / working-renter base with shorter leases.
- Zoned schools: John C. Calhoun Elementary (math 37% / reading 32%, grade F, #344 of 597 statewide, top 60%, 149 students, 100% FRL); Wright Middle (math 37% / reading 39%, grade F, #86 of 229 statewide, top 39%, 346 students, 100% FRL); Abbeville High (math 77% / reading 77%, grade A-, #28 of 196 statewide, top 16%, 473 students, 74% FRL) — zoned schools average 91% FRL vs 57% district-wide (35 pts higher); higher-poverty schools than district average — tighter screening recommended.
- Market conditions: 25 active listings in the ZIP; 145 units permitted in Abbeville County in 2024 (0 in 5+ unit buildings).
Forward outlook
- In year one you build about $9k of equity ($643 loan paydown + $9k appreciation (9.5% local appreciation)).
- Abbeville County population projected at -17% by 2050 — secular population decline; favor cash flow + early exit over multi-decade hold.
- At projected returns (9.5% appreciation + 3.0% rent growth), your $26k cash investment doubles in ~3 years — after that, you're playing with house money.
- By year 4, paydown + projected appreciation supports a ~$33k cash-out refi (75% LTV) — recoverable capital for the next deal without selling this one.
Negotiation context
- It's been on market 54 days — a 3% lower offer ($90k) is reasonable based on typical stale-listing flexibility.
- 2 sale attempts with the ask held roughly flat each time — persistent listings suggest the price (not the market) is what's stuck; bring a comps-based counter.
Risks & watch-outs
- Climate carrying-cost: major wind risk, 27% chance of damaging wind over 30y; extreme-heat days projected 7→17/yr by 2055 (HVAC capex compounding) — expect insurance premiums to compound above CPI over the hold.
Questions for the listing agent
- It's been on market 54 days. Have you received any prior offers? Is the seller open to a 8% concession, seller financing, or rate buy-down credit?
- Built in 1970 — when were the roof, HVAC, electrical panel, plumbing, and water heater last replaced?
- Is there a deadline driving the sale (1031 exchange, divorce, estate, relocation)? That informs how much negotiation room exists.
- Schools are D-rated, which usually means shorter tenancies and higher turnover. Who's the typical renter profile here, and what's been the actual vacancy rate?
- What's the average days-on-market for RENTAL listings here right now (not sales)? A rising rental-DOM trend means longer vacancies and softer asking-rent achievability than the comps imply.
- What's the recent tenant-quality profile in this submarket — average credit score on applications, eviction rate, late-payment / NSF rate, and stable-employment percentage? A property-management company in the area should have these aggregated.
- How much new for-sale + rental construction is in the pipeline within 1–3 miles? Heavy new supply typically softens prices + rents 12–24 months out; constrained supply supports both.
Investment metrics
- 1% rule
- 0.92% ✗
- Cap rate
- 7.79%
- Cash-on-cash
- 5.35%
- DSCR
- 1.24
- GRM
- 9.1
CMA / ARV
- ARV (on-the-fly)
- $23,519
- Comps found
- 1
Show comp detail 1 sale within ~0.75 mi
| Address | Dist | Beds/Ba | Sqft | Sold | Price | $/sf | Match |
|---|---|---|---|---|---|---|---|
| 724 Kershaw St | 0.10mi | 2/1.0 | 700 (-14%) | 19mo | $20,000 | $29 | 57 |
Match score weights: distance 35% · size 25% · config 20% · recency 20%. Top-matched comps best support the ARV.
Projected returns pro-forma
9.51% appreciation · 3.0% rent growth · sell at horizon
- IRR
- 27.2%
- Equity multiple
- 3.11×
- Total profit
- $54,897
- Equity at exit
- $80,480
- IRR
- 23.9%
- Equity multiple
- 6.95×
- Total profit
- $155,025
- Equity at exit
- $170,161
Cash invested: $26,040 (down + closing). Projections, not guarantees.
Landlord ↔ Tenant lean methodology
- Overall (STATE)
- 90 Strongly Landlord-Friendly
- State South Carolina
- 90 Strongly Landlord-Friendly · R+6
- County
- — inherits STATE
- City
- — inherits STATE
ZIP-level market 29628
- Home prices YoY
- 4.5%
- Active inventory
- 25
- Price-to-rent
- 9.1×
Monthly cashflow live
- Estimated rent
- $852 medium interval (Pro) →
- Mortgage (P&I)
- −$488
- Tax from tax record
- −$31 /mo · $370/yr
- Insurance
- −$39
- HOA
- −$0
- Vacancy / Maint / Mgmt
- −$179
- Net cashflow
- $116
Break-even live
Sensitivity live
| Price | -10% $169 | -5% $142 | +0% $116 | +5% $90 | +10% $63 |
|---|---|---|---|---|---|
| Rent | -10% $49 | -5% $82 | +0% $116 | +5% $150 | +10% $183 |
| Rate | -1.0pp $163 | -0.5pp $140 | base $116 | +0.5pp $92 | +1.0pp $67 |
UW: 25.0% down · 7.5% · 30yr · 1.5% tax · 5.0% vac · 8.0% maint · 8.0% mgmt
Financing live
Cash to close
- Down payment
- $23,250
- Closing costs
- $2,790
- Reserves months
- —
- Total cash needed
- —
Loan-product check · same deal, 3 products live
Conventional
25% down · 7.5% · 30yr
- Down + closing
- —
- Monthly P&I
- —
- Monthly cashflow
- —
- DSCR
- —
- Eligible?
- —
Personal DTI + credit; lowest rate.
DSCR
20% down · 8.5% · 30yr
- Down + closing
- —
- Monthly P&I
- —
- Monthly cashflow
- —
- DSCR
- —
- Eligible?
- —
No personal income docs; deal must DSCR.
Hard money
10% down · 12.0% · 12mo
- Down + closing
- —
- Monthly P&I
- —
- Monthly cashflow
- —
- DSCR
- —
- Eligible?
- —
Short-term bridge; refi at stabilization.
Listing history 17 events
-
2026-06-22days on market $93,000 Active 54 DOM
-
2026-06-18days on market $93,000 Active 51 DOM
-
2026-06-17days on market $93,000 Active 50 DOM
-
2026-06-16days on market $93,000 Active 49 DOM
-
2026-06-15days on market $93,000 Active 48 DOM
-
2026-06-13days on market $93,000 Active 46 DOM
-
2026-06-10days on market $93,000 Active 43 DOM
-
2026-06-09days on market $93,000 Active 42 DOM
-
2026-06-08days on market $93,000 Active 41 DOM
-
2026-06-07days on market $93,000 Active 40 DOM
-
2026-06-03days on market $93,000 Active 36 DOM
-
2026-06-03days on market $93,000 Active 35 DOM
-
2026-06-01days on market $93,000 Active 34 DOM
-
2026-05-31days on market $93,000 Active 33 DOM
-
2026-04-28$93,000 Active
-
2025-09-30historical
-
2025-06-06$110,000 Active
ⓘ Source: listings_history table (triggers on properties + properties_extension) + one-shot
backfill from property_details.listing_events for pre-trigger history.
Tax reassessment forecast SC · Resets to sale price
- Current annual tax
- $370 · $31/mo
- Projected year-2 tax
- $530 · $44/mo
- Expected delta
- +$160/yr (+$13/mo · 43.1%)
ⓘ Screening estimate from a state-policy table — verify with the county assessor before closing.
Climate risk First Street
- Flood 1/10 Low FEMA zone X (unshaded) · 0% chance over 30 yrs
- Wildfire 4/10 Moderate
- Heat 6/10 Major 7 d/yr ≥106°F today · 17 d/yr by 30 yrs out
- Wind 6/10 Major 27% chance of damaging wind over 30 yrs
- Air quality 3/10 Moderate 2 unhealthy d/yr today · 4 by 30 yrs out
Nearby sold comps map
Loading sold comps map…
Walkable amenities ~0.75 mi
Loading nearby amenities…
Taxation est. · year 1
- Rental income
- $10,228
- − Mortgage interest
- −$5,209
- − Property taxes
- −$370
- − Insurance
- −$465
- − Repairs & maintenance
- −$818
- − Management
- −$818
- − Depreciation
- −$2,705
- Taxable loss
- −$159
- Est. tax savings @ 24.0%
- +$38
- After-tax cash flow
- $1,430/yr
For passive investors: Depreciation is non-cash, so a rental often shows a tax loss while cash-flowing — sheltering income. Rental losses are passive: they offset passive income freely, and up to $25,000/yr can offset ordinary (W-2) income if you actively participate and your MAGI is under $100k (phasing out to $0 by $150k); unused losses carry forward. On sale, claimed depreciation is recaptured at up to 25%, and gains may owe capital-gains tax (a 1031 exchange can defer both). Figures are a year-1 estimate at your 24.0% rate — not tax advice; consult a CPA.
Schools (NCES district)
- District
- Abbeville 60
- NCES district ID
- 4500690
- Math proficiency
- 50% ▼ -12.00%
- Reading proficiency
- 49% ▼ -7.00%
- Median HH income
- $34,522
- Composite
- 40.9/100
- National rank
- #3618
- State rank
- #15 of 80 in SC
Livability — Calhoun Falls
- Score
- 63/100
- State rank
- #174
- US rank
- #15527
Category grades
Schools grade is shown separately in the Schools card above.
Census & demographics
- Census place
- Calhoun Falls, SC
- Population (ZIP)
- 2,405
Population outlook (Abbeville County) Hauer SSP2
- Today (2025)
- 24,141 people
- By 2030
- 23,446 · -2.9%
- By 2040
- 21,768 · -9.8%
- By 2050
- 20,098 · -16.7%
- By 2075
- 16,518 · -31.6%
- By 2100
- 13,125 · -45.6%
Race, ethnicity, and origin ACS 2023
- Neighborhood character
- Majority Black (53%)
- Race & ethnicity
- Black 53% White 43% Two or more races 4%
- Common ancestry
- Italian 1% Lithuanian 1% Serbian 1%
Political lean MEDSL · Abbeville
- 2024 margin
- Solid R (+42.4) · D 28.2% · R 70.6% · Other 1.2%
- 2008→2024 swing
- -27.2pp toward R · 2008: -15.2pp · 2024: -42.4pp
- All cycles
- 2024: R+42.4 2020: R+33.1 2016: R+28.3 2012: R+13.4 2008: R+15.2
Not yet ingested
- Civics
- —
Market trends
- HPI YoY
- ▲ 9.51%
- Current HPI
- 218.3679
- Rent YoY
- —
- Metro
- —
- State GDP YoY
- ▲ 4.51%
- F500 in state
- 2
Industry mix (Fortune 500 HQ in SC)
| Industry | F500 HQs | Revenue |
|---|---|---|
| Packaging | 1 | $7B |
|
||
Price history
-15.5% since first listed3 events — show timeline
- 2026-04-28 Listed $93,000 WUMLS
- 2025-09-30 Listing Removed — WUMLS
- 2025-06-06 Listed $110,000 WUMLS
Property tax history
+12.3%/yrLatest (2025): $370 · +1.1% YoY. Source: county tax records.
Cash-flow waterfall
monthlySold comps — $/sqft
last 12 mo · ≤1 miLoading sold comps…