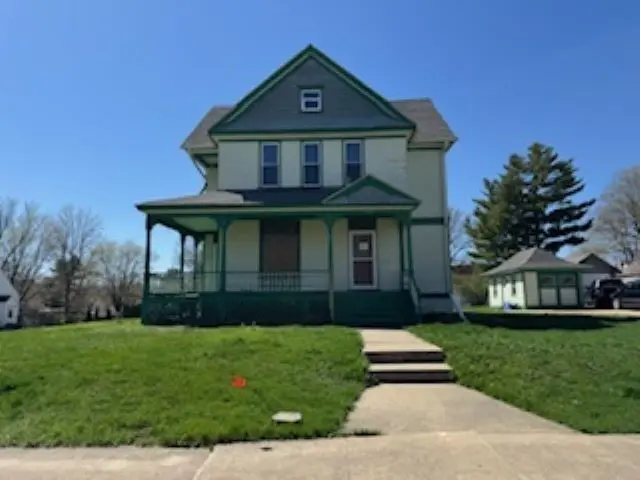
1007 7th St · Grundy Center, IA
Flood risk 1/10 · Minimal
- FEMA flood zone
- X (unshaded)
- Chance of flooding over 30 yrs
- 0.0%
- Est. flood insurance / yr
- $473 – $860
Fire risk 1/10 · Minimal
- Est. fire insurance / yr
- $902 – $1,676
Heat risk 3/10 · Minor
- Hot days now (above 100°F)
- 7 days/yr
- Hot days in 30 yrs
- 16 days/yr
Wind risk 2/10 · Minimal
- Chance of severe wind over 30 yrs
- —
Air-quality risk 1/10 · Minimal
- Unhealthy air days now
- 0 days/yr
- Unhealthy air days in 30 yrs
- 0 days/yr
Risk factors via First Street. Map © Google.
Why this score? — see what drove the B grade
The composite is a weighted blend of 9 inputs, each scored 0–100. Each bar is that input's sub-score; the figure is the points it added to the 100-point composite (weight × sub-score).
- Cash flow +30.0/30.0
- DSCR +10.0/10.0
- 1% rule +9.8/10.0
- ARV discount +7.5/15.0
- Schools +7.0/10.0
- Livability +4.0/5.0
- Rent growth +2.5/5.0
- Condition / age +2.5/5.0
- Appreciation +0.0/10.0
$80,000
🖨 Deal sheet 📄 Offer letter ✓ Due diligence
Listing remarks MLS
Character in this large dimension 2 story property. Three upper level bedrooms, 1 full bath, lots of original woodwork, a nice wood rail, open stairway to the second floor. Full unfinished basement. Central air and gas heating. Open and covered entry porch across the front of the house. Single detached garage. If property was built prior to 1978, Lead Base Paint potentially exists. Property may qualify for Seller Financing. Contact your agent for info. All information believed accurate but not guaranteed.
Key facts
- Open stairway
- Original woodwork
- Entry porch
Tags
Property features AI
Exterior
- Parking: Detached 1-car garage
- Utilities: Public water; Public sewer
- Home design: Single family residence; Two-story
- Construction: Frame construction with wood siding
- Exterior features: Lot approximately 0.26 acres (100 x 111)
Interior
- Bathrooms: One full bathroom
- Heating & cooling: Central air conditioning; Forced air heating
- Interior features: Basement
Neighborhood map
What this means for you Summary
Snapshot
- This is a 3-bed/2.0-bath single-family listed at $80k.
Deal economics
- At list price, monthly cash flow is $311 ($4k/yr) — positive.
- The deal already cash-flows at list — no discount required.
- Meets the 1% rule at list price ($1k rent vs $80k).
- Recommended offer: $79k (1.5% below list) — sets the bar for market timing.
Location & tenants
- Location reads 81/100 on livability (#68 in IA, #1,503 nationally) — a professional / high-income tenant draw. Strengths: crime A+, cost of living A+, housing A+; Watch: amenities F, commute F.
- Grundy Center Community School District (rural): math 80% / reading 85% proficiency, ranked #17 of 289 in IA (top 6%) — strong family-tenant draw, lease renewals of 3-5y typical.
- Zoned schools: Grundy Center Elementary School (math 82% / reading 77%, grade A, #71 of 616 statewide, top 15%, 277 students, 34% FRL); Grundy Center Middle School (math 80% / reading 87%, grade A+, #11 of 246 statewide, top 4%, 212 students, 21% FRL); Grundy Center High School (math 77% / reading 87%, grade A, #20 of 336 statewide, top 7%, 235 students, 28% FRL).
- Market conditions: 35 active listings in the ZIP; 14 units permitted in Grundy County in 2024 (0 in 5+ unit buildings).
Forward outlook
- Local home prices are declining (-3.0%/yr); year-one equity from $553 of loan paydown is wiped out by about $2k of value loss. Plan a longer hold.
- At projected returns (-3.0% appreciation + 3.0% rent growth), your $22k cash investment doubles in ~8 years — after that, you're playing with house money.
Negotiation context
- It's been on market 18 days — a 2% lower offer ($79k) is reasonable based on typical stale-listing flexibility.
- 3 sale attempts since 5y ago with the ask held roughly flat each time — persistent listings suggest the price (not the market) is what's stuck; bring a comps-based counter.
Risks & watch-outs
- Watch-outs: property tax is 2.6% of price; built in 1896 — expect roof / HVAC / electrical / plumbing capex.
Questions for the listing agent
- Built in 1896 — when were the roof, HVAC, electrical panel, plumbing, and water heater last replaced?
- Property tax is high relative to price — has the assessment been appealed recently, and will the sale trigger a re-assessment?
- Is there a deadline driving the sale (1031 exchange, divorce, estate, relocation)? That informs how much negotiation room exists.
- Schools are A-rated — typically a magnet for longer-tenancy family renters. What's the average tenant stay here, and is there a school-zone premium baked into asking?
- What's the average days-on-market for RENTAL listings here right now (not sales)? A rising rental-DOM trend means longer vacancies and softer asking-rent achievability than the comps imply.
- What's the recent tenant-quality profile in this submarket — average credit score on applications, eviction rate, late-payment / NSF rate, and stable-employment percentage? A property-management company in the area should have these aggregated.
- How much new for-sale + rental construction is in the pipeline within 1–3 miles? Heavy new supply typically softens prices + rents 12–24 months out; constrained supply supports both.
Investment metrics
- 1% rule
- 1.48% ✓
- Cap rate
- 10.96%
- Cash-on-cash
- 16.65%
- DSCR
- 1.74
- GRM
- 5.6
CMA / ARV
- ARV (on-the-fly)
- $271,440
- Comps found
- 12
Show comp detail 12 sales within ~0.75 mi
| Address | Dist | Beds/Ba | Sqft | Sold | Price | $/sf | Match |
|---|---|---|---|---|---|---|---|
| 1106 4th St St | 0.26mi | 3/2.5 | 2,272 (-2%) | 8mo | $300,000 | $132 | 76 |
| 702 M Avenue Ave | 0.15mi | 4/2.0 (+1) | 2,160 (-7%) | 7mo | $215,000 | $100 | 70 |
| 309 E H Ave | 0.36mi | 3/2.0 | 2,450 (+6%) | 10mo | $319,000 | $130 | 66 |
| 706 I Ave | 0.10mi | 4/2.0 (+1) | 2,186 (-6%) | 21mo | $162,000 | $74 | 63 |
| 1203 12th St | 0.36mi | 4/2.0 (+1) | 2,042 (-12%) | 1mo | $310,000 | $152 | 58 |
| 201 8th St | 0.55mi | 4/3.0 (+1) | 2,394 (+3%) | 4mo | $305,000 | $127 | 56 |
| 305 2nd St | 0.63mi | 4/2.5 (+1) | 2,148 (-7%) | 0mo | $260,000 | $121 | 51 |
| 405 G Ave | 0.33mi | 3/2.0 | 2,106 (-9%) | 22mo | $168,500 | $80 | 50 |
| 704 4th St | 0.32mi | 4/2.0 (+1) | 2,063 (-11%) | 15mo | $179,900 | $87 | 50 |
| 209 G Ave | 0.45mi | 4/2.0 (+1) | 2,009 (-13%) | 8mo | $235,000 | $117 | 45 |
| 805 D Ave | 0.47mi | 4/2.0 (+1) | 2,505 (+8%) | 18mo | $265,000 | $106 | 45 |
| 1003 I Avenue Ave | 0.26mi | 4/2.5 (+1) | 2,666 (+15%) | 18mo | $240,000 | $90 | 41 |
Match score weights: distance 35% · size 25% · config 20% · recency 20%. Top-matched comps best support the ARV.
Projected returns pro-forma
-3.0% appreciation · 3.0% rent growth · sell at horizon
- IRR
- 7.9%
- Equity multiple
- 1.31×
- Total profit
- $6,894
- Equity at exit
- $11,928
- IRR
- 17.2%
- Equity multiple
- 2.42×
- Total profit
- $31,742
- Equity at exit
- $6,917
Cash invested: $22,400 (down + closing). Projections, not guarantees.
Landlord ↔ Tenant lean methodology
- Overall (STATE)
- 83 Strongly Landlord-Friendly
- State Iowa
- 83 Strongly Landlord-Friendly · R+6
- County
- — inherits STATE
- City
- — inherits STATE
ZIP-level market 50638
- Home prices YoY
- -11.7%
- Active inventory
- 35
- Price-to-rent
- 5.6×
Monthly cashflow live
- Estimated rent
- $1,182 medium interval (Pro) →
- Mortgage (P&I)
- −$420
- Tax from tax record
- −$170 /mo · $2,044/yr
- Insurance
- −$33
- HOA
- −$0
- Vacancy / Maint / Mgmt
- −$248
- Net cashflow
- $311
Break-even live
UW: 25.0% down · 7.5% · 30yr · 1.5% tax · 5.0% vac · 8.0% maint · 8.0% mgmt
Financing live
Cash to close
- Down payment
- $20,000
- Closing costs
- $2,400
- Reserves months
- —
- Total cash needed
- —
Loan-product check · same deal, 3 products live
Conventional
25% down · 7.5% · 30yr
- Down + closing
- —
- Monthly P&I
- —
- Monthly cashflow
- —
- DSCR
- —
- Eligible?
- —
Personal DTI + credit; lowest rate.
DSCR
20% down · 8.5% · 30yr
- Down + closing
- —
- Monthly P&I
- —
- Monthly cashflow
- —
- DSCR
- —
- Eligible?
- —
No personal income docs; deal must DSCR.
Hard money
10% down · 12.0% · 12mo
- Down + closing
- —
- Monthly P&I
- —
- Monthly cashflow
- —
- DSCR
- —
- Eligible?
- —
Short-term bridge; refi at stabilization.
Listing history 14 events
-
2026-06-18days on market $80,000 Active 18 DOM
-
2026-06-17days on market $80,000 Active 17 DOM
-
2026-06-16days on market $80,000 Active 16 DOM
-
2026-06-15days on market $80,000 Active 15 DOM
-
2026-06-13days on market $80,000 Active 13 DOM
-
2026-06-12days on market $80,000 Active 12 DOM
-
2026-06-09days on market $80,000 Active 9 DOM
-
2026-06-08days on market $80,000 Active 8 DOM
-
2026-06-07days on market $80,000 Active 7 DOM
-
2026-06-07days on market $80,000 Active 6 DOM
-
2026-06-04days on market $80,000 Active 3 DOM
-
2026-06-02days on market $80,000 Active 2 DOM
-
2026-06-01remarks 511-char remark
-
2026-06-01$80,000 Active 1 DOM
ⓘ Source: listings_history table (triggers on properties + properties_extension) + one-shot
backfill from property_details.listing_events for pre-trigger history.
Tax reassessment forecast IA · Partial reset (capped growth)
- Current annual tax
- $2,044 · $170/mo
- Projected year-2 tax
- $2,044 · $170/mo
- Expected delta
- $0/yr ($0/mo · 0.0%)
ⓘ Screening estimate from a state-policy table — verify with the county assessor before closing.
Climate risk First Street
- Flood 1/10 Low FEMA zone X (unshaded) · 0% chance over 30 yrs
- Wildfire 1/10 Low
- Heat 3/10 Moderate 7 d/yr ≥100°F today · 16 d/yr by 30 yrs out
- Wind 2/10 Low
- Air quality 1/10 Low 0 unhealthy d/yr today · 0 by 30 yrs out
Nearby sold comps map
Loading sold comps map…
Walkable amenities ~0.75 mi
Loading nearby amenities…
Taxation est. · year 1
- Rental income
- $14,188
- − Mortgage interest
- −$4,481
- − Property taxes
- −$2,044
- − Insurance
- −$400
- − Repairs & maintenance
- −$1,135
- − Management
- −$1,135
- − Depreciation
- −$2,327
- Taxable income
- $2,665
- Est. tax owed @ 24.0%
- −$640
- After-tax cash flow
- $3,090/yr
For passive investors: Depreciation is non-cash, so a rental often shows a tax loss while cash-flowing — sheltering income. Rental losses are passive: they offset passive income freely, and up to $25,000/yr can offset ordinary (W-2) income if you actively participate and your MAGI is under $100k (phasing out to $0 by $150k); unused losses carry forward. On sale, claimed depreciation is recaptured at up to 25%, and gains may owe capital-gains tax (a 1031 exchange can defer both). Figures are a year-1 estimate at your 24.0% rate — not tax advice; consult a CPA.
Schools (NCES district)
- District
- Grundy Center Community School District
- NCES district ID
- 1913290
- Math proficiency
- 80% ▼ -2.00%
- Reading proficiency
- 85% ▬ 0.00%
- Median HH income
- $54,056
- Composite
- 70.11/100
- National rank
- #275
- State rank
- #17 of 289 in IA
Livability — Grundy Center
- Score
- 81/100
- State rank
- #68
- US rank
- #1503
Category grades
Schools grade is shown separately in the Schools card above.
Census & demographics
- Census place
- Grundy Center, IA
- Population (ZIP)
- 3,474
Population outlook (Grundy County) Hauer SSP2
- Today (2025)
- 12,452 people
- By 2030
- 12,452 · +0.0%
- By 2040
- 12,437 · -0.1%
- By 2050
- 12,370 · -0.7%
- By 2075
- 12,495 · +0.3%
- By 2100
- 11,823 · -5.1%
Race, ethnicity, and origin ACS 2023
- Neighborhood character
- Predominantly White (96%)
- Race & ethnicity
- White 96% Hispanic / Latino 3% Two or more races 1%
- Common ancestry
- Iranian 5% Portuguese 4% Slovak 2%
- Foreign-born
- 1% · Canada
- Languages at home
- 98% English-only · Spanish 1% German/W. Germanic 1%
Political lean MEDSL · Grundy
- 2024 margin
- Solid R (+41.8) · D 28.3% · R 70.1% · Other 1.6%
- 2008→2024 swing
- -24.9pp toward R · 2008: -16.9pp · 2024: -41.8pp
- All cycles
- 2024: R+41.8 2020: R+37.4 2016: R+39.5 2012: R+23.1 2008: R+16.9
Not yet ingested
- Civics
- —
Market trends
- HPI YoY
- ▼ -30.09%
- Current HPI
- 227.7523
- Rent YoY
- —
- Metro
- —
- State GDP YoY
- ▲ 2.48%
- F500 in state
- 4
Industry mix (Fortune 500 HQ in IA)
| Industry | F500 HQs | Revenue |
|---|---|---|
| Financial Services | 1 | $16B |
|
||
| Retail / Convenience | 1 | $15B |
|
||
Price history
-38.4% since first listed9 events — show timeline
- 2026-05-30 Listed $80,000 CRAAR, CDRMLS
- 2026-05-30 Listed $80,000 NEIRBR as distributed by MLS GRID
- 2025-06-26 Sold (Public Records) $2,000,000 Public Records
- 2025-03-25 Sold (Public Records) $1,475,000 Public Records
- 2022-10-05 Sold (Public Records) $130,000 Public Records
- 2022-09-30 Delisted — NEIRBR as distributed by MLS GRID
- 2022-09-30 Sold (MLS) $129,900 NEIRBR as distributed by MLS GRID
- 2022-08-05 Delisted — NEIRBR as distributed by MLS GRID
- 2021-07-20 Listed $129,900 NEIRBR as distributed by MLS GRID
Property tax history
+6.7%/yrLatest (2025): $2,044 · -0.9% YoY. Source: county tax records.
Cash-flow waterfall
monthlySold comps — $/sqft
last 12 mo · ≤1 miLoading sold comps…