 5-Plex
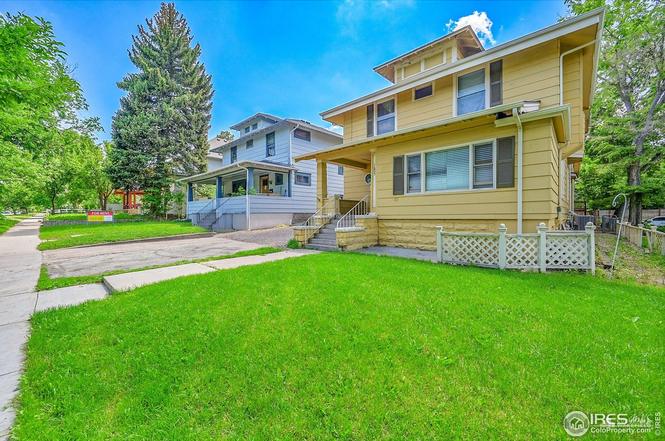
1605 11th Ave · Greeley, CO
Flood risk 1/10 · Minimal
- FEMA flood zone
- X (unshaded)
- Chance of flooding over 30 yrs
- 0.0%
- Est. flood insurance / yr
- $507 – $1,088
Fire risk 2/10 · Minimal
- Est. fire insurance / yr
- $939 – $1,743
Heat risk 3/10 · Minor
- Hot days now (above 94°F)
- 7 days/yr
- Hot days in 30 yrs
- 18 days/yr
Wind risk 2/10 · Minimal
- Chance of severe wind over 30 yrs
- —
Air-quality risk 4/10 · Minor
- Unhealthy air days now
- 5 days/yr
- Unhealthy air days in 30 yrs
- 5 days/yr
Risk factors via First Street. Map © Google.
Why this score? — see what drove the C+ grade
The composite is a weighted blend of 9 inputs, each scored 0–100. Each bar is that input's sub-score; the figure is the points it added to the 100-point composite (weight × sub-score).
- Cash flow +29.6/30.0
- DSCR +10.0/10.0
- ARV discount +7.5/15.0
- 1% rule +7.3/10.0
- Livability +3.4/5.0
- Condition / age +2.5/5.0
- Rent growth +2.3/5.0
- Schools +2.0/10.0
- Appreciation +0.0/10.0
$875,000
🖨 Deal sheet (PDF) 📄 Offer letter ✓ Due diligence
Multi-family units
County records classify this as Multi-Family (2-4 Unit). Listing-text estimate: 5 units. estimate disagrees with records
Listing remarks
Try to find a lower price per bed around the university. This rental is in a highly desirable location next to UNC and close to amenities and downtown Greeley. Recently renovated kitchens, common areas, windows, bedrooms and bathrooms. Opportunity for an investor to improve rents and utility reimbursement for additional income. This is a solid cash-flowing investment with a solid history of occupancy and tenants. The "Per Bedroom" price is below market highs at $58,333 for rentals sold in the last several years. Tenant occupied, please do not disturb tenants. Showings through agent. Minimum 24 hour notice to tour.
Key facts
- History of occupancy
- 7,840 sq ft lot
- Built 1914
Tags
Property features AI
Finance
- Financial info: Gross income reported: $106,837; Net operating income reported: $68,732; Tenants pay deposit, gas, electricity, water, sewer and trash collection
- HOA & community: Community laundry
Exterior
- Parking: 2 parking spaces per unit
- Utilities: City water with meter installed; No water rights; Public sewer; Master-metered electric; Master-metered gas; Gas service by Atmos
- Home design: Two-story residential income property; Not new — previously owned; Zoned RHD
- Construction: Wood siding; Composition roof
- Exterior features: Partial fencing; City street frontage; Minimal flood risk (C rating)
Interior
- Kitchen: Electric range; Refrigerator; Microwave
- Bedrooms: One unit with 1 bedroom; One unit with 4 bedrooms; One unit with 4 bedrooms; One unit with 6 bedrooms
- Bathrooms: One unit with 1 bathroom; One unit with 1 bathroom; One unit with 2 bathrooms; One unit with 2 bathrooms
- Heating & cooling: Forced air heating; Baseboard heating; Central air conditioning; Wall/window unit air conditioning
- Interior features: Fire alarm; Partial basement
- Laundry & utility: Community laundry
Neighborhood map
What this means for you Summary
Snapshot
- This is a 5 × 4-bed/?-bath units multifamily listed at $875k.
Deal economics
- At list price, monthly cash flow is $3k ($38k/yr) — positive. Per door: $634/mo.
- The deal already cash-flows at list — no discount required.
- Meets the 1% rule at list price ($11k rent vs $875k).
- Recommended offer: $770k (12.0% below list) — sets the bar for market timing.
- Cap rate 10.6% vs local median 3.3% in Greeley — top-decile yield for the area; either an underpriced asset or a hidden risk that comps aren't pricing in. Stress-test before assuming the spread holds.
Location & tenants
- Location reads 68/100 on livability (#115 in CO) — a middle-class / working-renter tenant base. Strengths: commute A+, housing A+, health & safety A; Watch: cost of living C-, crime F, amenities F.
- Greeleyschool District No. 6 In The County Of Weld And Sta (urban): math 15% / reading 31% proficiency, ranked #71 of 86 in CO (top 83%) — low school quality limits family demand, transient renter base, plan for 1-2y turnover.
- Zoned schools: Maplewood Elementary School (math 8% / reading 17%, grade F, #869 of 966 statewide, top 91%, 559 students, 91% FRL); Greeley Central High School (math 14% / reading 36%, grade F, #263 of 381 statewide, top 69%, 1,484 students, 64% FRL) — zoned schools average 78% FRL vs 54% district-wide (23 pts higher); higher-poverty schools than district average — tighter screening recommended.
- Market conditions: Rents soft (-0.7%/yr); 180 active listings in the ZIP; 3,170 units permitted in Weld County in 2024 (278 in 5+ unit buildings).
- At $10,765/mo this rent would consume 237% of the median local household income ($55k/yr) (locally 3061% of renters already pay >50% of income on rent) — very limited rent-growth headroom before tenants either downsize or default.
Forward outlook
- Local home prices are declining (-3.0%/yr); year-one equity from $6k of loan paydown is wiped out by about $26k of value loss. Plan a longer hold.
- Weld County population projected at +46% by 2050 — long-run rental-demand tailwind backs the buy-and-hold thesis.
Negotiation context
- It's been on market 287 days — a 12% lower offer ($770k) is reasonable based on typical stale-listing flexibility.
- 17 sale attempts since 22y ago; this cycle's ask has dropped $75k (8%) from the opening price — seller is motivated, your offer sets the floor, not the list.
- Current owner paid $295k; list at $875k implies a 197% gain — meaningful room to come down on a strong offer.
Risks & watch-outs
- Watch-outs: built in 1914 — expect roof / HVAC / electrical / plumbing capex.
Questions for the listing agent
- It's been on market 287 days. Have you received any prior offers? Is the seller open to a 12% concession, seller financing, or rate buy-down credit?
- Can we see the unit-by-unit rent roll, current vacancy, and any below-market leases? What's the average tenancy length?
- What capital expenditures (roof, boiler, parking lot, exteriors) have been made in the last 5 years, and what's planned in the next 2?
- Built in 1914 — when were the roof, HVAC, electrical panel, plumbing, and water heater last replaced?
- Why hasn't it sold? Are there any deal-killer items the seller is aware of (foundation, flood, title, zoning, code violations)?
- Is there a deadline driving the sale (1031 exchange, divorce, estate, relocation)? That informs how much negotiation room exists.
- Schools are D-rated, which usually means shorter tenancies and higher turnover. Who's the typical renter profile here, and what's been the actual vacancy rate?
- Crime grade is F in this area — have there been break-ins, vandalism, or insurance claims at this property in the last 3 years? What carrier currently insures it and at what premium?
- What's the average days-on-market for RENTAL listings here right now (not sales)? A rising rental-DOM trend means longer vacancies and softer asking-rent achievability than the comps imply.
- What's the recent tenant-quality profile in this submarket — average credit score on applications, eviction rate, late-payment / NSF rate, and stable-employment percentage? A property-management company in the area should have these aggregated.
- How much new apartment / multifamily construction is in the pipeline within 1–3 miles? Heavy new supply (>2% of stock underway) typically softens rents 12–24 months out; light construction supports rent growth.
Investment metrics
- 1% rule
- 1.23% ✓
- Cap rate
- 10.64%
- Cash-on-cash
- 15.53%
- DSCR
- 1.69
- GRM
- 6.8
CMA / ARV
No comps found within radius.
Projected returns pro-forma
-3.0% appreciation · 0.0% rent growth · sell at horizon
- IRR
- 3.1%
- Equity multiple
- 1.12×
- Total profit
- $28,289
- Equity at exit
- $130,465
- IRR
- 9.8%
- Equity multiple
- 1.66×
- Total profit
- $161,573
- Equity at exit
- $75,654
Cash invested: $245,000 (down + closing). Projections, not guarantees.
Landlord ↔ Tenant lean methodology
- Overall (STATE)
- 38 Tenant-Leaning
- State Colorado
- 38 Tenant-Leaning · D+4
- County
- — inherits STATE
- City
- — inherits STATE
ZIP-level market 80631
- Rents YoY
- -0.7%
- Active inventory
- 180
- Price-to-rent
- 33.9×
Monthly cashflow live
- Estimated rent
- $10,765 high interval (Pro) →
- Mortgage (P&I)
- −$4,589
- Tax from tax record
- −$381 /mo · $4,574/yr
- Insurance
- −$365
- HOA
- −$0
- Vacancy / Maint / Mgmt
- −$2,261
- Net cashflow
- $3,170
Break-even live
Sensitivity live
| Price | -10% $3,665 | -5% $3,418 | +0% $3,170 | +5% $2,922 | +10% $2,675 |
|---|---|---|---|---|---|
| Rent | -10% $2,320 | -5% $2,745 | +0% $3,170 | +5% $3,595 | +10% $4,020 |
| Rate | -1.0pp $3,611 | -0.5pp $3,393 | base $3,170 | +0.5pp $2,943 | +1.0pp $2,713 |
5-unit breakdown (identical units grouped — click to expand)
| Units | Beds | Baths | Est. rent |
|---|---|---|---|
| 5× units | 4 | — | $10,765 |
| #1 | 4 | — | $2,153 |
| #2 | 4 | — | $2,153 |
| #3 | 4 | — | $2,153 |
| #4 | 4 | — | $2,153 |
| #5 | 4 | — | $2,153 |
| Total (5 units) | $10,765 | ||
UW: 25.0% down · 7.5% · 30yr · 1.5% tax · 5.0% vac · 8.0% maint · 8.0% mgmt
Financing live
Cash to close
- Down payment
- $218,750
- Closing costs
- $26,250
- Reserves months
- —
- Total cash needed
- —
Loan-product check · same deal, 3 products live
Conventional
25% down · 7.5% · 30yr
- Down + closing
- —
- Monthly P&I
- —
- Monthly cashflow
- —
- DSCR
- —
- Eligible?
- —
Personal DTI + credit; lowest rate.
DSCR
20% down · 8.5% · 30yr
- Down + closing
- —
- Monthly P&I
- —
- Monthly cashflow
- —
- DSCR
- —
- Eligible?
- —
No personal income docs; deal must DSCR.
Hard money
10% down · 12.0% · 12mo
- Down + closing
- —
- Monthly P&I
- —
- Monthly cashflow
- —
- DSCR
- —
- Eligible?
- —
Short-term bridge; refi at stabilization.
Listing history 50 events
-
2026-06-18days on market $875,000 Active 287 DOM
-
2026-06-17days on market $875,000 Active 286 DOM
-
2026-06-16days on market $875,000 Active 285 DOM
-
2026-06-15days on market $875,000 Active 284 DOM
-
2026-06-14days on market $875,000 Active 282 DOM
-
2026-06-10days on market $875,000 Active 279 DOM
-
2026-06-09days on market $875,000 Active 278 DOM
-
2026-06-08days on market $875,000 Active 277 DOM
-
2026-06-07days on market $875,000 Active 276 DOM
-
2026-06-03days on market $875,000 Active 272 DOM
-
2026-06-02days on market $875,000 Active 271 DOM
-
2026-06-01days on market $875,000 Active 270 DOM
-
2026-05-31days on market $875,000 Active 269 DOM
-
2026-05-30days on market $875,000 Active 268 DOM
-
2025-11-10price $875,000
-
2025-09-04$950,000 Active
-
2025-08-28historical
-
2025-06-19$950,000 Active
-
2023-03-31historical
-
2023-02-07status Active
-
2023-02-07status Active
-
2023-02-07status Active
-
2023-02-04status Pending
-
2023-02-04status Pending
-
2023-02-04status Pending
-
2023-02-03historical
-
2023-02-03historical
-
2023-01-19price $950,000
-
2023-01-19price $950,000
-
2023-01-19price $950,000
-
2022-12-29price $995,000
-
2022-12-29price $995,000
-
2022-12-29price $995,000
-
2022-10-27status Active
-
2022-10-27status Active
-
2022-10-27status Active
-
2022-10-17status Pending
-
2022-10-17historical Active - Backup
-
2022-10-17status Pending Accepting Backup Offers
-
2022-09-01price $1,050,000
-
2022-09-01price $1,050,000
-
2022-08-31price $1,050,000
-
2022-08-17$1,200,000 Active
-
2022-08-17$1,200,000 Active
-
2022-07-20$1,200,000 Active
-
2021-08-16historical
-
2021-05-19price $1,150,000
-
2021-03-29$1,300,000 Active
-
2014-07-21soldstatus $295,000
-
2014-07-07soldstatus $295,000
ⓘ Source: listings_history table (triggers on properties + properties_extension) + one-shot
backfill from property_details.listing_events for pre-trigger history.
Tax reassessment forecast CO · Resets to sale price
- Current annual tax
- $4,574 · $381/mo
- Projected year-2 tax
- $4,812 · $401/mo
- Expected delta
- +$239/yr (+$20/mo · 5.2%)
ⓘ Screening estimate from a state-policy table — verify with the county assessor before closing.
Climate risk First Street
- Flood 1/10 Low FEMA zone X (unshaded) · 0% chance over 30 yrs
- Wildfire 2/10 Low
- Heat 3/10 Moderate 7 d/yr ≥94°F today · 18 d/yr by 30 yrs out
- Wind 2/10 Low
- Air quality 4/10 Moderate 5 unhealthy d/yr today · 5 by 30 yrs out
Nearby sold comps map
Loading sold comps map…
Walkable amenities ~0.75 mi
Loading nearby amenities…
Taxation est. · year 1
- Rental income
- $129,180
- − Mortgage interest
- −$49,014
- − Property taxes
- −$4,574
- − Insurance
- −$4,375
- − Repairs & maintenance
- −$10,334
- − Management
- −$10,334
- − Depreciation
- −$25,455
- Taxable income
- $25,094
- Est. tax owed @ 24.0%
- −$6,023
- After-tax cash flow
- $32,018/yr
For passive investors: Depreciation is non-cash, so a rental often shows a tax loss while cash-flowing — sheltering income. Rental losses are passive: they offset passive income freely, and up to $25,000/yr can offset ordinary (W-2) income if you actively participate and your MAGI is under $100k (phasing out to $0 by $150k); unused losses carry forward. On sale, claimed depreciation is recaptured at up to 25%, and gains may owe capital-gains tax (a 1031 exchange can defer both). Figures are a year-1 estimate at your 24.0% rate — not tax advice; consult a CPA.
Schools (NCES district)
- District
- Greeleyschool District No. 6 In The County Of Weld And Sta
- NCES district ID
- 0804410
- Math proficiency
- 15% ▼ -7.00%
- Reading proficiency
- 31% ▼ -4.00%
- Median HH income
- $46,417
- Composite
- 19.99/100
- National rank
- #8667
- State rank
- #71 of 86 in CO
Livability — Greeley
- Score
- 68/100
- State rank
- #115
- US rank
- #9841
Category grades
Schools grade is shown separately in the Schools card above.
Census & demographics
- Census place
- Greeley, CO
- County
- Weld County · 332,652 people
- City population
- 119,344
- Metro
- Greeley, CO
- Population (ZIP)
- 53,722
- Household income
- $54,591
- Rent vs Own
- Severe rent burden
- 3061.0
Population outlook (Weld County) Hauer SSP2
- Today (2025)
- 351,957 people
- By 2030
- 385,304 · +9.5%
- By 2040
- 451,818 · +28.4%
- By 2050
- 514,478 · +46.2%
- By 2075
- 648,733 · +84.3%
- By 2100
- 720,400 · +104.7%
Race, ethnicity, and origin ACS 2023
- Neighborhood character
- Diverse neighborhood (Simpson 0.55)
- Race & ethnicity
- Hispanic / Latino 54% White 39% Two or more races 15% Black 3% Native American 2% Asian 1%
- Hispanic origin (detail)
- Mexican 45%
- Common ancestry
- Italian 2% Slovak 2% Portuguese 2%
- Foreign-born
- 19% · Canada, Philippines
- Languages at home
- 65% English-only · Spanish 33%
Political lean MEDSL · Weld
- 2024 margin
- Strong R (+21.0) · D 38.2% · R 59.2% · Other 2.6%
- 2008→2024 swing
- -12.2pp toward R · 2008: -8.7pp · 2024: -21.0pp
- All cycles
- 2024: R+21.0 2020: R+18.0 2016: R+22.4 2012: R+13.2 2008: R+8.7
Not yet ingested
- Civics
- —
Market trends
- HPI YoY
- ▼ -329.59%
- Current HPI
- 295.4309
- Rent YoY
- ▼ -0.65%
- Metro
- Greeley, CO
- State GDP YoY
- ▲ 1.95%
- F500 in state
- 14
Industry mix (Fortune 500 HQ in CO)
| Industry | F500 HQs | Revenue |
|---|---|---|
| Technology Distribution | 1 | $31B |
|
||
| Food / Agriculture | 1 | $18B |
|
||
| Packaging | 1 | $14B |
|
||
| Healthcare | 1 | $13B |
|
||
| Energy | 1 | $10B |
|
||
| Technology | 1 | $4B |
|
||
Price history
+360.5% since first listed47 events — show timeline
- 2025-11-10 Price Changed $875,000 IRES
- 2025-09-04 Listed $950,000 IRES
- 2025-08-28 Listing Removed — IRES
- 2025-06-19 Listed $950,000 IRES
- 2023-03-31 Listing Removed — REColorado as Distributed by MLS Grid
- 2023-02-07 Relisted — IRES
- 2023-02-07 Relisted — REColorado as Distributed by MLS Grid
- 2023-02-07 Relisted — IRES
- 2023-02-04 Pending — IRES
- 2023-02-04 Pending — IRES
- 2023-02-04 Pending — REColorado as Distributed by MLS Grid
- 2023-02-03 Listing Removed — IRES
- 2023-02-03 Listing Removed — IRES
- 2023-01-19 Price Changed $950,000 REColorado as Distributed by MLS Grid
- 2023-01-19 Price Changed $950,000 IRES
- 2023-01-19 Price Changed $950,000 IRES
- 2022-12-29 Price Changed $995,000 REColorado as Distributed by MLS Grid
- 2022-12-29 Price Changed $995,000 IRES
- 2022-12-29 Price Changed $995,000 IRES
- 2022-10-27 Relisted — IRES
- 2022-10-27 Relisted — IRES
- 2022-10-27 Relisted — REColorado as Distributed by MLS Grid
- 2022-10-17 Pending — IRES
- 2022-10-17 Contingent — IRES
- 2022-10-17 Pending — REColorado as Distributed by MLS Grid
- 2022-09-01 Price Changed $1,050,000 REColorado as Distributed by MLS Grid
- 2022-09-01 Price Changed $1,050,000 IRES
- 2022-08-31 Price Changed $1,050,000 IRES
- 2022-08-17 Listed $1,200,000 IRES
- 2022-08-17 Listed $1,200,000 REColorado as Distributed by MLS Grid
- 2022-07-20 Listed $1,200,000 IRES
- 2021-08-16 Listing Removed — IRES
- 2021-05-19 Price Changed $1,150,000 IRES
- 2021-03-29 Listed $1,300,000 IRES
- 2014-07-21 Sold (Public Records) $295,000 Public Records
- 2014-07-07 Sold (Public Records) $295,000 Public Records
- 2014-06-20 Sold (MLS) $295,000 IRES
- 2013-10-02 Listed $295,000 IRES
- 2013-09-11 Listing Removed — IRES
- 2013-04-22 Listed $339,900 IRES
- 2007-11-14 Listing Removed — IRES
- 2007-06-05 Listed $345,000 IRES
- 2006-08-31 Listing Removed — IRES
- 2006-03-24 Listed $364,500 IRES
- 2004-11-15 Sold (MLS) $282,900 IRES
- 2004-09-03 Listed $284,900 IRES
- 1998-11-04 Sold (Public Records) $190,000 Public Records
Property tax history
+6.2%/yrLatest (2025): $4,574 · -3.3% YoY. Source: county tax records.
Cash-flow waterfall
monthlySold comps — $/sqft
last 12 mo · ≤1 miLoading sold comps…