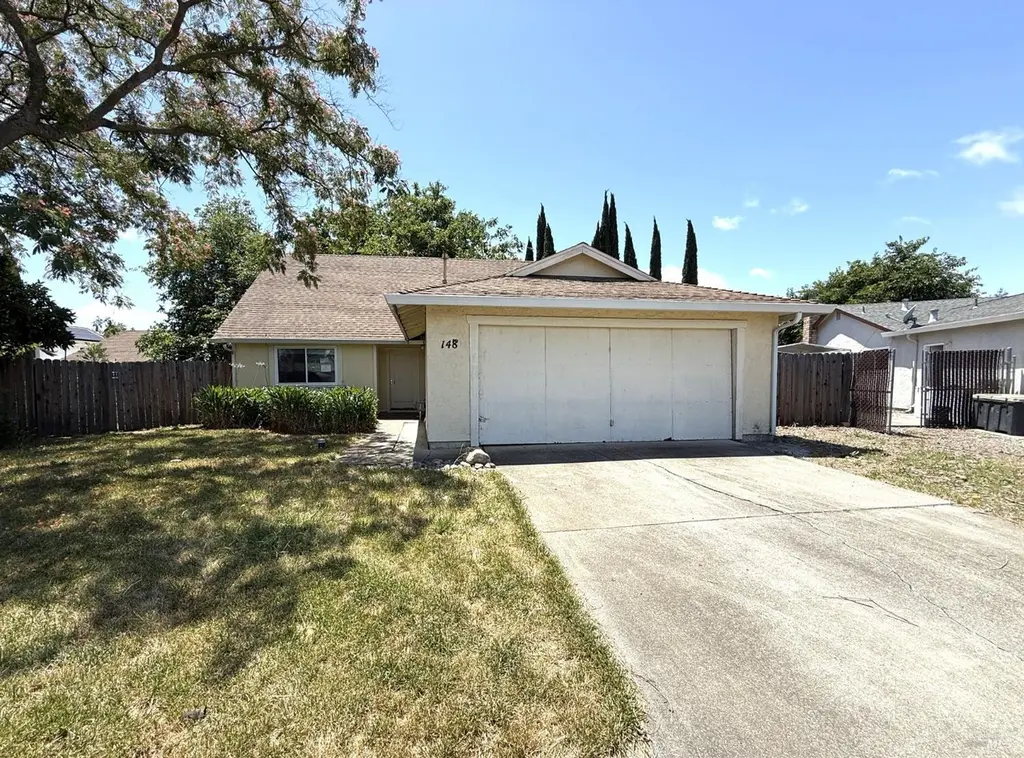
148 Danvers Ct · Vacaville, CA
Flood risk 1/10 · Minimal
- FEMA flood zone
- X (shaded)
- Chance of flooding over 30 yrs
- 0.0%
- Est. flood insurance / yr
- $507 – $1,088
Fire risk 5/10 · Moderate
- Est. fire insurance / yr
- $659 – $1,223
Heat risk 6/10 · Moderate
- Hot days now (above 100°F)
- 7 days/yr
- Hot days in 30 yrs
- 14 days/yr
Wind risk 1/10 · Minimal
- Chance of severe wind over 30 yrs
- —
Air-quality risk 10/10 · Severe
- Unhealthy air days now
- 21 days/yr
- Unhealthy air days in 30 yrs
- 22 days/yr
Risk factors via First Street. Map © Google.
Why this score? — see what drove the D+ grade
The composite is a weighted blend of 9 inputs, each scored 0–100. Each bar is that input's sub-score; the figure is the points it added to the 100-point composite (weight × sub-score).
- ARV discount +15.0/15.0
- Cash flow +13.1/30.0
- Schools +4.8/10.0
- DSCR +3.9/10.0
- Livability +3.9/5.0
- Condition / age +2.5/5.0
- 1% rule +2.4/10.0
- Rent growth +2.4/5.0
- Appreciation +0.0/10.0
$410,000
🖨 Deal sheet 📄 Offer letter ✓ Due diligence
Listing remarks
Located in the Village East subdivision and within the sought-after Travis Unified School District, this 3-bedroom, 2-bath home offers a flexible and functional floor plan. The main level features two bedrooms and a full bath, while upstairs includes a spacious bedroom, loft area, and an additional full bath. The kitchen is equipped with Corian countertops, stainless steel appliances, and laminate flooring. Situated on a generously sized lot in a court location, this property provides both privacy and convenience with plenty of outdoor space to enjoy.
Key facts
- Corian countertops
- Flexible floor plan
- Generously sized lot
Tags
Property features AI
Finance
- HOA & community: No homeowners association; Not a senior community
Exterior
- Parking: Attached 2-car garage; 4 total parking spaces
- Utilities: Natural gas available and connected; Public sewer
- Home design: Single-family residence; Two-story home; Main level includes bedroom(s), family room, full bath(s), garage, kitchen, street entrance; Upper level includes bedroom(s), full bath(s), loft
- Construction: Residential construction
- Exterior features: Chain-link and wood fencing; Court-front lot with irregular shape; Composition roof; No private pool or spa; No ADU
Interior
- Kitchen: Synthetic countertops; Free-standing refrigerator; Hood over range
- Bedrooms: 3 bedrooms (one main-level bedroom, additional bedrooms on upper level)
- Flooring: Simulated wood flooring
- Bathrooms: 2 full bathrooms; Master bathroom with tub/shower over; Other bathrooms with tub/shower over
- Heating & cooling: Central heating; Central air conditioning
- Interior features: Cathedral/vaulted living room ceiling; Original condition
- Laundry & utility: Laundry hookups only
Neighborhood map
What this means for you Summary
Snapshot
- This is a 3-bed/2.0-bath single-family listed at $410k.
Deal economics
- At list price, monthly cash flow is $-13 ($-153/yr) — negative.
- To cash-flow at today's rent, offer at most $408k (0.5% below list).
- To meet the 1% rule (rent ≥ 1% of price), the offer needs to be $305k (25.7% below list).
- Recommended offer: $305k (25.7% below list) — sets the bar for 1% rule.
- Cap rate 6.3% vs local median 3.0% in Vacaville — top-decile yield for the area; either an underpriced asset or a hidden risk that comps aren't pricing in. Stress-test before assuming the spread holds.
Location & tenants
- Location reads 77/100 on livability (#88 in CA, #3,156 nationally) — a middle-class / working-renter tenant base. Strengths: amenities A+, employment A+, housing A+; Watch: schools C-, cost of living F.
- Travis Unified (urban): math 42% / reading 56% proficiency, ranked #375 of 1,400 in CA (top 27%) — families likely to look elsewhere, expect single-tenant / working-renter base with shorter leases; only 18% free/reduced lunch — higher-income household profile.
- Market conditions: Rents soft (-0.6%/yr); 263 active listings in the ZIP; 7 comparable units currently listed for rent nearby; rentals at typical pace (median 23d on market — plan ~3-4 weeks tenant-placement turnaround); 43% of comp listings sitting > 30 days — soft ceiling on asking rent; solid renter incomes; 1,472 units permitted in Solano County in 2024 (131 in 5+ unit buildings).
- This rent runs 33% of the median local income ($110k/yr) — at the standard rent-burdened threshold; future hikes will face affordability resistance.
Forward outlook
- Local home prices are declining (-3.0%/yr); year-one equity from $3k of loan paydown is wiped out by about $12k of value loss. Plan a longer hold.
- Solano County population projected at +15% by 2050 — modest demand growth; plan on rents tracking national, not racing it.
Negotiation context
- It's been on market 20 days — a 2% lower offer ($404k) is reasonable based on typical stale-listing flexibility.
Risks & watch-outs
- Climate carrying-cost: moderate wildfire risk; extreme-heat days projected 7→14/yr by 2055 (HVAC capex compounding) — expect insurance premiums to compound above CPI over the hold.
Questions for the listing agent
- What do current leases actually rent for vs. the listed asking? Can we see a recent rent roll and the last 12 months of T-12 income?
- Built in 1976 — when were the roof, HVAC, electrical panel, plumbing, and water heater last replaced?
- Is there a deadline driving the sale (1031 exchange, divorce, estate, relocation)? That informs how much negotiation room exists.
- The area grade is low — what's the realistic commute time and amenity access for the typical tenant pool here? Any planned neighborhood developments (good or bad) we should know about?
- What's the average days-on-market for RENTAL listings here right now (not sales)? A rising rental-DOM trend means longer vacancies and softer asking-rent achievability than the comps imply.
- What's the recent tenant-quality profile in this submarket — average credit score on applications, eviction rate, late-payment / NSF rate, and stable-employment percentage? A property-management company in the area should have these aggregated.
- How much new for-sale + rental construction is in the pipeline within 1–3 miles? Heavy new supply typically softens prices + rents 12–24 months out; constrained supply supports both.
Investment metrics
- 1% rule
- 0.74% ✗
- Cap rate
- 6.26%
- Cash-on-cash
- -0.13%
- DSCR
- 0.99
- GRM
- 11.2
CMA / ARV
- ARV (on-the-fly)
- $602,862
- Comps found
- 12
Show comp detail 12 sales within ~0.75 mi
| Address | Dist | Beds/Ba | Sqft | Sold | Price | $/sf | Match |
|---|---|---|---|---|---|---|---|
| 116 Heritage Ln | 0.26mi | 3/2.5 | 1,584 (+3%) | 3mo | $535,000 | $338 | 78 |
| 131 Natick Ct | 0.29mi | 3/2.0 | 1,334 (-13%) | 1mo | $600,000 | $450 | 64 |
| 339 Aaron Cir | 0.40mi | 3/2.5 | 1,671 (+9%) | 3mo | $569,000 | $341 | 62 |
| 448 Potters Ln | 0.59mi | 3/2.0 | 1,625 (+6%) | 1mo | $550,000 | $338 | 61 |
| 289 Belford Pl | 0.65mi | 3/2.0 | 1,604 (+5%) | 1mo | $539,000 | $336 | 61 |
| 196 Somerville Dr | 0.36mi | 3/2.0 | 1,329 (-13%) | 3mo | $579,000 | $436 | 59 |
| 100 Wakefield Dr | 0.40mi | 3/2.0 | 1,334 (-13%) | 1mo | $575,000 | $431 | 58 |
| 165 Audrey Pl | 0.50mi | 3/2.5 | 1,671 (+9%) | 3mo | $465,000 | $278 | 57 |
| 525 Amanda Ct | 0.43mi | 3/2.0 | 1,306 (-15%) | 1mo | $555,000 | $425 | 54 |
| 244 Somerville Dr | 0.45mi | 3/2.0 | 1,305 (-15%) | 1mo | $565,000 | $433 | 53 |
| 279 Livingston Ave | 0.63mi | 3/2.0 | 1,318 (-14%) | 2mo | $479,000 | $363 | 46 |
| 182 Fairview Dr | 0.67mi | 3/2.0 | 1,318 (-14%) | 2mo | $518,000 | $393 | 44 |
Match score weights: distance 35% · size 25% · config 20% · recency 20%. Top-matched comps best support the ARV.
Projected returns pro-forma
-3.0% appreciation · 0.0% rent growth · sell at horizon
- IRR
- -19.5%
- Equity multiple
- 0.33×
- Total profit
- $-76,385
- Equity at exit
- $61,132
- IRR
- -18.9%
- Equity multiple
- 0.10×
- Total profit
- $-102,910
- Equity at exit
- $35,449
Cash invested: $114,800 (down + closing). Projections, not guarantees.
Landlord ↔ Tenant lean methodology
- Overall (STATE)
- 18 Strongly Tenant-Friendly
- State California
- 18 Strongly Tenant-Friendly · D+13
- County
- — inherits STATE
- City
- — inherits STATE
ZIP-level market 95687
- Rents YoY
- -0.6%
- Active inventory
- 263
- Price-to-rent
- 11.2×
Monthly cashflow live
- Estimated rent
- $3,046 high interval (Pro) →
- Mortgage (P&I)
- −$2,150
- Tax from tax record
- −$99 /mo · $1,183/yr
- Insurance
- −$171
- HOA
- −$0
- Vacancy / Maint / Mgmt
- −$640
- Net cashflow
- $-13
Break-even live
UW: 25.0% down · 7.5% · 30yr · 1.5% tax · 5.0% vac · 8.0% maint · 8.0% mgmt
Financing live
Cash to close
- Down payment
- $102,500
- Closing costs
- $12,300
- Reserves months
- —
- Total cash needed
- —
Loan-product check · same deal, 3 products live
Conventional
25% down · 7.5% · 30yr
- Down + closing
- —
- Monthly P&I
- —
- Monthly cashflow
- —
- DSCR
- —
- Eligible?
- —
Personal DTI + credit; lowest rate.
DSCR
20% down · 8.5% · 30yr
- Down + closing
- —
- Monthly P&I
- —
- Monthly cashflow
- —
- DSCR
- —
- Eligible?
- —
No personal income docs; deal must DSCR.
Hard money
10% down · 12.0% · 12mo
- Down + closing
- —
- Monthly P&I
- —
- Monthly cashflow
- —
- DSCR
- —
- Eligible?
- —
Short-term bridge; refi at stabilization.
Rent comps 7 comps
| Address | Beds | Baths | Sqft | Rent | $/sqft | DOM | Units | Dist |
|---|---|---|---|---|---|---|---|---|
| 432 Zachary Dr Vacaville, CA | 3.0 | 2.0 | 1100 | $2,850 | $2.59 | 43d | 1 | 0.12mi |
| 398 Aaron Cir Vacaville, CA | 3.0 | 3.0 | 1700 | $3,295 | $1.94 | 23d | 1 | 0.33mi |
| 642 Silvertop Way Vacaville, CA | 3.0 | 2.0 | 1692 | $2,995 | $1.77 | 23d | 1 | 0.53mi |
| 1797 Brookwood Dr Vacaville, CA | 3.0 | 2.0 | 1258 | $2,800 | $2.23 | 13d | 1 | 1.27mi |
| 1584 Amapola St Vacaville, CA | 4.0 | 2.0 | 1600 | $2,950 | $1.84 | 13d | 1 | 1.43mi |
| 245 Christine Dr Vacaville, CA | 3.0 | 2.0 | 1533 | $3,400 | $2.22 | 43d | 1 | 1.44mi |
| 597 Canvasback Ct Vacaville, CA | 4.0 | 2.5 | 1992 | $3,399 | $1.71 | 43d | 1 | 1.48mi |
Listing history 17 events
-
2026-06-18days on market $410,000 Active 20 DOM
-
2026-06-17days on market $410,000 Active 19 DOM
-
2026-06-16days on market $410,000 Active 18 DOM
-
2026-06-15days on market $410,000 Active 17 DOM
-
2026-06-14days on market $410,000 Active 15 DOM
-
2026-06-13days on market $410,000 Active 14 DOM
-
2026-06-10days on market $410,000 Active 12 DOM
-
2026-06-09days on market $410,000 Active 11 DOM
-
2026-06-08days on market $410,000 Active 10 DOM
-
2026-06-07days on market $410,000 Active 9 DOM
-
2026-06-05days on market $410,000 Active 6 DOM
-
2026-06-03days on market $410,000 Active 5 DOM
-
2026-06-02days on market $410,000 Active 4 DOM
-
2026-06-01days on market $410,000 Active 3 DOM
-
2026-05-31days on market $410,000 Active 2 DOM
-
2026-05-30remarks 557-char remark
-
2026-05-30$410,000 Active 1 DOM
ⓘ Source: listings_history table (triggers on properties + properties_extension) + one-shot
backfill from property_details.listing_events for pre-trigger history.
Tax reassessment forecast CA · Resets to sale price
- Current annual tax
- $1,183 · $99/mo
- Projected year-2 tax
- $3,116 · $260/mo
- Expected delta
- +$1,933/yr (+$161/mo · 163.5%)
ⓘ Screening estimate from a state-policy table — verify with the county assessor before closing.
Climate risk First Street
- Flood 1/10 Low FEMA zone X (shaded) · 0% chance over 30 yrs
- Wildfire 5/10 Major
- Heat 6/10 Major 7 d/yr ≥100°F today · 14 d/yr by 30 yrs out
- Wind 1/10 Low
- Air quality 10/10 Extreme 21 unhealthy d/yr today · 22 by 30 yrs out
Nearby sold comps map
Loading sold comps map…
Walkable amenities ~0.75 mi
Loading nearby amenities…
Taxation est. · year 1
- Rental income
- $36,558
- − Mortgage interest
- −$22,966
- − Property taxes
- −$1,183
- − Insurance
- −$2,050
- − Repairs & maintenance
- −$2,925
- − Management
- −$2,925
- − Depreciation
- −$11,927
- Taxable loss
- −$7,418
- Est. tax savings @ 24.0%
- +$1,780
- After-tax cash flow
- $1,627/yr
For passive investors: Depreciation is non-cash, so a rental often shows a tax loss while cash-flowing — sheltering income. Rental losses are passive: they offset passive income freely, and up to $25,000/yr can offset ordinary (W-2) income if you actively participate and your MAGI is under $100k (phasing out to $0 by $150k); unused losses carry forward. On sale, claimed depreciation is recaptured at up to 25%, and gains may owe capital-gains tax (a 1031 exchange can defer both). Figures are a year-1 estimate at your 24.0% rate — not tax advice; consult a CPA.
Schools (NCES district)
- District
- Travis Unified
- NCES district ID
- 0639630
- Math proficiency
- 42% ▬ 0.00%
- Reading proficiency
- 56% ▼ -1.00%
- Median HH income
- $87,341
- Composite
- 47.55/100
- National rank
- #4961
- State rank
- #375 of 1400 in CA
Livability — Vacaville
- Score
- 77/100
- State rank
- #88
- US rank
- #3156
Category grades
Schools grade is shown separately in the Schools card above.
Census & demographics
- Census place
- Vacaville, CA
- County
- Solano County · 433,239 people
- City population
- 109,591
- Metro
- Vallejo, CA
- Population (ZIP)
- 69,390
- Household income
- $109,566
- Rent vs Own
- Severe rent burden
- 1761.0
Population outlook (Solano County) Hauer SSP2
- Today (2025)
- 478,685 people
- By 2030
- 497,974 · +4.0%
- By 2040
- 528,515 · +10.4%
- By 2050
- 549,115 · +14.7%
- By 2075
- 587,229 · +22.7%
- By 2100
- 571,378 · +19.4%
Race, ethnicity, and origin ACS 2023
- Neighborhood character
- Highly diverse neighborhood (Simpson 0.71)
- Race & ethnicity
- White 44% Hispanic / Latino 26% Two or more races 13% Black 10% Asian 10% Native American 1%
- Hispanic origin (detail)
- Mexican 18% Puerto Rican 2%
- Common ancestry
- Italian 13% Lithuanian 2% Portuguese 1%
- Foreign-born
- 12% · Canada, China
- Languages at home
- 80% English-only · Spanish 12% Tagalog/Filipino 3% Other Indo-European 2%
Political lean MEDSL · Solano
- 2024 margin
- Strong D (+23.0) · D 60.0% · R 37.1% · Other 2.9%
- 2008→2024 swing
- -5.6pp toward R · 2008: 28.6pp · 2024: 23.0pp
- All cycles
- 2024: D+23.0 2020: D+30.3 2016: D+30.5 2012: D+28.1 2008: D+28.6
Not yet ingested
- Civics
- —
Market trends
- HPI YoY
- ▼ -299.59%
- Current HPI
- 268.0777
- Rent YoY
- ▼ -0.55%
- Metro
- Vallejo, CA
- State GDP YoY
- ▲ 3.21%
- F500 in state
- 116
Industry mix (Fortune 500 HQ in CA)
| Industry | F500 HQs | Revenue |
|---|---|---|
| Technology | 27 | $1,492B |
|
||
| Financial Services | 3 | $174B |
|
||
| Retail | 3 | $44B |
|
||
| Insurance | 3 | $26B |
|
||
| Media / Entertainment | 2 | $115B |
|
||
| Pharmaceuticals / Biotech | 2 | $62B |
|
||
Price history
1 event — show timeline
- 2026-05-29 Listed $410,000 BAREIS
Property tax history
+2.2%/yrLatest (2025): $1,183 · +6.4% YoY. Source: county tax records.
Cash-flow waterfall
monthlySold comps — $/sqft
last 12 mo · ≤1 miLoading sold comps…