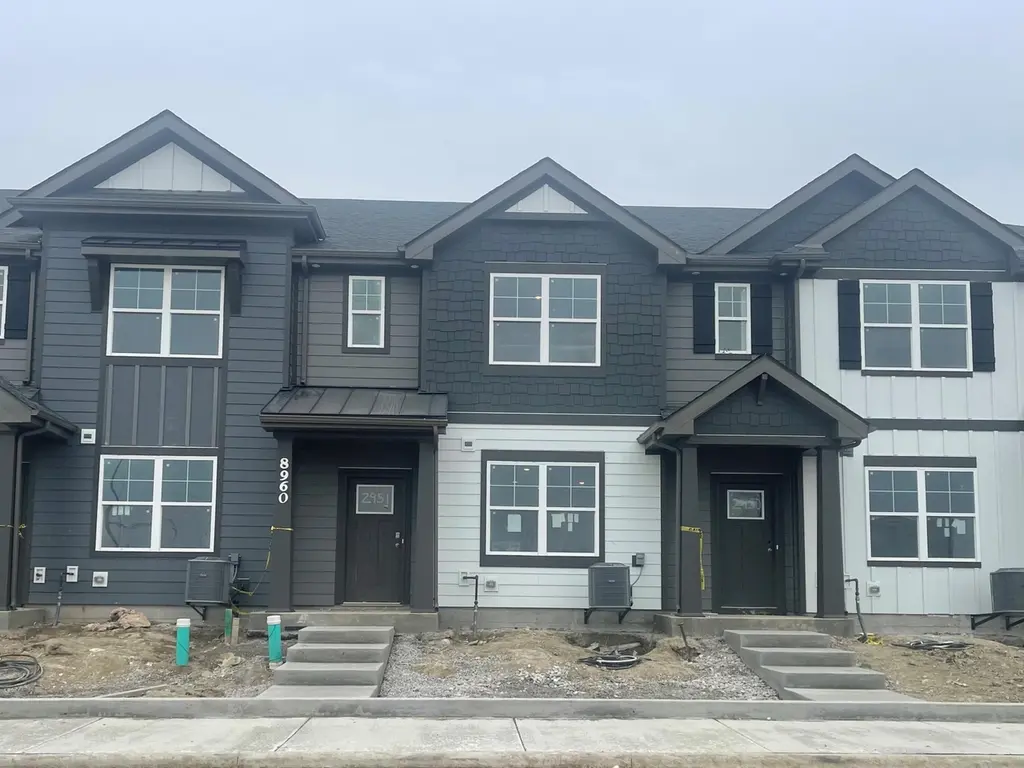
 🏗️ New Construction
9026 Remington Way · St. John, IN
Flood risk 1/10 · Minimal
- FEMA flood zone
- X (unshaded)
- Chance of flooding over 30 yrs
- 0.0%
- Est. flood insurance / yr
- $507 – $1,088
Fire risk 1/10 · Minimal
- Est. fire insurance / yr
- $717 – $1,331
Heat risk 3/10 · Minor
- Hot days now (above 101°F)
- 7 days/yr
- Hot days in 30 yrs
- 16 days/yr
Wind risk 2/10 · Minimal
- Chance of severe wind over 30 yrs
- 1.0%
Air-quality risk 2/10 · Minimal
- Unhealthy air days now
- 1 days/yr
- Unhealthy air days in 30 yrs
- 1 days/yr
Risk factors via First Street. Map © Google.
Why this score? — see what drove the F grade
The composite is a weighted blend of 9 inputs, each scored 0–100. Each bar is that input's sub-score; the figure is the points it added to the 100-point composite (weight × sub-score).
- Cash flow +7.8/30.0
- ARV discount +7.5/15.0
- Schools +4.5/10.0
- Condition / age +4.0/5.0
- 1% rule +3.0/10.0
- Rent growth +2.5/5.0
- Livability +2.5/5.0
- DSCR +1.8/10.0
- Appreciation +0.0/10.0
$289,990
🖨 Deal sheet 📄 Offer letter ✓ Due diligence
Listing remarks MLS
Discover yourself at 9026 Remington Way, in St. John, IN, a beautiful new home in The Gates of St. John Townhome community. This townhome will be ready for a AUGUST move-in! Homesite includes a fully sodded yard that is maintained throughout the year as well as snow removal in the winter. Introducing the Norfolk plan, a two-story townhome plan with stone exterior accents, covered front porches, and rear load garages. This townhome includes 3-bedroom, 2.5 bathroom within 1,543 square feet of living space. The living area is open concept, where your kitchen, great room, and dining areas blend seamlessly into a space perfect for everyday living and entertaining. The kitchen features designer white cabinetry, quartz countertops, island, and stainless-steel appliances, which make meal prep easy. You'll never be too far from the action with the living and dining area right there. A roomy loft, three bedrooms, linen closet an additional full bathroom, and a convenient laundry room on the second floor. The primary bedroom has its own walk-in closet and en suite bathroom. The private bathroom includes a double vanity with quartz countertops. All D. R. Horton homes come with an industry-leading suite of smart home products that keep you connected with the people and place you value most. Photos are for representational purposes only; finishes may vary per home.
Key facts
- Expansive kitchen
- Fully sodded yard
- Luxury vinyl plank
Tags
Property features AI
Finance
- HOA & community: Homeowners association with a $200 monthly fee; Association covers grounds maintenance, snow removal, and structure maintenance; Association amenities: Other
Exterior
- Parking: Attached garage; Garage faces rear; Driveway; Garage door opener; 2-car garage
- Security: Smoke detector(s)
- Utilities: Public water; Public sewer; 100 amp electric service; Cable available
- Home design: New construction (under construction); Two-story home; Property attached
- Construction: Built in 2025
- Exterior features: Neighborhood view; Other exterior features
Interior
- Kitchen: Range; Microwave; Dishwasher; Disposal; Pantry
- Bedrooms: Primary bedroom; Bedroom 2; Bedroom 3; Loft (can be used as living/bedroom space)
- Flooring: Carpet; Vinyl
- Bathrooms: One full bathroom; One three-quarter bathroom; One half bathroom
- Heating & cooling: Forced air heating (natural gas); Central air conditioning
- Interior features: Double vanity; Walk-in closet(s); Pantry; Open floorplan; Smoke detector(s)
- Laundry & utility: Upper-level laundry room; Washer hookup; Gas dryer hookup
Neighborhood map
What this means for you Summary
Snapshot
- This is a 3-bed/2.5-bath townhouse listed at $290k. Condition is rated good.
Deal economics
- At list price, monthly cash flow is $-393 ($-5k/yr) — negative.
- The deal already cash-flows at list — no discount required.
- To meet the 1% rule (rent ≥ 1% of price), the offer needs to be $280k (3.5% below list).
- Recommended offer: $280k (3.5% below list) — sets the bar for 1% rule.
- Cap rate 4.9% vs local median 3.6% in St. John — top-decile yield for the area; either an underpriced asset or a hidden risk that comps aren't pricing in. Stress-test before assuming the spread holds.
Location & tenants
- Location reads: area grade F — affects rentability + tenant quality, not the cash-flow math above.
- Hanover Community School Corporation (suburban): math 49% / reading 53% proficiency, ranked #38 of 301 in IN (top 13%) — acceptable for families but not a draw, mixed tenant base, ~2y average lease; only 20% free/reduced lunch — higher-income household profile.
- Market conditions: 260 active listings in the ZIP; 5 comparable units currently listed for rent nearby; rentals lingering (median 44d on market — plan ~5-8 weeks vacancy on turnover, expect pricing pressure); 60% of comp listings sitting > 30 days — soft ceiling on asking rent; 1,642 units permitted in Lake County in 2024 (14 in 5+ unit buildings).
Forward outlook
- Local home prices are declining (-3.0%/yr); year-one equity from $2k of loan paydown is wiped out by about $10k of value loss. Plan a longer hold.
- Lake County population projected to shrink 7% by 2050 — rents likely to lag national; underwrite the cash flow, not the appreciation.
Negotiation context
- It's been on market 16 days — a 2% lower offer ($286k) is reasonable based on typical stale-listing flexibility.
- 3 sale attempts with the ask held roughly flat each time — persistent listings suggest the price (not the market) is what's stuck; bring a comps-based counter.
Questions for the listing agent
- What do current leases actually rent for vs. the listed asking? Can we see a recent rent roll and the last 12 months of T-12 income?
- What does the HOA fee cover, when was the last increase, and are there any pending special assessments or reserve-fund shortfalls?
- Is there a deadline driving the sale (1031 exchange, divorce, estate, relocation)? That informs how much negotiation room exists.
- The area grade is low — what's the realistic commute time and amenity access for the typical tenant pool here? Any planned neighborhood developments (good or bad) we should know about?
- What's the average days-on-market for RENTAL listings here right now (not sales)? A rising rental-DOM trend means longer vacancies and softer asking-rent achievability than the comps imply.
- What's the recent tenant-quality profile in this submarket — average credit score on applications, eviction rate, late-payment / NSF rate, and stable-employment percentage? A property-management company in the area should have these aggregated.
- How much new for-sale + rental construction is in the pipeline within 1–3 miles? Heavy new supply typically softens prices + rents 12–24 months out; constrained supply supports both.
Investment metrics
- 1% rule
- 0.80% ✗
- Cap rate
- 4.94%
- Cash-on-cash
- -4.84%
- DSCR
- 0.78
- GRM
- 10.4
CMA / ARV
- ARV (median comp)
- $347,801
- List price
- $289,990
- Delta
- -14.61%
- Verdict
- UNDERPRICED
- Comps
- 20 within 1.0 mi
Show comp detail 12 sales within ~0.75 mi
| Address | Dist | Beds/Ba | Sqft | Sold | Price | $/sf | Match |
|---|---|---|---|---|---|---|---|
| 8952 Remington Way | 0.01mi | 3/2.5 | 1,542 (0%) | 1mo | $303,990 | $197 | 99 |
| 8954 Remington Way | 0.01mi | 3/2.5 | 1,542 (0%) | 1mo | $293,990 | $191 | 99 |
| 8958 Remington Way | 0.03mi | 3/2.5 | 1,542 (0%) | 0mo | $293,990 | $191 | 98 |
| 8959 Remington Way | 0.03mi | 3/2.5 | 1,543 (+0%) | 0mo | $306,490 | $199 | 98 |
| 10907 Remington Pl | 0.01mi | 3/2.5 | 1,542 (0%) | 2mo | $288,990 | $187 | 98 |
| 8956 Remington Way | 0.07mi | 3/2.5 | 1,543 (+0%) | 2mo | $290,165 | $188 | 95 |
| 10915 Remington Pl | 0.07mi | 3/2.5 | 1,542 (0%) | 4mo | $289,990 | $188 | 94 |
| 9346 W 107th Ln | 0.40mi | 2/2.0 (-1) | 1,550 (+0%) | 0mo | $325,000 | $210 | 73 |
| 8737 Clover Ln | 0.27mi | 3/2.5 | 1,756 (+14%) | 1mo | $309,000 | $176 | 64 |
| 8746 Clover Ln | 0.28mi | 3/2.0 | 1,756 (+14%) | 5mo | $322,340 | $184 | 58 |
| 8690 Larkspur Ln | 0.35mi | 3/2.5 | 1,751 (+14%) | 4mo | $307,000 | $175 | 57 |
| 8700 Larkspur Ln | 0.34mi | 3/2.5 | 1,758 (+14%) | 7mo | $315,000 | $179 | 55 |
Match score weights: distance 35% · size 25% · config 20% · recency 20%. Top-matched comps best support the ARV.
Projected returns pro-forma
-3.0% appreciation · 3.0% rent growth · sell at horizon
- IRR
- -24.5%
- Equity multiple
- 0.17×
- Total profit
- $-81,228
- Equity at exit
- $51,858
- IRR
- -19.8%
- Equity multiple
- -0.05×
- Total profit
- $-102,296
- Equity at exit
- $30,071
Cash invested: $97,384 (down + closing). Projections, not guarantees.
Landlord ↔ Tenant lean methodology
- Overall (STATE)
- 90 Strongly Landlord-Friendly
- State Indiana
- 90 Strongly Landlord-Friendly · R+11
- County
- — inherits STATE
- City
- — inherits STATE
ZIP-level market 46373
- Home prices YoY
- -23.8%
- Active inventory
- 260
- Price-to-rent
- 8.6×
Monthly cashflow live
- Estimated rent
- $2,798 high interval (Pro) →
- Mortgage (P&I)
- −$1,824
- Tax est. 1.5%
- −$435 /mo · $5,217/yr
- Insurance
- −$145
- HOA
- −$200
- Vacancy / Maint / Mgmt
- −$588
- Net cashflow
- $-393
Break-even live
UW: 25.0% down · 7.5% · 30yr · 1.5% tax · 5.0% vac · 8.0% maint · 8.0% mgmt
Financing live
Cash to close
- Down payment
- $86,950
- Closing costs
- $10,434
- Reserves months
- —
- Total cash needed
- —
Loan-product check · same deal, 3 products live
Conventional
25% down · 7.5% · 30yr
- Down + closing
- —
- Monthly P&I
- —
- Monthly cashflow
- —
- DSCR
- —
- Eligible?
- —
Personal DTI + credit; lowest rate.
DSCR
20% down · 8.5% · 30yr
- Down + closing
- —
- Monthly P&I
- —
- Monthly cashflow
- —
- DSCR
- —
- Eligible?
- —
No personal income docs; deal must DSCR.
Hard money
10% down · 12.0% · 12mo
- Down + closing
- —
- Monthly P&I
- —
- Monthly cashflow
- —
- DSCR
- —
- Eligible?
- —
Short-term bridge; refi at stabilization.
Rent comps 5 comps
| Address | Beds | Baths | Sqft | Rent | $/sqft | DOM | Units | Dist |
|---|---|---|---|---|---|---|---|---|
| 8769 W 108th Ln Saint John, IN | 3.0 | 2.5 | 1758 | $2,775 | $1.58 | 43d | 1 | 0.22mi |
| 8754 Clover Ln Saint John, IN | 3.0 | 2.5 | 1756 | $2,675 | $1.52 | 43d | 1 | 0.26mi |
| 8726 Orchid Dr Saint John, IN | 3.0 | 2.5 | 1756 | $2,725 | $1.55 | 43d | 1 | 0.29mi |
| 8688 Larkspur Ln Saint John, IN | 3.0 | 2.5 | 1758 | $3,000 | $1.71 | 1d | 1 | 0.34mi |
| 10342 Adler Cv Saint John, IN | 3.0 | 2.0 | 1944 | $3,000 | $1.54 | 1d | 1 | 0.76mi |
HOA detail
- Monthly dues
- $200 · $2,400/yr
- Likely covers
- snow removal
Listing history 14 events
-
2026-06-18days on market $289,990 Active 16 DOM
-
2026-06-17days on market $289,990 Active 15 DOM
-
2026-06-16days on market $289,990 Active 14 DOM
-
2026-06-15days on market $289,990 Active 13 DOM
-
2026-06-13pricedays on market $289,990 Active 11 DOM
-
2026-06-09days on market $296,990 Active 7 DOM
-
2026-06-08days on market $296,990 Active 6 DOM
-
2026-06-07days on market $296,990 Active 5 DOM
-
2026-06-04days on market $296,990 Active 2 DOM
-
2026-06-02days on market $296,990 Active 1 DOM
-
2026-06-01days on market $296,990 Active 38 DOM
-
2026-05-31days on market $296,990 Active 37 DOM
-
2026-04-24$296,990 Active 1264-char remark
-
2026-04-22$296,990 Active 1371-char remark
Show marketing remark (1373 chars)
Discover yourself at 9026 Remington Way, in St. John, IN, a beautiful new home in The Gates of St. John Townhome community. This townhome will be ready for a AUGUST move-in! Homesite includes a fully sodded yard that is maintained throughout the year as well as snow removal in the winter. Introducing the Norfolk plan, a two-story townhome plan with stone exterior accents, covered front porches, and rear load garages. This townhome includes 3-bedroom, 2.5 bathroom within 1,543 square feet of living space. The living area is open concept, where your kitchen, great room, and dining areas blend seamlessly into a space perfect for everyday living and entertaining. The kitchen features designer white cabinetry, quartz countertops, island, and stainless-steel appliances, which make meal prep easy. You'll never be too far from the action with the living and dining area right there. A roomy loft, three bedrooms, linen closet an additional full bathroom, and a convenient laundry room on the second floor. The primary bedroom has its own walk-in closet and en suite bathroom. The private bathroom includes a double vanity with quartz countertops. All D. R. Horton homes come with an industry-leading suite of smart home products that keep you connected with the people and place you value most. Photos are for representational purposes only; finishes may vary per home.
ⓘ Source: listings_history table (triggers on properties + properties_extension) + one-shot
backfill from property_details.listing_events for pre-trigger history.
Climate risk First Street
- Flood 1/10 Low FEMA zone X (unshaded) · 0% chance over 30 yrs
- Wildfire 1/10 Low
- Heat 3/10 Moderate 7 d/yr ≥101°F today · 16 d/yr by 30 yrs out
- Wind 2/10 Low 100% chance of damaging wind over 30 yrs
- Air quality 2/10 Low 1 unhealthy d/yr today · 1 by 30 yrs out
Nearby sold comps map
Loading sold comps map…
Walkable amenities ~0.75 mi
Loading nearby amenities…
Taxation est. · year 1
- Rental income
- $33,577
- − Mortgage interest
- −$19,482
- − Property taxes
- −$5,217
- − Insurance
- −$1,739
- − Repairs & maintenance
- −$2,686
- − Management
- −$2,686
- − HOA
- −$2,400
- − Depreciation
- −$10,118
- Taxable loss
- −$10,751
- Est. tax savings @ 24.0%
- +$2,580
- After-tax cash flow
- $-2,136/yr
For passive investors: Depreciation is non-cash, so a rental often shows a tax loss while cash-flowing — sheltering income. Rental losses are passive: they offset passive income freely, and up to $25,000/yr can offset ordinary (W-2) income if you actively participate and your MAGI is under $100k (phasing out to $0 by $150k); unused losses carry forward. On sale, claimed depreciation is recaptured at up to 25%, and gains may owe capital-gains tax (a 1031 exchange can defer both). Figures are a year-1 estimate at your 24.0% rate — not tax advice; consult a CPA.
Condition & rehab AI · 12 photos
This townhome is in excellent condition with modern finishes and a well-maintained exterior. It is move-in ready and would benefit from some minor updates to enhance its curb appeal and value.
Value-add opportunities
- Resale Paint exterior siding — Fresh paint can enhance curb appeal and property value
- Resale Replace window treatments — Fresh window treatments can improve the home's appearance and energy efficiency
- Both Install smart home devices — Smart home devices can increase convenience and property value
- Both Add outdoor lighting — Outdoor lighting can improve safety and curb appeal
Renovation cost estimate screening
Value-add ROI direction
- Resale Paint exterior siding — Fresh paint can enhance curb appeal and property value ↑
- Resale Replace window treatments — Fresh window treatments can improve the home's appearance and energy efficiency ↑
- Both Install smart home devices — Smart home devices can increase convenience and property value ↑
- Both Add outdoor lighting — Outdoor lighting can improve safety and curb appeal ↑
ⓘ Cost ranges are severity-bucket heuristics (US national rule-of-thumb). Get contractor quotes + a written scope before underwriting a rehab budget.
Schools (NCES district)
- District
- Hanover Community School Corporation
- NCES district ID
- 1804350
- Math proficiency
- 49% ▼ -11.00%
- Reading proficiency
- 53% ▼ -7.00%
- Median HH income
- $68,151
- Composite
- 45.34/100
- National rank
- #2637
- State rank
- #38 of 301 in IN
Livability — St. John
No livability data for this city. (Only ~50 U.S. cities are tracked.)
Census & demographics
- Census place
- St. John, IN
- City population
- 18,509
- Population (ZIP)
- 18,509
Population outlook (Lake County) Hauer SSP2
- Today (2025)
- 484,026 people
- By 2030
- 478,091 · -1.2%
- By 2040
- 462,974 · -4.3%
- By 2050
- 449,894 · -7.1%
- By 2075
- 436,169 · -9.9%
- By 2100
- 426,607 · -11.9%
Race, ethnicity, and origin ACS 2023
- Neighborhood character
- Predominantly White (82%)
- Race & ethnicity
- White 82% Hispanic / Latino 9% Two or more races 5% Black 3% Asian 2%
- Hispanic origin (detail)
- Mexican 7% Puerto Rican 1%
- Common ancestry
- Romanian 21% Iranian 6% Lithuanian 2%
- Foreign-born
- 6% · Canada
- Languages at home
- 89% English-only · Spanish 5% Russian/Polish/Slavic 4% Other Indo-European 1%
Political lean MEDSL · Lake
- 2024 margin
- Lean D (+5.6) · D 52.1% · R 46.5% · Other 1.5%
- 2008→2024 swing
- -28.6pp toward R · 2008: 34.3pp · 2024: 5.6pp
- All cycles
- 2024: D+5.6 2020: D+15.1 2016: D+20.6 2012: D+31.0 2008: D+34.3
Not yet ingested
- Civics
- —
Market trends
- HPI YoY
- ▼ -69.86%
- Current HPI
- 224.1176
- Rent YoY
- —
- Metro
- —
- State GDP YoY
- ▲ 2.90%
- F500 in state
- 18
Industry mix (Fortune 500 HQ in IN)
| Industry | F500 HQs | Revenue |
|---|---|---|
| Industrial Machinery | 2 | $37B |
|
||
| Healthcare | 1 | $177B |
|
||
| Pharmaceuticals | 1 | $45B |
|
||
| Metals / Steel | 1 | $18B |
|
||
| Agriculture | 1 | $17B |
|
||
| Packaging | 1 | $12B |
|
||
Price history
-2.4% since first listed8 events — show timeline
- 2026-06-12 Price Changed $289,990 NIRA MLS as Distributed by MLS Grid
- 2026-06-12 Price Changed $289,990 Zillow
- 2026-06-11 Price Changed $294,990 NIRA MLS as Distributed by MLS Grid
- 2026-06-11 Price Changed $294,990 Zillow
- 2026-06-02 Listing Removed — NIRA MLS as Distributed by MLS Grid
- 2026-06-02 Listed $296,990 NIRA MLS as Distributed by MLS Grid
- 2026-04-24 Listed $296,990 NIRA MLS as Distributed by MLS Grid
- 2026-04-22 Listed $296,990 Zillow
Cash-flow waterfall
monthlySold comps — $/sqft
last 12 mo · ≤1 miLoading sold comps…