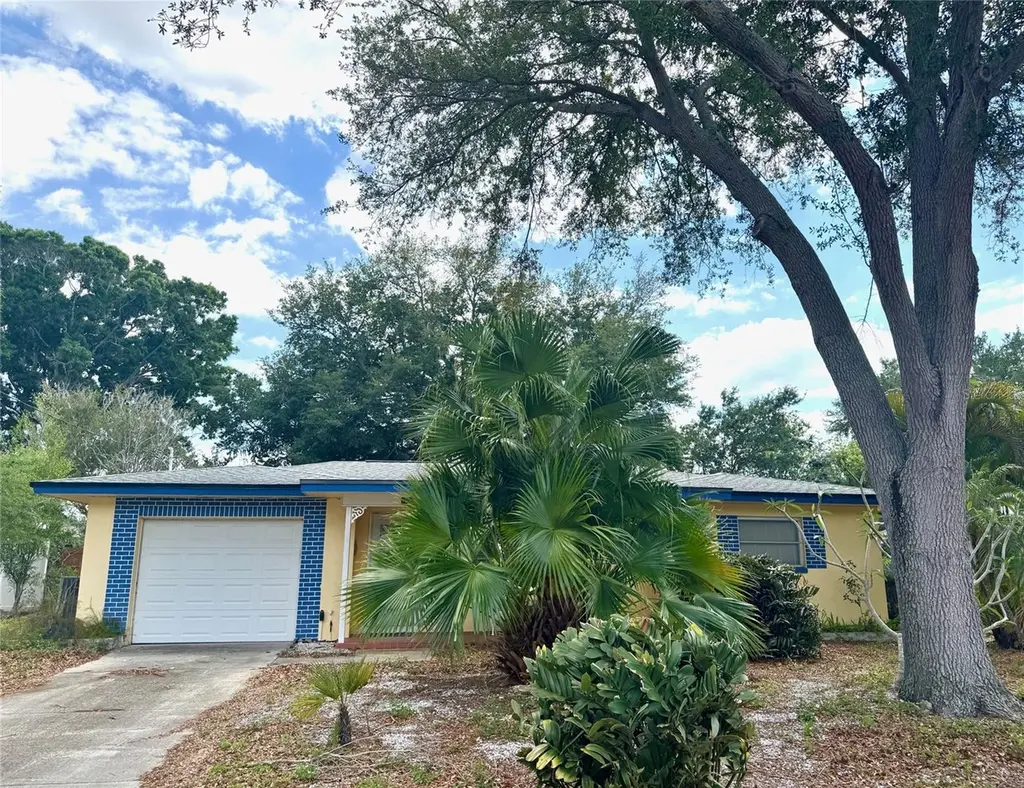
1035 Robmar Rd · Dunedin, FL
Flood risk 5/10 · Moderate
- FEMA flood zone
- X (unshaded)
- Chance of flooding over 30 yrs
- 0.51%
- Est. flood insurance / yr
- $507 – $1,088
Fire risk 1/10 · Minimal
- Est. fire insurance / yr
- $947 – $1,759
Heat risk 10/10 · Severe
- Hot days now (above 108°F)
- 7 days/yr
- Hot days in 30 yrs
- 28 days/yr
Wind risk 10/10 · Severe
- Chance of severe wind over 30 yrs
- 99.0%
Air-quality risk 3/10 · Minor
- Unhealthy air days now
- 2 days/yr
- Unhealthy air days in 30 yrs
- 3 days/yr
Risk factors via First Street. Map © Google.
Why this score? — see what drove the D+ grade
The composite is a weighted blend of 9 inputs, each scored 0–100. Each bar is that input's sub-score; the figure is the points it added to the 100-point composite (weight × sub-score).
- Cash flow +12.5/30.0
- ARV discount +12.4/15.0
- Schools +4.3/10.0
- Livability +4.3/5.0
- DSCR +3.7/10.0
- Rent growth +3.2/5.0
- Condition / age +2.5/5.0
- 1% rule +2.3/10.0
- Appreciation +0.0/10.0
$335,000
🖨 Deal sheet (PDF) 📄 Offer letter ✓ Due diligence
Listing remarks MLS
CUTE LITTLE HOUSE WITH FENCED LARGE PRETTY BACK YARD. HUNTER GREEN NEW SHINGLE ROOF. NEW NEUTRAL CARPETING. NICE FRONT PORCH AND BACK PATIO. SMALL FAMILY ROOM OFF KITCHEN.
Key facts
- Bonus florida room
- 8,451 sq ft lot
- Garage
Tags
Neighborhood map
What this means for you Summary
Snapshot
- This is a 2-bed/1.5-bath single-family listed at $335k.
Deal economics
- At list price, monthly cash flow is $-46 ($-552/yr) — negative.
- To cash-flow at today's rent, offer at most $327k (2.4% below list).
- To meet the 1% rule (rent ≥ 1% of price), the offer needs to be $244k (27.2% below list).
- Recommended offer: $244k (27.2% below list) — sets the bar for 1% rule.
- Cap rate 6.1% vs local median 2.9% in Dunedin — top-decile yield for the area; either an underpriced asset or a hidden risk that comps aren't pricing in. Stress-test before assuming the spread holds.
Location & tenants
- Location reads 86/100 on livability (#15 in FL, #411 nationally) — a professional / high-income tenant draw. Strengths: crime A+, commute A+, housing A+; Watch: employment C-, amenities D.
- Pinellas (suburban): math 51% / reading 51% proficiency, ranked #31 of 73 in FL (top 42%) — acceptable for families but not a draw, mixed tenant base, ~2y average lease.
- Zoned schools: San Jose Elementary School (math 62% / reading 62%, grade B, #608 of 2,144 statewide, top 29%, 331 students, 56% FRL); Palm Harbor Middle School (math 59% / reading 57%, grade B, #151 of 571 statewide, top 27%, 1,080 students, 37% FRL); Dunedin High School (math 36% / reading 45%, grade F, #294 of 667 statewide, top 44%, 1,203 students, 48% FRL) — zoned schools at 47% FRL track the district average.
- Market conditions: Rents rising (+2.7%/yr); 482 active listings in the ZIP; 40 comparable units currently listed for rent nearby; rentals at typical pace (median 20d on market — plan ~3-4 weeks tenant-placement turnaround); 2,676 units permitted in Pinellas County in 2024 (1,422 in 5+ unit buildings).
- This rent runs 40% of the median local income ($74k/yr) — at the standard rent-burdened threshold; future hikes will face affordability resistance.
Forward outlook
- Local home prices are declining (-3.0%/yr); year-one equity from $2k of loan paydown is wiped out by about $10k of value loss. Plan a longer hold.
- Pinellas County population projected at +14% by 2050 — modest demand growth; plan on rents tracking national, not racing it.
Negotiation context
- Only 5 days on market — expect competitive offers; lowballing is unlikely to land.
- 2 sale attempts since 20y ago with the ask held roughly flat each time — persistent listings suggest the price (not the market) is what's stuck; bring a comps-based counter.
- Current owner paid $175k; list at $335k implies a 91% gain — meaningful room to come down on a strong offer.
Risks & watch-outs
- Climate carrying-cost: moderate flood risk; severe wind risk, 99% chance of damaging wind over 30y; extreme-heat days projected 7→28/yr by 2055 (HVAC capex compounding) — expect insurance premiums to compound above CPI over the hold.
Questions for the listing agent
- What do current leases actually rent for vs. the listed asking? Can we see a recent rent roll and the last 12 months of T-12 income?
- Built in 1964 — when were the roof, HVAC, electrical panel, plumbing, and water heater last replaced?
- Is there a deadline driving the sale (1031 exchange, divorce, estate, relocation)? That informs how much negotiation room exists.
- Schools are A-rated — typically a magnet for longer-tenancy family renters. What's the average tenant stay here, and is there a school-zone premium baked into asking?
- The area grade is low — what's the realistic commute time and amenity access for the typical tenant pool here? Any planned neighborhood developments (good or bad) we should know about?
- What's the average days-on-market for RENTAL listings here right now (not sales)? A rising rental-DOM trend means longer vacancies and softer asking-rent achievability than the comps imply.
- What's the recent tenant-quality profile in this submarket — average credit score on applications, eviction rate, late-payment / NSF rate, and stable-employment percentage? A property-management company in the area should have these aggregated.
- How much new for-sale + rental construction is in the pipeline within 1–3 miles? Heavy new supply typically softens prices + rents 12–24 months out; constrained supply supports both.
Investment metrics
- 1% rule
- 0.73% ✗
- Cap rate
- 6.13%
- Cash-on-cash
- -0.59%
- DSCR
- 0.97
- GRM
- 11.4
CMA / ARV
- ARV (on-the-fly)
- $376,194
- Comps found
- 12
Show comp detail 12 sales within ~0.75 mi
| Address | Dist | Beds/Ba | Sqft | Sold | Price | $/sf | Match |
|---|---|---|---|---|---|---|---|
| 1035 Robmar Rd | 0.00mi | 2/1.5 | 1,014 (0%) | 0mo | $357,100 | $352 | 100 |
| 797 Lakeside Dr | 0.58mi | 2/2.0 | 995 (-2%) | 2mo | $530,000 | $533 | 66 |
| 1825 San Mateo Dr | 0.54mi | 2/1.0 | 1,001 (-1%) | 9mo | $260,000 | $260 | 63 |
| 1165 Falcon Dr | 0.53mi | 2/2.0 | 1,043 (+3%) | 8mo | $485,000 | $465 | 62 |
| 1889 San Mateo Dr | 0.56mi | 2/1.5 | 976 (-4%) | 8mo | $245,000 | $251 | 61 |
| 2028 Douglas Ave | 0.68mi | 2/1.5 | 985 (-3%) | 4mo | $365,000 | $371 | 61 |
| 2049 Woodward Ave | 0.66mi | 2/1.0 | 1,033 (+2%) | 5mo | $380,000 | $368 | 60 |
| 1701 Pinehurst Rd Unit 22B | 0.30mi | 2/1.0 | 875 (-14%) | 5mo | $177,500 | $203 | 57 |
| 2013 Princeton Ave | 0.48mi | 2/2.0 | 1,119 (+10%) | 8mo | $415,000 | $371 | 52 |
| 975 Gulf View Blvd | 0.47mi | 2/1.5 | 864 (-15%) | 5mo | $330,000 | $382 | 49 |
| 1747 Santa Anna Dr | 0.59mi | 2/1.5 | 1,166 (+15%) | 3mo | $475,500 | $408 | 45 |
| 450 San Salvador Dr | 0.73mi | 2/2.0 | 1,152 (+14%) | 1mo | $420,000 | $365 | 40 |
Match score weights: distance 35% · size 25% · config 20% · recency 20%. Top-matched comps best support the ARV.
Projected returns pro-forma
-3.0% appreciation · 2.69% rent growth · sell at horizon
- IRR
- -17.6%
- Equity multiple
- 0.38×
- Total profit
- $-58,145
- Equity at exit
- $49,950
- IRR
- -10.3%
- Equity multiple
- 0.38×
- Total profit
- $-58,200
- Equity at exit
- $28,965
Cash invested: $93,800 (down + closing). Projections, not guarantees.
Landlord ↔ Tenant lean methodology
- Overall (STATE)
- 87 Strongly Landlord-Friendly
- State Florida
- 87 Strongly Landlord-Friendly · R+3
- County
- — inherits STATE
- City
- — inherits STATE
ZIP-level market 34698
- Rents YoY
- 2.7%
- Active inventory
- 482
- Price-to-rent
- 11.4×
Monthly cashflow live
- Estimated rent
- $2,440 high interval (Pro) →
- Mortgage (P&I)
- −$1,757
- Tax from tax record
- −$77 /mo · $922/yr
- Insurance
- −$140
- HOA
- −$0
- Vacancy / Maint / Mgmt
- −$512
- Net cashflow
- $-46
Break-even live
Sensitivity live
| Price | -10% $144 | -5% $49 | +0% $-46 | +5% $-141 | +10% $-236 |
|---|---|---|---|---|---|
| Rent | -10% $-239 | -5% $-142 | +0% $-46 | +5% $50 | +10% $147 |
| Rate | -1.0pp $123 | -0.5pp $39 | base $-46 | +0.5pp $-133 | +1.0pp $-221 |
UW: 25.0% down · 7.5% · 30yr · 1.5% tax · 5.0% vac · 8.0% maint · 8.0% mgmt
Financing live
Cash to close
- Down payment
- $83,750
- Closing costs
- $10,050
- Reserves months
- —
- Total cash needed
- —
Loan-product check · same deal, 3 products live
Conventional
25% down · 7.5% · 30yr
- Down + closing
- —
- Monthly P&I
- —
- Monthly cashflow
- —
- DSCR
- —
- Eligible?
- —
Personal DTI + credit; lowest rate.
DSCR
20% down · 8.5% · 30yr
- Down + closing
- —
- Monthly P&I
- —
- Monthly cashflow
- —
- DSCR
- —
- Eligible?
- —
No personal income docs; deal must DSCR.
Hard money
10% down · 12.0% · 12mo
- Down + closing
- —
- Monthly P&I
- —
- Monthly cashflow
- —
- DSCR
- —
- Eligible?
- —
Short-term bridge; refi at stabilization.
Rent comps 40 comps
| Address | Beds | Baths | Sqft | Rent | $/sqft | DOM | Units | Dist |
|---|---|---|---|---|---|---|---|---|
| 2021 Valley Dr Dunedin, FL | 3.0 | 2.0 | 1445 | $4,500 | $3.11 | 26d | 1 | 0.37mi |
| 1525 Ruth Rd Dunedin, FL | 2.0 | 2.0 | 1379 | $3,200 | $2.32 | 6d | 1 | 0.45mi |
| 1479 Ruth Rd Dunedin, FL | 2.0 | 2.0 | 1235 | $2,700 | $2.19 | 26d | 1 | 0.52mi |
| 2013 Woodward Ave Dunedin, FL | 2.0 | 2.0 | 1405 | $2,400 | $1.71 | 26d | 1 | 0.57mi |
| 1849 San Mateo Dr Dunedin, FL | 3.0 | 1.0 | 1128 | $2,800 | $2.48 | 19d | 1 | 0.57mi |
| 1412 Gladys Cir Unit 1466152P Dunedin, FL | 3.0 | 2.0 | 1097 | $3,849 | $3.51 | 0d | 1 | 0.61mi |
| 1141 San Christopher Dr Apt B Dunedin, FL | 2.0 | 1.0 | 1000 | $1,595 | $1.59 | 3d | 1 | 0.62mi |
| 1388 Robin Hood Ln Unit 1141-B Dunedin, FL | 2.0 | 1.0 | 1000 | $1,595 | $1.59 | 3d | 1 | 0.63mi |
| 2005 McMullen Ave Dunedin, FL | 2.0 | 2.0 | 1350 | $2,595 | $1.92 | 26d | 1 | 0.66mi |
| 2011 McMullen Ave Dunedin, FL | 2.0 | 2.0 | 1300 | $2,395 | $1.84 | 3d | 1 | 0.68mi |
| 2015 McMullen Ave Dunedin, FL | 2.0 | 2.0 | 1300 | $2,295 | $1.77 | 26d | 1 | 0.69mi |
| 2019 McMullen Ave Dunedin, FL | 2.0 | 2.0 | 1300 | $2,295 | $1.77 | 19d | 1 | 0.70mi |
| 1454 Michigan Blvd Dunedin, FL | 2.0 | 1.0 | 1000 | $2,300 | $2.30 | 5d | 1 | 0.78mi |
| 690 Regina Rd Dunedin, FL | 2.0 | 1.0 | 745 | $2,195 | $2.95 | 6d | 1 | 0.79mi |
| 1268 Pinehurst Rd Dunedin, FL | 1.0 | 1.0 | 1080 | $1,500 | $1.39 | 18d | 1 | 0.80mi |
| 2233 Snead Ave Dunedin, FL | 3.0 | 2.0 | 1284 | $3,000 | $2.34 | 18d | 1 | 0.83mi |
| 2233 Snead Ave Dunedin, FL | 3.0 | 2.0 | 1284 | $3,000 | $2.34 | 26d | 1 | 0.83mi |
| 1235 Bass Blvd Dunedin, FL | 3.0 | 2.0 | 1300 | $2,550 | $1.96 | 19d | 1 | 0.84mi |
| 1187 Bass Blvd Unit C Dunedin, FL | 2.0 | 1.0 | 850 | $1,850 | $2.18 | 19d | 1 | 0.92mi |
| 1187 Bass Blvd Unit A Dunedin, FL | 2.0 | 1.0 | 850 | $1,850 | $2.18 | 26d | 1 | 0.92mi |
| 1196 Angle Rd Dunedin, FL | 1.0 | 1.0 | 700 | $1,675 | $2.39 | 6d | 1 | 0.93mi |
| 1515 County Road 1 Dunedin, FL | 1.0–2.0 | 1.0 | 719 | $1,750 | $2.43 | 9d | 1 | 0.94mi |
| 1579 Bayshore Blvd Dunedin, FL | 3.0 | 2.0 | 1040 | $3,500 | $3.37 | 9d | 1 | 0.95mi |
| 1523 Bayshore Blvd Unit 6 Dunedin, FL | 3.0 | 1.0 | 1061 | $3,000 | $2.83 | 26d | 1 | 1.00mi |
| 1602 Amberlea Dr S Dunedin, FL | 1.0 | 1.0 | 725 | $2,400 | $3.31 | 0d | 1 | 1.02mi |
| 612 Bass Ct Dunedin, FL | 1.0–2.0 | 1.0 | 698 | $2,040 | $2.92 | 0d | 6 | 1.06mi |
| 1580 Andover Dr Unit House Dunedin, FL | 2.0 | 1.0 | 1241 | $2,200 | $1.77 | 26d | 1 | 1.16mi |
| 2489 Del Rio Way Dunedin, FL | 2.0 | 2.0 | 1250 | $2,500 | $2.00 | 26d | 1 | 1.18mi |
| 525 Bay St Dunedin, FL | 2.0 | 1.0 | 1104 | $3,500 | $3.17 | 6d | 1 | 1.18mi |
| 2491 Coronado Way Dunedin, FL | 3.0 | 2.0 | 1346 | $2,950 | $2.19 | 6d | 1 | 1.21mi |
| 580 Skinner Blvd Unit 4 Dunedin, FL | 2.0 | 1.0 | 750 | $2,045 | $2.73 | 26d | 1 | 1.21mi |
| 2494 Del Rio Way Dunedin, FL | 3.0 | 1.5 | 1058 | $3,200 | $3.02 | 26d | 1 | 1.22mi |
| 841 Patricia Ave Dunedin, FL | 2.0 | 1.0–2.0 | 904 | $1,950 | $2.16 | 18d | 2 | 1.26mi |
| 841 Patricia Ave #103 Dunedin, FL | 2.0 | 1.0 | 874 | $2,000 | $2.29 | 26d | 1 | 1.26mi |
| 439 S Paula Dr Dunedin, FL | 1.0–2.0 | 1.0 | 612 | $1,995 | $3.26 | 25d | 3 | 1.29mi |
| 451 Skinner Blvd Unit A Dunedin, FL | 2.0 | 1.0 | 750 | $1,500 | $2.00 | 9d | 1 | 1.34mi |
| 433 S Paula Dr #17 Dunedin, FL | 2.0 | 2.5 | 1290 | $2,300 | $1.78 | 9d | 1 | 1.35mi |
| 941 Highland Ave Unit D Dunedin, FL | 1.0 | 1.0 | 1000 | $1,300 | $1.30 | 21d | 1 | 1.37mi |
| 1450 Mahogany Ln Palm Harbor, FL | 2.0 | 2.0 | 1353 | $2,300 | $1.70 | 26d | 1 | 1.39mi |
| 2651 Michael Pl #104 Dunedin, FL | 2.0 | 2.0 | 1230 | $2,100 | $1.71 | 4d | 1 | 1.42mi |
Listing history 5 events
-
2026-04-20status Pending
-
2026-04-15$335,000 Active
-
2006-11-16soldstatus $175,000
-
2006-11-15soldstatus $175,000 171-char remark
Show marketing remark (171 chars)
CUTE LITTLE HOUSE WITH FENCED LARGE PRETTY BACK YARD. HUNTER GREEN NEW SHINGLE ROOF. NEW NEUTRAL CARPETING. NICE FRONT PORCH AND BACK PATIO. SMALL FAMILY ROOM OFF KITCHEN.
-
2006-09-29$180,000 171-char remark
Show marketing remark (171 chars)
CUTE LITTLE HOUSE WITH FENCED LARGE PRETTY BACK YARD. HUNTER GREEN NEW SHINGLE ROOF. NEW NEUTRAL CARPETING. NICE FRONT PORCH AND BACK PATIO. SMALL FAMILY ROOM OFF KITCHEN.
ⓘ Source: listings_history table (triggers on properties + properties_extension) + one-shot
backfill from property_details.listing_events for pre-trigger history.
Tax reassessment forecast FL · Resets to sale price
- Current annual tax
- $922 · $77/mo
- Projected year-2 tax
- $2,780 · $232/mo
- Expected delta
- +$1,858/yr (+$155/mo · 201.4%)
ⓘ Screening estimate from a state-policy table — verify with the county assessor before closing.
Climate risk First Street
- Flood 5/10 Major FEMA zone X (unshaded) · 51% chance over 30 yrs
- Wildfire 1/10 Low
- Heat 10/10 Extreme 7 d/yr ≥108°F today · 28 d/yr by 30 yrs out
- Wind 10/10 Extreme 99% chance of damaging wind over 30 yrs
- Air quality 3/10 Moderate 2 unhealthy d/yr today · 3 by 30 yrs out
Nearby sold comps map
Loading sold comps map…
Walkable amenities ~0.75 mi
Loading nearby amenities…
Taxation est. · year 1
- Rental income
- $29,275
- − Mortgage interest
- −$18,765
- − Property taxes
- −$922
- − Insurance
- −$1,675
- − Repairs & maintenance
- −$2,342
- − Management
- −$2,342
- − Depreciation
- −$9,745
- Taxable loss
- −$6,517
- Est. tax savings @ 24.0%
- +$1,564
- After-tax cash flow
- $1,012/yr
For passive investors: Depreciation is non-cash, so a rental often shows a tax loss while cash-flowing — sheltering income. Rental losses are passive: they offset passive income freely, and up to $25,000/yr can offset ordinary (W-2) income if you actively participate and your MAGI is under $100k (phasing out to $0 by $150k); unused losses carry forward. On sale, claimed depreciation is recaptured at up to 25%, and gains may owe capital-gains tax (a 1031 exchange can defer both). Figures are a year-1 estimate at your 24.0% rate — not tax advice; consult a CPA.
Schools (NCES district)
- District
- Pinellas
- NCES district ID
- 1201560
- Math proficiency
- 51% ▼ -5.00%
- Reading proficiency
- 51% ▼ -3.00%
- Median HH income
- $46,270
- Composite
- 43.27/100
- National rank
- #3046
- State rank
- #31 of 73 in FL
Livability — Dunedin
- Score
- 86/100
- State rank
- #15
- US rank
- #411
Category grades
Schools grade is shown separately in the Schools card above.
Census & demographics
- Census place
- Dunedin, FL
- County
- Pinellas County · 939,478 people
- City population
- 38,171
- Metro
- Tampa-St. Petersburg-Clearwater, FL
- Population (ZIP)
- 38,171
- Household income
- $74,078
- Rent vs Own
- Severe rent burden
- 1390.0
Population outlook (Pinellas County) Hauer SSP2
- Today (2025)
- 1,027,532 people
- By 2030
- 1,063,586 · +3.5%
- By 2040
- 1,125,020 · +9.5%
- By 2050
- 1,168,637 · +13.7%
- By 2075
- 1,265,188 · +23.1%
- By 2100
- 1,260,357 · +22.7%
Race, ethnicity, and origin ACS 2023
- Neighborhood character
- Predominantly White (83%)
- Race & ethnicity
- White 83% Two or more races 7% Hispanic / Latino 6% Black 5% Asian 1%
- Hispanic origin (detail)
- Mexican 2% Puerto Rican 2%
- Common ancestry
- Lithuanian 4% Slovak 3% Romanian 3%
- Foreign-born
- 8% · Canada, South Korea
- Languages at home
- 92% English-only · Spanish 3% Other Indo-European 2% Russian/Polish/Slavic 1%
Political lean MEDSL · Pinellas
- 2024 margin
- Lean R (+5.2) · D 46.9% · R 52.1%
- 2008→2024 swing
- -13.5pp toward R · 2008: 8.3pp · 2024: -5.2pp
- All cycles
- 2024: R+5.2 2020: D+0.2 2016: R+1.1 2012: D+5.6 2008: D+8.3
Not yet ingested
- Civics
- —
Market trends
- HPI YoY
- ▼ -515.66%
- Current HPI
- 387.4694
- Rent YoY
- ▲ 2.69%
- Metro
- Tampa-St. Petersburg-Clearwater, FL
- State GDP YoY
- ▲ 3.28%
- F500 in state
- 36
Industry mix (Fortune 500 HQ in FL)
| Industry | F500 HQs | Revenue |
|---|---|---|
| Industrial Technology | 2 | $29B |
|
||
| Insurance | 2 | $17B |
|
||
| Retail | 1 | $60B |
|
||
| Technology Distribution | 1 | $58B |
|
||
| Homebuilding | 1 | $35B |
|
||
| Technology Manufacturing | 1 | $35B |
|
||
Price history
+86.1% since first listed5 events — show timeline
- 2026-04-20 Pending — Stellar MLS as Distributed by MLS Grid
- 2026-04-15 Listed $335,000 Stellar MLS as Distributed by MLS Grid
- 2006-11-16 Sold (Public Records) $175,000 Public Records
- 2006-11-15 Sold (MLS) $175,000 Stellar MLS as Distributed by MLS Grid
- 2006-09-29 Listed $180,000 Stellar MLS as Distributed by MLS Grid
Property tax history
-4.2%/yrLatest (2025): $922 · +9.1% YoY. Source: county tax records.
Cash-flow waterfall
monthlySold comps — $/sqft
last 12 mo · ≤1 miLoading sold comps…