 🏗️ New Construction
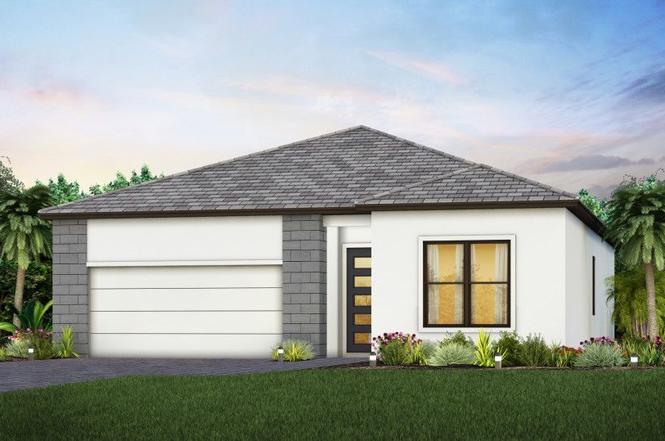
Cedar Plan · Ave Maria, FL
Flood risk 1/10 · Minimal
- FEMA flood zone
- AH
- Chance of flooding over 30 yrs
- 0.0%
- Est. flood insurance / yr
- $1,142 – $2,507
Fire risk 3/10 · Minor
- Est. fire insurance / yr
- $947 – $1,759
Heat risk 9/10 · Severe
- Hot days now (above 111°F)
- 7 days/yr
- Hot days in 30 yrs
- 27 days/yr
Wind risk 10/10 · Severe
- Chance of severe wind over 30 yrs
- 99.0%
Air-quality risk 2/10 · Minimal
- Unhealthy air days now
- 0 days/yr
- Unhealthy air days in 30 yrs
- 1 days/yr
Risk factors via First Street. Map © Google.
Why this score? — see what drove the D+ grade
The composite is a weighted blend of 9 inputs, each scored 0–100. Each bar is that input's sub-score; the figure is the points it added to the 100-point composite (weight × sub-score).
- Cash flow +13.6/30.0
- ARV discount +7.5/15.0
- Schools +5.0/10.0
- Appreciation +4.5/10.0
- DSCR +4.1/10.0
- 1% rule +3.8/10.0
- Rent growth +3.2/5.0
- Livability +2.5/5.0
- Condition / age +2.5/5.0
$359,990
🖨 Deal sheet (PDF) 📄 Offer letter ✓ Due diligence
Key facts
- Gathering room
- Welcoming foyer
- Covered lanai
Tags
Property features AI
Finance
- Other: Address: 4364 Washington Place Ave, Immokalee, FL 34142; Listing status: Active
- Financial info: List price $359,990
Exterior
- Parking: 2 total parking spaces; 2-car garage
- Home design: Plan: Cedar; New construction plan
Interior
- Bedrooms: 3 bedrooms
- Bathrooms: 2 full bathrooms
- Interior features: Living area of 1662
Neighborhood map
What this means for you Summary
Snapshot
- This is a 3-bed/2.0-bath single-family listed at $360k.
Deal economics
- At list price, monthly cash flow is $-134 ($-2k/yr) — negative.
- To cash-flow at today's rent, offer at most $341k (5.4% below list).
- To meet the 1% rule (rent ≥ 1% of price), the offer needs to be $317k (11.9% below list).
- Recommended offer: $317k (12.0% below list) — sets the bar for market timing.
Location & tenants
- Location reads: area grade D — affects rentability + tenant quality, not the cash-flow math above.
- Collier (suburban): math 60% / reading 56% proficiency, ranked #16 of 73 in FL (top 22%) — acceptable for families but not a draw, mixed tenant base, ~2y average lease.
- Zoned schools: Estates Elementary School (math 70% / reading 67%, grade B+, #409 of 2,144 statewide, top 20%, 862 students, 53% FRL); Corkscrew Middle School (math 68% / reading 59%, grade B+, #109 of 571 statewide, top 19%, 958 students, 43% FRL); Palmetto Ridge High School (math 43% / reading 51%, grade D-, #207 of 667 statewide, top 32%, 2,347 students, 38% FRL).
- Market conditions: Rents rising (+3.0%/yr); 453 active listings in the ZIP; 27 comparable units currently listed for rent nearby; rentals at typical pace (median 25d on market — plan ~3-4 weeks tenant-placement turnaround); 3,520 units permitted in Collier County in 2024 (959 in 5+ unit buildings).
- At $3,173/mo this rent would consume 61% of the median local household income ($62k/yr) (locally 1093% of renters already pay >50% of income on rent) — very limited rent-growth headroom before tenants either downsize or default.
Forward outlook
- Local home prices are declining (-1.1%/yr); year-one equity from $2k of loan paydown is wiped out by about $4k of value loss. Plan a longer hold.
- Collier County population projected at +30% by 2050 — long-run rental-demand tailwind backs the buy-and-hold thesis.
Negotiation context
- It's been on market 396 days — a 12% lower offer ($317k) is reasonable based on typical stale-listing flexibility.
Risks & watch-outs
- Watch-outs: flood insurance adds $152/mo.
- Climate carrying-cost: in FEMA flood zone AH (mandatory federal flood insurance); severe wind risk, 99% chance of damaging wind over 30y; extreme-heat days projected 7→27/yr by 2055 (HVAC capex compounding) — expect insurance premiums to compound above CPI over the hold.
Questions for the listing agent
- What do current leases actually rent for vs. the listed asking? Can we see a recent rent roll and the last 12 months of T-12 income?
- It's been on market 396 days. Have you received any prior offers? Is the seller open to a 12% concession, seller financing, or rate buy-down credit?
- What's the actual annual flood-insurance premium (NFIP or private), and is the property in a SFHA with mandatory coverage?
- Why hasn't it sold? Are there any deal-killer items the seller is aware of (foundation, flood, title, zoning, code violations)?
- Is there a deadline driving the sale (1031 exchange, divorce, estate, relocation)? That informs how much negotiation room exists.
- The area grade is low — what's the realistic commute time and amenity access for the typical tenant pool here? Any planned neighborhood developments (good or bad) we should know about?
- This sits on a lake — are riparian / water-frontage rights deeded with the parcel? Any dock permits, shoreline easements, or HOA water-use restrictions?
- What's the documented flood / surge / shoreline-erosion history here (FEMA AND non-FEMA — e.g., storm surge, creek backup, septic-field saturation)?
- Any water-quality or seasonal algae-bloom issues that affect tenant satisfaction or short-term-rental demand?
- What's the average days-on-market for RENTAL listings here right now (not sales)? A rising rental-DOM trend means longer vacancies and softer asking-rent achievability than the comps imply.
- What's the recent tenant-quality profile in this submarket — average credit score on applications, eviction rate, late-payment / NSF rate, and stable-employment percentage? A property-management company in the area should have these aggregated.
- How much new for-sale + rental construction is in the pipeline within 1–3 miles? Heavy new supply typically softens prices + rents 12–24 months out; constrained supply supports both.
Investment metrics
- 1% rule
- 0.88% ✗
- Cap rate
- 6.35%
- Cash-on-cash
- 0.22%
- DSCR
- 1.01
- GRM
- 9.5
CMA / ARV
No comps found within radius.
Projected returns pro-forma
-1.05% appreciation · 2.95% rent growth · sell at horizon
- IRR
- -8.4%
- Equity multiple
- 0.64×
- Total profit
- $-36,413
- Equity at exit
- $86,065
- IRR
- -1.5%
- Equity multiple
- 0.86×
- Total profit
- $-14,225
- Equity at exit
- $89,667
Cash invested: $100,797 (down + closing). Projections, not guarantees.
Landlord ↔ Tenant lean methodology
- Overall (STATE)
- 87 Strongly Landlord-Friendly
- State Florida
- 87 Strongly Landlord-Friendly · R+3
- County
- — inherits STATE
- City
- — inherits STATE
ZIP-level market 34142
- Home prices YoY
- -0.5%
- Rents YoY
- 3.0%
- Active inventory
- 453
- Price-to-rent
- 9.5×
Monthly cashflow live
- Estimated rent
- $3,173 high interval (Pro) →
- Mortgage (P&I)
- −$1,888
- Tax est. 1.5%
- −$450 /mo · $5,400/yr
- Insurance
- −$150
- Flood insurance flood zone
- −$152 /mo · $1,824/yr
- HOA
- −$0
- Vacancy / Maint / Mgmt
- −$666
- Net cashflow
- $-134
Break-even live
Sensitivity live
| Price | -10% $115 | -5% $-9 | +0% $-134 | +5% $-258 | +10% $-382 |
|---|---|---|---|---|---|
| Rent | -10% $-384 | -5% $-259 | +0% $-134 | +5% $-8 | +10% $117 |
| Rate | -1.0pp $48 | -0.5pp $-42 | base $-134 | +0.5pp $-227 | +1.0pp $-322 |
UW: 25.0% down · 7.5% · 30yr · 1.5% tax · 5.0% vac · 8.0% maint · 8.0% mgmt
Financing live
Cash to close
- Down payment
- $89,998
- Closing costs
- $10,800
- Reserves months
- —
- Total cash needed
- —
Loan-product check · same deal, 3 products live
Conventional
25% down · 7.5% · 30yr
- Down + closing
- —
- Monthly P&I
- —
- Monthly cashflow
- —
- DSCR
- —
- Eligible?
- —
Personal DTI + credit; lowest rate.
DSCR
20% down · 8.5% · 30yr
- Down + closing
- —
- Monthly P&I
- —
- Monthly cashflow
- —
- DSCR
- —
- Eligible?
- —
No personal income docs; deal must DSCR.
Hard money
10% down · 12.0% · 12mo
- Down + closing
- —
- Monthly P&I
- —
- Monthly cashflow
- —
- DSCR
- —
- Eligible?
- —
Short-term bridge; refi at stabilization.
Rent comps 27 comps
| Address | Beds | Baths | Sqft | Rent | $/sqft | DOM | Units | Dist |
|---|---|---|---|---|---|---|---|---|
| 4390 Battlecreek Way Ave Maria, FL | 4.0 | 2.5 | 2060 | $3,295 | $1.60 | 25d | 1 | 0.12mi |
| 5068 Annunciation Cir #4201 Ave Maria, FL | 2.0 | 2.0 | 1266 | $3,400 | $2.69 | 25d | 1 | 0.41mi |
| 5076 Annunciation Cir #2305 Ave Maria, FL | 2.0 | 2.0 | 1166 | $2,800 | $2.40 | 25d | 1 | 0.47mi |
| 5076 Annunciation Cir #2206 Ave Maria, FL | 2.0 | 2.0 | 1206 | $3,100 | $2.57 | 25d | 1 | 0.47mi |
| 5080 Annunciation Cir #1306 Ave Maria, FL | 3.0 | 2.0 | 1700 | $4,500 | $2.65 | 25d | 1 | 0.49mi |
| 4546 Battlecreek Way Ave Maria, FL | 3.0 | 2.5 | 2104 | $3,900 | $1.85 | 25d | 1 | 0.50mi |
| 5032 Arancia Ln Ave Maria, FL | 3.0 | 2.0 | 1525 | $2,595 | $1.70 | 15d | 1 | 0.93mi |
| 5265 Messina St Ave Maria, FL | 3.0 | 2.5 | 1929 | $4,995 | $2.59 | 25d | 1 | 1.03mi |
| 5474 Cassidy Ln Ave Maria, FL | 3.0 | 2.5 | 2032 | $2,650 | $1.30 | 25d | 1 | 1.16mi |
| 5574 Cassidy Ln Ave Maria, FL | 3.0 | 2.0 | 1630 | $2,250 | $1.38 | 23d | 1 | 1.21mi |
| 5573 Cobalto Way Ave Maria, FL | 3.0 | 2.0 | 1921 | $2,400 | $1.25 | 15d | 1 | 1.27mi |
| 5573 Cobalto Way Unit 5573 Ave Maria, FL | 3.0 | 2.0 | 1921 | $2,400 | $1.25 | 15d | 1 | 1.27mi |
| 5374 Ferris Ave Ave Maria, FL | 3.0 | 2.5 | 1933 | $2,350 | $1.22 | 25d | 1 | 1.27mi |
| 5688 Cassidy Ln Ave Maria, FL | 2.0 | 2.0 | 1366 | $2,500 | $1.83 | 15d | 1 | 1.34mi |
| 5360 Brin Way Ave Maria, FL | 4.0 | 2.5 | 1088 | $2,495 | $2.29 | 25d | 1 | 1.34mi |
| 4881 Gambero Way Ave Maria, FL | 3.0 | 2.5 | 2037 | $2,800 | $1.37 | 12d | 1 | 1.34mi |
| 5322 Nevola Ave Ave Maria, FL | 3.0 | 3.0 | 1918 | $2,700 | $1.41 | 15d | 1 | 1.38mi |
| 5716 Cassidy Ln Ave Maria, FL | 3.0 | 2.5 | 1933 | $2,300 | $1.19 | 25d | 1 | 1.38mi |
| 5538 Useppa Dr Ave Maria, FL | 2.0 | 2.5 | 1850 | $10,995 | $5.94 | 25d | 1 | 1.40mi |
| 5657 Agostino Way Ave Maria, FL | 3.0 | 2.5 | 1981 | $2,400 | $1.21 | 15d | 1 | 1.40mi |
| 5661 Agostino Way Ave Maria, FL | 3.0 | 2.5 | 2200 | $2,350 | $1.07 | 15d | 1 | 1.40mi |
| 4925 Gambero Way Ave Maria, FL | 2.0 | 2.0 | 1525 | $4,000 | $2.62 | 25d | 1 | 1.42mi |
| 5309 Beckton Rd Ave Maria, FL | 3.0 | 2.5 | 2051 | $2,395 | $1.17 | 25d | 1 | 1.42mi |
| 5639 Argento Dr Ave Maria, FL | 3.0 | 2.5 | 1400 | $2,500 | $1.79 | 25d | 1 | 1.43mi |
| 4957 Gambero Way Unit 4957 Ave Maria, FL | 4.0 | 3.0 | 1500 | $3,400 | $2.27 | 13d | 1 | 1.47mi |
| 5435 Pikewood Ct Ave Maria, FL | 2.0 | 2.5 | 1850 | $3,695 | $2.00 | 23d | 1 | 1.48mi |
| 5089 Penella Ave Ave Maria, FL | 3.0 | 2.5 | 2028 | $2,300 | $1.13 | 15d | 1 | 1.50mi |
Listing history 13 events
-
2026-06-22days on market $359,990 Active 396 DOM
-
2026-06-18days on market $359,990 Active 393 DOM
-
2026-06-17days on market $359,990 Active 392 DOM
-
2026-06-16days on market $359,990 Active 391 DOM
-
2026-06-15days on market $359,990 Active 390 DOM
-
2026-06-10days on market $359,990 Active 385 DOM
-
2026-06-09days on market $359,990 Active 384 DOM
-
2026-06-08days on market $359,990 Active 383 DOM
-
2026-06-07days on market $359,990 Active 382 DOM
-
2026-06-02days on market $359,990 Active 377 DOM
-
2026-06-01days on market $359,990 Active 376 DOM
-
2026-05-31days on market $359,990 Active 375 DOM
-
2026-05-30days on market $359,990 Active 374 DOM
ⓘ Source: listings_history table (triggers on properties + properties_extension) + one-shot
backfill from property_details.listing_events for pre-trigger history.
Climate risk First Street
- Flood 1/10 Low FEMA zone AH · 0% chance over 30 yrs
- Wildfire 3/10 Moderate
- Heat 9/10 Extreme 7 d/yr ≥111°F today · 27 d/yr by 30 yrs out
- Wind 10/10 Extreme 99% chance of damaging wind over 30 yrs
- Air quality 2/10 Low 0 unhealthy d/yr today · 1 by 30 yrs out
Nearby sold comps map
Loading sold comps map…
Walkable amenities ~0.75 mi
Loading nearby amenities…
Taxation est. · year 1
- Rental income
- $38,070
- − Mortgage interest
- −$20,165
- − Property taxes
- −$5,400
- − Insurance
- −$3,624
- − Repairs & maintenance
- −$3,046
- − Management
- −$3,046
- − Depreciation
- −$10,472
- Taxable loss
- −$7,683
- Est. tax savings @ 24.0%
- +$1,844
- After-tax cash flow
- $241/yr
For passive investors: Depreciation is non-cash, so a rental often shows a tax loss while cash-flowing — sheltering income. Rental losses are passive: they offset passive income freely, and up to $25,000/yr can offset ordinary (W-2) income if you actively participate and your MAGI is under $100k (phasing out to $0 by $150k); unused losses carry forward. On sale, claimed depreciation is recaptured at up to 25%, and gains may owe capital-gains tax (a 1031 exchange can defer both). Figures are a year-1 estimate at your 24.0% rate — not tax advice; consult a CPA.
Schools (NCES district)
- District
- Collier
- NCES district ID
- 1200330
- Math proficiency
- 60% ▼ -4.00%
- Reading proficiency
- 56% ▼ -2.00%
- Median HH income
- $58,275
- Composite
- 50.23/100
- National rank
- #1892
- State rank
- #16 of 73 in FL
Livability — Ave Maria
No livability data for this city. (Only ~50 U.S. cities are tracked.)
Census & demographics
- Census place
- Ave Maria, FL
- County
- Collier County · 396,295 people
- Metro
- Naples-Marco Island, FL
- Population (ZIP)
- 35,149
- Household income
- $62,333
- Rent vs Own
- Severe rent burden
- 1093.0
Population outlook (Collier County) Hauer SSP2
- Today (2025)
- 420,858 people
- By 2030
- 450,054 · +6.9%
- By 2040
- 502,232 · +19.3%
- By 2050
- 544,932 · +29.5%
- By 2075
- 627,203 · +49.0%
- By 2100
- 659,015 · +56.6%
Race, ethnicity, and origin ACS 2023
- Neighborhood character
- Majority Hispanic (63%)
- Race & ethnicity
- Hispanic / Latino 63% Two or more races 39% Black 19% White 16% Native American 7%
- Hispanic origin (detail)
- Mexican 43% Puerto Rican 3% Cuban 2% Dominican 1%
- Common ancestry
- Hispanic 8% Slovak 1% Serbian 1%
- Foreign-born
- 32% · Canada, Jamaica
- Languages at home
- 34% English-only · Spanish 53% French/Haitian/Cajun 12%
Political lean MEDSL · Collier
- 2024 margin
- Solid R (+33.1) · D 33.1% · R 66.2%
- 2008→2024 swing
- -10.6pp toward R · 2008: -22.5pp · 2024: -33.1pp
- All cycles
- 2024: R+33.1 2020: R+24.7 2016: R+26.0 2012: R+30.1 2008: R+22.5
Not yet ingested
- Civics
- —
Market trends
- HPI YoY
- ▼ -1.05%
- Current HPI
- 226.9105
- Rent YoY
- ▲ 2.95%
- Metro
- Naples-Marco Island, FL
- State GDP YoY
- ▲ 3.28%
- F500 in state
- 36
Industry mix (Fortune 500 HQ in FL)
| Industry | F500 HQs | Revenue |
|---|---|---|
| Industrial Technology | 2 | $29B |
|
||
| Insurance | 2 | $17B |
|
||
| Retail | 1 | $60B |
|
||
| Technology Distribution | 1 | $58B |
|
||
| Homebuilding | 1 | $35B |
|
||
| Technology Manufacturing | 1 | $35B |
|
||
Cash-flow waterfall
monthlySold comps — $/sqft
last 12 mo · ≤1 miLoading sold comps…