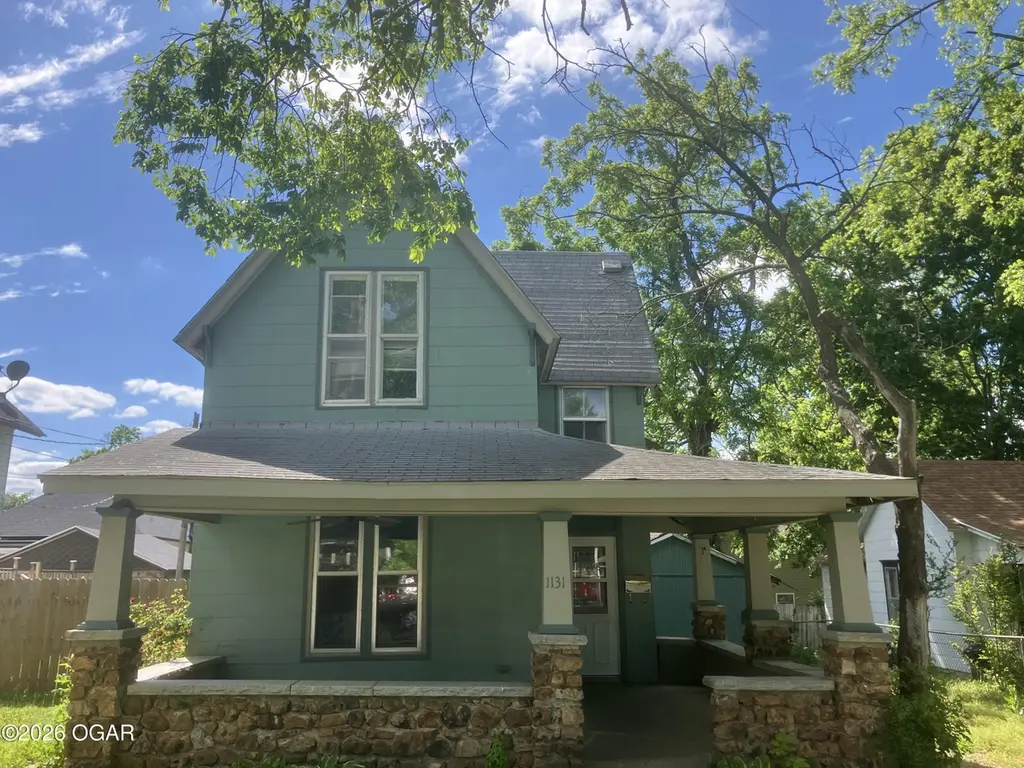
1131 Lyon St · Carthage, MO
Flood risk 1/10 · Minimal
- FEMA flood zone
- X (unshaded)
- Chance of flooding over 30 yrs
- 0.0%
- Est. flood insurance / yr
- $473 – $860
Fire risk 4/10 · Minor
- Est. fire insurance / yr
- $1,054 – $1,958
Heat risk 5/10 · Moderate
- Hot days now (above 107°F)
- 7 days/yr
- Hot days in 30 yrs
- 20 days/yr
Wind risk 2/10 · Minimal
- Chance of severe wind over 30 yrs
- 2.0%
Air-quality risk 2/10 · Minimal
- Unhealthy air days now
- 1 days/yr
- Unhealthy air days in 30 yrs
- 1 days/yr
Risk factors via First Street. Map © Google.
Why this score? — see what drove the C grade
The composite is a weighted blend of 9 inputs, each scored 0–100. Each bar is that input's sub-score; the figure is the points it added to the 100-point composite (weight × sub-score).
- Cash flow +20.0/30.0
- ARV discount +14.4/15.0
- DSCR +6.3/10.0
- 1% rule +4.4/10.0
- Livability +3.5/5.0
- Schools +3.2/10.0
- Rent growth +2.5/5.0
- Condition / age +2.5/5.0
- Appreciation +0.0/10.0
$95,000
🖨 Deal sheet 📄 Offer letter ✓ Due diligence
Listing remarks MLS
2 bedroom 2 bath home centrally located in Carthage MO. In need of a new owner with a vision to bring it back to life. Nice covered porch, formal dining room, . located close to the town square. This property is eligible under the First Look Initiative. All Owner Occupant offers will be responded to after 7 days on the market and Investor offers will be responded to after 30 days. However, all offers can be submitted during the First Look period.
Key facts
- 6,098 sq ft lot
- Garage
- Built 1900
Property features AI
Exterior
- Parking: Detached 1-car garage
- Utilities: Public sewer
- Home design: Single-family residence (freestanding); Residential property
- Construction: Composition roof
- Exterior features: Covered porch/patio
Interior
- Flooring: Carpet; Laminate; Vinyl
- Bathrooms: 2 full bathrooms
- Heating & cooling: Central heating; Cooling present
- Interior features: 6 total rooms; Carpet, laminate and vinyl floors; Central heating and cooling
Neighborhood map
What this means for you Summary
Snapshot
- This is a 2-bed/2.0-bath other listed at $95k.
Deal economics
- At list price, monthly cash flow is $116 ($1k/yr) — positive.
- The deal already cash-flows at list — no discount required.
- To meet the 1% rule (rent ≥ 1% of price), the offer needs to be $89k (6.0% below list).
- Recommended offer: $89k (6.0% below list) — sets the bar for 1% rule.
Location & tenants
- Location reads 70/100 on livability (#131 in MO) — a middle-class / working-renter tenant base. Strengths: cost of living A+, housing A+, health & safety A; Watch: amenities F, commute F, employment F.
- Carthage R-IX (town): math 37% / reading 39% proficiency, ranked #183 of 324 in MO (top 56%) — families likely to look elsewhere, expect single-tenant / working-renter base with shorter leases.
- Zoned schools: Carthage Jr. High (math 38% / reading 41%, grade F, #189 of 391 statewide, top 51%, 752 students, 64% FRL).
- Market conditions: 195 active listings in the ZIP; 1 comparable units currently listed for rent nearby; 602 units permitted in Jasper County in 2024 (0 in 5+ unit buildings).
- This rent is only 17% of the median local income ($61k/yr) — well below the 30% rent-burden line; pricing power to push rent on renewal without tenant pushback.
Forward outlook
- Local home prices are declining (-3.0%/yr); year-one equity from $657 of loan paydown is wiped out by about $3k of value loss. Plan a longer hold.
Negotiation context
- It's been on market 43 days — a 3% lower offer ($92k) is reasonable based on typical stale-listing flexibility.
- 4 sale attempts; this cycle's ask has dropped $5k (5%) from the opening price — seller is motivated, your offer sets the floor, not the list.
Risks & watch-outs
- Watch-outs: built in 1900 — expect roof / HVAC / electrical / plumbing capex.
- Climate carrying-cost: extreme-heat days projected 7→20/yr by 2055 (HVAC capex compounding) — expect insurance premiums to compound above CPI over the hold.
Questions for the listing agent
- It's been on market 43 days. Have you received any prior offers? Is the seller open to a 6% concession, seller financing, or rate buy-down credit?
- Built in 1900 — when were the roof, HVAC, electrical panel, plumbing, and water heater last replaced?
- Is there a deadline driving the sale (1031 exchange, divorce, estate, relocation)? That informs how much negotiation room exists.
- Schools are D-rated, which usually means shorter tenancies and higher turnover. Who's the typical renter profile here, and what's been the actual vacancy rate?
- What's the average days-on-market for RENTAL listings here right now (not sales)? A rising rental-DOM trend means longer vacancies and softer asking-rent achievability than the comps imply.
- What's the recent tenant-quality profile in this submarket — average credit score on applications, eviction rate, late-payment / NSF rate, and stable-employment percentage? A property-management company in the area should have these aggregated.
- How much new for-sale + rental construction is in the pipeline within 1–3 miles? Heavy new supply typically softens prices + rents 12–24 months out; constrained supply supports both.
Investment metrics
- 1% rule
- 0.94% ✗
- Cap rate
- 7.76%
- Cash-on-cash
- 5.22%
- DSCR
- 1.23
- GRM
- 8.9
CMA / ARV
- ARV (median comp)
- $112,143
- List price
- $95,000
- Delta
- -15.29%
- Verdict
- UNDERPRICED
- Comps
- 11 within 1.0 mi
Projected returns pro-forma
-3.0% appreciation · 3.0% rent growth · sell at horizon
- IRR
- -8.2%
- Equity multiple
- 0.70×
- Total profit
- $-8,049
- Equity at exit
- $14,165
- IRR
- 1.3%
- Equity multiple
- 1.09×
- Total profit
- $2,373
- Equity at exit
- $8,214
Cash invested: $26,600 (down + closing). Projections, not guarantees.
Landlord ↔ Tenant lean methodology
- Overall (STATE)
- 81 Strongly Landlord-Friendly
- State Missouri
- 81 Strongly Landlord-Friendly · R+10
- County
- — inherits STATE
- City
- — inherits STATE
ZIP-level market 64836
- Home prices YoY
- -18.2%
- Active inventory
- 195
- Price-to-rent
- 8.9×
Monthly cashflow live
- Estimated rent
- $893 medium interval (Pro) →
- Mortgage (P&I)
- −$498
- Tax from tax record
- −$52 /mo · $626/yr
- Insurance
- −$40
- HOA
- −$0
- Vacancy / Maint / Mgmt
- −$188
- Net cashflow
- $116
Break-even live
UW: 25.0% down · 7.5% · 30yr · 1.5% tax · 5.0% vac · 8.0% maint · 8.0% mgmt
Financing live
Cash to close
- Down payment
- $23,750
- Closing costs
- $2,850
- Reserves months
- —
- Total cash needed
- —
Loan-product check · same deal, 3 products live
Conventional
25% down · 7.5% · 30yr
- Down + closing
- —
- Monthly P&I
- —
- Monthly cashflow
- —
- DSCR
- —
- Eligible?
- —
Personal DTI + credit; lowest rate.
DSCR
20% down · 8.5% · 30yr
- Down + closing
- —
- Monthly P&I
- —
- Monthly cashflow
- —
- DSCR
- —
- Eligible?
- —
No personal income docs; deal must DSCR.
Hard money
10% down · 12.0% · 12mo
- Down + closing
- —
- Monthly P&I
- —
- Monthly cashflow
- —
- DSCR
- —
- Eligible?
- —
Short-term bridge; refi at stabilization.
Rent comps 1 comps
| Address | Beds | Baths | Sqft | Rent | $/sqft | DOM | Units | Dist |
|---|---|---|---|---|---|---|---|---|
| 1735 Hazel Ave Unit 2 Bed, 1 Bath Carthage, MO | 2.0 | 1.0 | 795 | $450 | $0.57 | 21d | 1 | 0.81mi |
Listing history 21 events
-
2026-06-19days on market $95,000 Active 43 DOM
-
2026-06-18days on market $95,000 Active 42 DOM
-
2026-06-17days on market $95,000 Active 41 DOM
-
2026-06-16days on market $95,000 Active 40 DOM
-
2026-06-15days on market $95,000 Active 39 DOM
-
2026-06-14days on market $95,000 Active 37 DOM
-
2026-06-13days on market $95,000 Active 36 DOM
-
2026-06-10pricedays on market $95,000 Active 34 DOM
-
2026-06-09days on market $100,000 Active 33 DOM
Show marketing remark (450 chars)
2 bedroom 2 bath home centrally located in Carthage MO. In need of a new owner with a vision to bring it back to life. Nice covered porch, formal dining room, . located close to the town square. This property is eligible under the First Look Initiative. All Owner Occupant offers will be responded to after 7 days on the market and Investor offers will be responded to after 30 days. However, all offers can be submitted during the First Look period.
-
2026-06-08days on market $100,000 Active 32 DOM
-
2026-06-07days on market $100,000 Active 31 DOM
-
2026-06-05days on market $100,000 Active 28 DOM
-
2026-06-02days on market $100,000 Active 26 DOM
-
2026-06-01days on market $100,000 Active 25 DOM
-
2026-05-31days on market $100,000 Active 24 DOM
-
2026-05-30days on market $100,000 Active 23 DOM
-
2026-05-06$100,000 Active 451-char remark
Show marketing remark (450 chars)
2 bedroom 2 bath home centrally located in Carthage MO. In need of a new owner with a vision to bring it back to life. Nice covered porch, formal dining room, . located close to the town square. This property is eligible under the First Look Initiative. All Owner Occupant offers will be responded to after 7 days on the market and Investor offers will be responded to after 30 days. However, all offers can be submitted during the First Look period.
-
2026-05-06$100,000 Active 450-char remark
Show marketing remark (450 chars)
2 bedroom 2 bath home centrally located in Carthage MO. In need of a new owner with a vision to bring it back to life. Nice covered porch, formal dining room, . located close to the town square. This property is eligible under the First Look Initiative. All Owner Occupant offers will be responded to after 7 days on the market and Investor offers will be responded to after 30 days. However, all offers can be submitted during the First Look period.
-
2025-12-17$110,000 Active
-
2025-10-22$110,000 Active
-
1986-02-25soldstatus
ⓘ Source: listings_history table (triggers on properties + properties_extension) + one-shot
backfill from property_details.listing_events for pre-trigger history.
Tax reassessment forecast MO · Resets to sale price
- Current annual tax
- $626 · $52/mo
- Projected year-2 tax
- $922 · $77/mo
- Expected delta
- +$296/yr (+$25/mo · 47.3%)
ⓘ Screening estimate from a state-policy table — verify with the county assessor before closing.
Climate risk First Street
- Flood 1/10 Low FEMA zone X (unshaded) · 0% chance over 30 yrs
- Wildfire 4/10 Moderate
- Heat 5/10 Major 7 d/yr ≥107°F today · 20 d/yr by 30 yrs out
- Wind 2/10 Low 2% chance of damaging wind over 30 yrs
- Air quality 2/10 Low 1 unhealthy d/yr today · 1 by 30 yrs out
Nearby sold comps map
Loading sold comps map…
Walkable amenities ~0.75 mi
Loading nearby amenities…
Taxation est. · year 1
- Rental income
- $10,719
- − Mortgage interest
- −$5,321
- − Property taxes
- −$626
- − Insurance
- −$475
- − Repairs & maintenance
- −$858
- − Management
- −$858
- − Depreciation
- −$2,764
- Taxable loss
- −$182
- Est. tax savings @ 24.0%
- +$44
- After-tax cash flow
- $1,433/yr
For passive investors: Depreciation is non-cash, so a rental often shows a tax loss while cash-flowing — sheltering income. Rental losses are passive: they offset passive income freely, and up to $25,000/yr can offset ordinary (W-2) income if you actively participate and your MAGI is under $100k (phasing out to $0 by $150k); unused losses carry forward. On sale, claimed depreciation is recaptured at up to 25%, and gains may owe capital-gains tax (a 1031 exchange can defer both). Figures are a year-1 estimate at your 24.0% rate — not tax advice; consult a CPA.
Schools (NCES district)
- District
- Carthage R-IX
- NCES district ID
- 2907460
- Math proficiency
- 37% ▲ 3.00%
- Reading proficiency
- 39% ▲ 1.00%
- Median HH income
- $39,696
- Composite
- 31.85/100
- National rank
- #5874
- State rank
- #183 of 324 in MO
Livability — Carthage
- Score
- 70/100
- State rank
- #131
- US rank
- #7646
Category grades
Schools grade is shown separately in the Schools card above.
Census & demographics
- Census place
- Carthage, MO
- County
- Jasper County · 79,035 people
- City population
- 26,562
- Metro
- Joplin, MO
- Population (ZIP)
- 26,562
- Household income
- $61,335
- Rent vs Own
- Severe rent burden
- 800.0
Population outlook (Jasper County) Hauer SSP2
- Today (2025)
- 120,033 people
- By 2030
- 120,091 · +0.0%
- By 2040
- 119,297 · -0.6%
- By 2050
- 117,705 · -1.9%
- By 2075
- 110,402 · -8.0%
- By 2100
- 99,719 · -16.9%
Race, ethnicity, and origin ACS 2023
- Neighborhood character
- Predominantly White (68%)
- Race & ethnicity
- White 68% Hispanic / Latino 25% Two or more races 10% Black 1%
- Hispanic origin (detail)
- Mexican 7%
- Common ancestry
- Slovak 2% Serbian 1% Lithuanian 1%
- Foreign-born
- 10% · Canada
- Languages at home
- 82% English-only · Spanish 18%
Political lean MEDSL · Jasper
- 2024 margin
- Solid R (+46.8) · D 25.9% · R 72.7% · Other 1.4%
- 2008→2024 swing
- -13.6pp toward R · 2008: -33.2pp · 2024: -46.8pp
- All cycles
- 2024: R+46.8 2020: R+46.2 2016: R+50.8 2012: R+41.0 2008: R+33.2
Not yet ingested
- Civics
- —
Market trends
- HPI YoY
- ▼ -55.61%
- Current HPI
- 250.499
- Rent YoY
- —
- Metro
- Joplin, MO
- State GDP YoY
- ▲ 1.84%
- F500 in state
- 20
Industry mix (Fortune 500 HQ in MO)
| Industry | F500 HQs | Revenue |
|---|---|---|
| Healthcare | 1 | $163B |
|
||
| Insurance | 1 | $21B |
|
||
| Industrial Technology | 1 | $17B |
|
||
| Retail | 1 | $16B |
|
||
| Industrial Distribution | 1 | $10B |
|
||
| Utilities | 1 | $9B |
|
||
Price history
-13.6% since first listed7 events — show timeline
- 2026-06-09 Price Changed $95,000 SOMO
- 2026-06-09 Price Changed $95,000 OGAR
- 2026-05-06 Listed $100,000 OGAR
- 2026-05-06 Listed $100,000 SOMO
- 2025-12-17 Listed $110,000 SOMO
- 2025-10-22 Listed $110,000 SOMO
- 1986-02-25 Sold (Public Records) — Public Records
Property tax history
+3.4%/yrLatest (2025): $626 · +23.9% YoY. Source: county tax records.
Cash-flow waterfall
monthlySold comps — $/sqft
last 12 mo · ≤1 miLoading sold comps…