526 Dolores St · Taft Southwest, TX
Flood risk 7/10 · Major
- FEMA flood zone
- X (unshaded)
- Chance of flooding over 30 yrs
- 0.99%
- Est. flood insurance / yr
- $507 – $1,088
Fire risk 1/10 · Minimal
- Est. fire insurance / yr
- $1,222 – $2,270
Heat risk 10/10 · Severe
- Hot days now (above 108°F)
- 7 days/yr
- Hot days in 30 yrs
- 25 days/yr
Wind risk 9/10 · Severe
- Chance of severe wind over 30 yrs
- 99.0%
Air-quality risk 1/10 · Minimal
- Unhealthy air days now
- 0 days/yr
- Unhealthy air days in 30 yrs
- 0 days/yr
Risk factors via First Street. Map © Google.
Why this score? — see what drove the A- grade
The composite is a weighted blend of 9 inputs, each scored 0–100. Each bar is that input's sub-score; the figure is the points it added to the 100-point composite (weight × sub-score).
- Cash flow +30.0/30.0
- ARV discount +15.0/15.0
- 1% rule +10.0/10.0
- DSCR +10.0/10.0
- Appreciation +7.2/10.0
- Livability +2.8/5.0
- Rent growth +2.5/5.0
- Condition / age +2.5/5.0
- Schools +2.0/10.0
$69,000
🖨 Deal sheet (PDF) 📄 Offer letter ✓ Due diligence
Listing remarks MLS
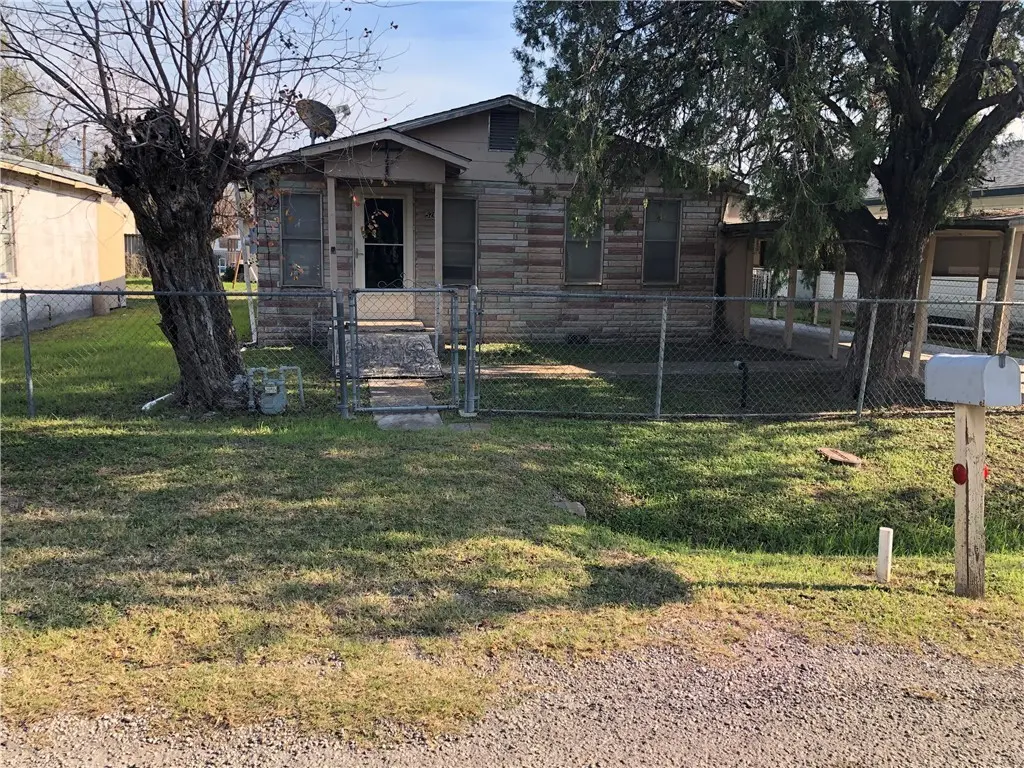
Looking for your next investment opportunity? Take a look at this property located in Taft, TX. Not one but TWO properties at ONE great price! The main home features three bedrooms, one bath, a covered parking area, with a large backyard! 526 1/2 is a property all its own with its own unique potential. Call me or your favorite realtor to schedule a showing today.
Key facts
- Large backyard
- Covered parking area
- Unique potential
Tags
Neighborhood map
What this means for you Summary
Snapshot
- This is a 3-bed/1.0-bath single-family listed at $69k.
Deal economics
- At list price, monthly cash flow is $449 ($5k/yr) — positive.
- The deal already cash-flows at list — no discount required.
- Meets the 1% rule at list price ($1k rent vs $69k).
- Recommended offer: $61k (12.0% below list) — sets the bar for market timing.
Location & tenants
- Location reads 56/100 on livability (#1,311 in TX) — a working-class tenant base; expect higher turnover. Strengths: cost of living A+, housing A, crime B+; Watch: amenities F, commute F, employment F.
- Taft ISD (town): math 24% / reading 24% proficiency, ranked #727 of 826 in TX (top 88%) — low school quality limits family demand, transient renter base, plan for 1-2y turnover; 77% free/reduced lunch — lower-income household profile, screen leases tightly.
- Zoned schools: Woodroe Petty El (math 18% / reading 22%, grade F, #3,536 of 4,322 statewide, top 83%, 381 students, 92% FRL); Ricardo L Trevino J H (math 28% / reading 26%, grade F, #1,177 of 1,662 statewide, top 72%, 199 students, 90% FRL); Taft H S (math 27% / reading 27%, grade F, #1,204 of 1,632 statewide, top 75%, 242 students, 80% FRL).
- Market conditions: 61 active listings in the ZIP; 2 comparable units currently listed for rent nearby; 344 units permitted in San Patricio County in 2024 (0 in 5+ unit buildings).
Forward outlook
- In year one you build about $4k of equity ($477 loan paydown + $3k appreciation (4.4% local appreciation)).
- San Patricio County population projected at +27% by 2050 — long-run rental-demand tailwind backs the buy-and-hold thesis.
- At projected returns (4.4% appreciation + 3.0% rent growth), your $19k cash investment doubles in ~3 years — after that, you're playing with house money.
- By year 9, paydown + projected appreciation supports a ~$31k cash-out refi (75% LTV) — recoverable capital for the next deal without selling this one.
Negotiation context
- It's been on market 148 days — a 12% lower offer ($61k) is reasonable based on typical stale-listing flexibility.
Risks & watch-outs
- Watch-outs: flood insurance adds $66/mo; built in 1949 — expect roof / HVAC / electrical / plumbing capex.
- Climate carrying-cost: major flood risk; severe wind risk, 99% chance of damaging wind over 30y; extreme-heat days projected 7→25/yr by 2055 (HVAC capex compounding) — expect insurance premiums to compound above CPI over the hold.
Questions for the listing agent
- It's been on market 148 days. Have you received any prior offers? Is the seller open to a 12% concession, seller financing, or rate buy-down credit?
- Built in 1949 — when were the roof, HVAC, electrical panel, plumbing, and water heater last replaced?
- What's the actual annual flood-insurance premium (NFIP or private), and is the property in a SFHA with mandatory coverage?
- Why hasn't it sold? Are there any deal-killer items the seller is aware of (foundation, flood, title, zoning, code violations)?
- Is there a deadline driving the sale (1031 exchange, divorce, estate, relocation)? That informs how much negotiation room exists.
- Schools are F-rated, which usually means shorter tenancies and higher turnover. Who's the typical renter profile here, and what's been the actual vacancy rate?
- What's the average days-on-market for RENTAL listings here right now (not sales)? A rising rental-DOM trend means longer vacancies and softer asking-rent achievability than the comps imply.
- What's the recent tenant-quality profile in this submarket — average credit score on applications, eviction rate, late-payment / NSF rate, and stable-employment percentage? A property-management company in the area should have these aggregated.
- How much new for-sale + rental construction is in the pipeline within 1–3 miles? Heavy new supply typically softens prices + rents 12–24 months out; constrained supply supports both.
Investment metrics
- 1% rule
- 1.86% ✓
- Cap rate
- 15.26%
- Cash-on-cash
- 32.02%
- DSCR
- 2.42
- GRM
- 4.5
CMA / ARV
- ARV (median comp)
- $110,734
- List price
- $69,000
- Delta
- -37.69%
- Verdict
- UNDERPRICED
- Comps
- 18 within 1.0 mi
Show comp detail 3 sales within ~0.75 mi
| Address | Dist | Beds/Ba | Sqft | Sold | Price | $/sf | Match |
|---|---|---|---|---|---|---|---|
| 510 Blanco | 0.46mi | 3/1.0 | 910 (+4%) | 3mo | $67,000 | $74 | 70 |
| 665 Davis | 0.21mi | 3/1.0 | 768 (-12%) | 9mo | $50,000 | $65 | 63 |
| 209 Algodon St | 0.17mi | 2/1.0 (-1) | 750 (-14%) | 9mo | $60,000 | $80 | 56 |
Match score weights: distance 35% · size 25% · config 20% · recency 20%. Top-matched comps best support the ARV.
Projected returns pro-forma
4.44% appreciation · 3.0% rent growth · sell at horizon
- IRR
- 36.4%
- Equity multiple
- 3.19×
- Total profit
- $42,384
- Equity at exit
- $36,763
- IRR
- 35.2%
- Equity multiple
- 6.42×
- Total profit
- $104,657
- Equity at exit
- $61,593
Cash invested: $19,320 (down + closing). Projections, not guarantees.
Landlord ↔ Tenant lean methodology
- Overall (STATE)
- 87 Strongly Landlord-Friendly
- State Texas
- 87 Strongly Landlord-Friendly · R+5
- County
- — inherits STATE
- City
- — inherits STATE
ZIP-level market 78390
- Home prices YoY
- 3.7%
- Active inventory
- 61
- Price-to-rent
- 4.5×
Monthly cashflow live
- Estimated rent
- $1,283 medium interval (Pro) →
- Mortgage (P&I)
- −$362
- Tax from tax record
- −$107 /mo · $1,288/yr
- Insurance
- −$29
- Flood insurance flood zone
- −$66 /mo · $798/yr
- HOA
- −$0
- Vacancy / Maint / Mgmt
- −$269
- Net cashflow
- $449
Break-even live
Sensitivity live
| Price | -10% $488 | -5% $469 | +0% $449 | +5% $430 | +10% $410 |
|---|---|---|---|---|---|
| Rent | -10% $348 | -5% $398 | +0% $449 | +5% $500 | +10% $550 |
| Rate | -1.0pp $484 | -0.5pp $467 | base $449 | +0.5pp $431 | +1.0pp $413 |
UW: 25.0% down · 7.5% · 30yr · 1.5% tax · 5.0% vac · 8.0% maint · 8.0% mgmt
Financing live
Cash to close
- Down payment
- $17,250
- Closing costs
- $2,070
- Reserves months
- —
- Total cash needed
- —
Loan-product check · same deal, 3 products live
Conventional
25% down · 7.5% · 30yr
- Down + closing
- —
- Monthly P&I
- —
- Monthly cashflow
- —
- DSCR
- —
- Eligible?
- —
Personal DTI + credit; lowest rate.
DSCR
20% down · 8.5% · 30yr
- Down + closing
- —
- Monthly P&I
- —
- Monthly cashflow
- —
- DSCR
- —
- Eligible?
- —
No personal income docs; deal must DSCR.
Hard money
10% down · 12.0% · 12mo
- Down + closing
- —
- Monthly P&I
- —
- Monthly cashflow
- —
- DSCR
- —
- Eligible?
- —
Short-term bridge; refi at stabilization.
Rent comps 2 comps
| Address | Beds | Baths | Sqft | Rent | $/sqft | DOM | Units | Dist |
|---|---|---|---|---|---|---|---|---|
| 921 Oak St Taft, TX | 2.0 | 1.0 | 857 | $1,400 | $1.63 | 15d | 1 | 0.98mi |
| 508 Tutt Ave Taft, TX | 2.0 | 1.0 | 936 | $1,150 | $1.23 | 45d | 1 | 1.06mi |
Listing history 18 events
-
2026-06-22days on market $69,000 Active 148 DOM
-
2026-06-18days on market $69,000 Active 145 DOM
-
2026-06-17days on market $69,000 Active 144 DOM
-
2026-06-16days on market $69,000 Active 143 DOM
-
2026-06-15days on market $69,000 Active 142 DOM
-
2026-06-14days on market $69,000 Active 140 DOM
-
2026-06-13days on market $69,000 Active 139 DOM
-
2026-06-10days on market $69,000 Active 137 DOM
-
2026-06-09days on market $69,000 Active 136 DOM
-
2026-06-08days on market $69,000 Active 135 DOM
-
2026-06-07days on market $69,000 Active 134 DOM
-
2026-06-05days on market $69,000 Active 131 DOM
-
2026-06-03days on market $69,000 Active 130 DOM
-
2026-06-02days on market $69,000 Active 129 DOM
-
2026-06-01days on market $69,000 Active 128 DOM
-
2026-05-31days on market $69,000 Active 127 DOM
-
2026-05-30days on market $69,000 Active 126 DOM
-
2026-01-22$69,000 Active 366-char remark
Show marketing remark (366 chars)
Looking for your next investment opportunity? Take a look at this property located in Taft, TX. Not one but TWO properties at ONE great price! The main home features three bedrooms, one bath, a covered parking area, with a large backyard! 526 1/2 is a property all its own with its own unique potential. Call me or your favorite realtor to schedule a showing today.
ⓘ Source: listings_history table (triggers on properties + properties_extension) + one-shot
backfill from property_details.listing_events for pre-trigger history.
Tax reassessment forecast TX · Resets to sale price
- Current annual tax
- $1,288 · $107/mo
- Projected year-2 tax
- $1,288 · $107/mo
- Expected delta
- $0/yr ($0/mo · 0.0%)
ⓘ Screening estimate from a state-policy table — verify with the county assessor before closing.
Climate risk First Street
- Flood 7/10 Severe FEMA zone X (unshaded) · 99% chance over 30 yrs
- Wildfire 1/10 Low
- Heat 10/10 Extreme 7 d/yr ≥108°F today · 25 d/yr by 30 yrs out
- Wind 9/10 Extreme 99% chance of damaging wind over 30 yrs
- Air quality 1/10 Low 0 unhealthy d/yr today · 0 by 30 yrs out
Nearby sold comps map
Loading sold comps map…
Walkable amenities ~0.75 mi
Loading nearby amenities…
Taxation est. · year 1
- Rental income
- $15,395
- − Mortgage interest
- −$3,865
- − Property taxes
- −$1,288
- − Insurance
- −$1,142
- − Repairs & maintenance
- −$1,232
- − Management
- −$1,232
- − Depreciation
- −$2,007
- Taxable income
- $4,629
- Est. tax owed @ 24.0%
- −$1,111
- After-tax cash flow
- $4,279/yr
For passive investors: Depreciation is non-cash, so a rental often shows a tax loss while cash-flowing — sheltering income. Rental losses are passive: they offset passive income freely, and up to $25,000/yr can offset ordinary (W-2) income if you actively participate and your MAGI is under $100k (phasing out to $0 by $150k); unused losses carry forward. On sale, claimed depreciation is recaptured at up to 25%, and gains may owe capital-gains tax (a 1031 exchange can defer both). Figures are a year-1 estimate at your 24.0% rate — not tax advice; consult a CPA.
Schools (NCES district)
- District
- Taft ISD
- NCES district ID
- 4842060
- Math proficiency
- 24% ▼ -6.00%
- Reading proficiency
- 24% ▲ 2.00%
- Median HH income
- $40,110
- Composite
- 20.29/100
- National rank
- #8618
- State rank
- #727 of 826 in TX
Livability — Taft Southwest
- Score
- 56/100
- State rank
- #1311
- US rank
- #22671
Category grades
Schools grade is shown separately in the Schools card above.
Census & demographics
- Census place
- Taft Southwest, TX
- Population (ZIP)
- 5,620
Population outlook (San Patricio County) Hauer SSP2
- Today (2025)
- 75,538 people
- By 2030
- 79,575 · +5.3%
- By 2040
- 87,670 · +16.1%
- By 2050
- 96,107 · +27.2%
- By 2075
- 117,984 · +56.2%
- By 2100
- 130,010 · +72.1%
Race, ethnicity, and origin ACS 2023
- Neighborhood character
- Predominantly Hispanic (78%)
- Race & ethnicity
- Hispanic / Latino 78% Two or more races 52% White 21%
- Hispanic origin (detail)
- Mexican 75%
- Common ancestry
- Slovak 1% Lithuanian 1%
- Foreign-born
- 3% · Canada
- Languages at home
- 61% English-only · Spanish 39%
Political lean MEDSL · San Patricio
- 2024 margin
- Solid R (+36.4) · D 31.4% · R 67.8%
- 2008→2024 swing
- -19.8pp toward R · 2008: -16.6pp · 2024: -36.4pp
- All cycles
- 2024: R+36.4 2020: R+29.1 2016: R+24.1 2012: R+20.6 2008: R+16.6
Not yet ingested
- Civics
- —
Market trends
- HPI YoY
- ▲ 4.44%
- Current HPI
- 123.4461
- Rent YoY
- —
- Metro
- —
- State GDP YoY
- ▲ 3.95%
- F500 in state
- 110
Industry mix (Fortune 500 HQ in TX)
| Industry | F500 HQs | Revenue |
|---|---|---|
| Energy | 16 | $1,198B |
|
||
| Technology | 5 | $198B |
|
||
| Engineering / Construction | 4 | $72B |
|
||
| Energy Services | 3 | $60B |
|
||
| Utilities | 3 | $41B |
|
||
| Healthcare | 2 | $330B |
|
||
Price history
1 event — show timeline
- 2026-01-22 Listed $69,000 CBMLS
Property tax history
+3.8%/yrLatest (2025): $1,288 · +9.2% YoY. Source: county tax records.
Cash-flow waterfall
monthlySold comps — $/sqft
last 12 mo · ≤1 miLoading sold comps…