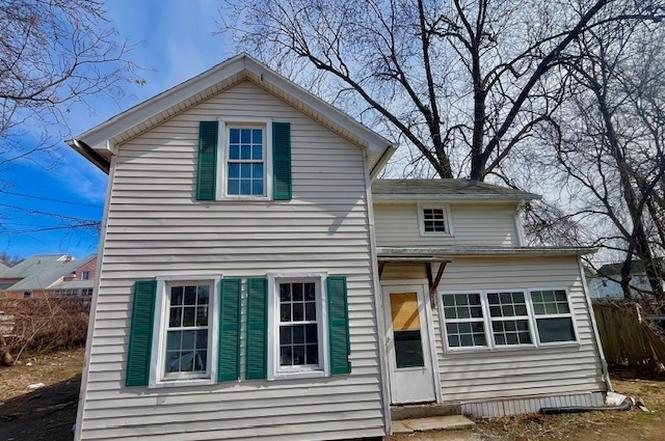
161 Washington St · New Britain, CT
Flood risk 1/10 · Minimal
- FEMA flood zone
- X (unshaded)
- Chance of flooding over 30 yrs
- 0.0%
- Est. flood insurance / yr
- $507 – $1,088
Fire risk 1/10 · Minimal
- Est. fire insurance / yr
- $829 – $1,539
Heat risk 5/10 · Moderate
- Hot days now (above 97°F)
- 7 days/yr
- Hot days in 30 yrs
- 15 days/yr
Wind risk 6/10 · Moderate
- Chance of severe wind over 30 yrs
- 27.0%
Air-quality risk 3/10 · Minor
- Unhealthy air days now
- 2 days/yr
- Unhealthy air days in 30 yrs
- 3 days/yr
Risk factors via First Street. Map © Google.
Why this score? — see what drove the C grade
The composite is a weighted blend of 9 inputs, each scored 0–100. Each bar is that input's sub-score; the figure is the points it added to the 100-point composite (weight × sub-score).
- Cash flow +18.3/30.0
- Appreciation +10.0/10.0
- ARV discount +7.5/15.0
- DSCR +5.7/10.0
- 1% rule +4.9/10.0
- Livability +3.7/5.0
- Condition / age +2.5/5.0
- Rent growth +2.4/5.0
- Schools +1.0/10.0
$171,600
🖨 Deal sheet 📄 Offer letter ✓ Due diligence
Listing remarks MLS
This property consists of a large three family with two three bedroom units andone two bedroom unit a single family house and a brick store front that is occupied by a church great cash flow
Key facts
- 0.25 acre lot
- Built 1919
- Listed 82 days
Property features AI
Exterior
- Utilities: Public water connected; Public sewer connected; Natural gas available
- Home design: Single-family home
- Construction: Frame construction; Concrete foundation
- Exterior features: Level lot; Vinyl siding; Asphalt shingle roof
Interior
- Bedrooms: 3 bedrooms
- Bathrooms: 1 full bathroom
- Heating & cooling: Baseboard heat; Hot water: Natural gas and electric
- Interior features: Full basement with hatchway; 6 total rooms
Neighborhood map
What this means for you Summary
Snapshot
- This is a 3-bed/1.0-bath other listed at $172k.
Deal economics
- At list price, monthly cash flow is $156 ($2k/yr) — positive.
- The deal already cash-flows at list — no discount required.
- To meet the 1% rule (rent ≥ 1% of price), the offer needs to be $170k (1.0% below list).
- Recommended offer: $161k (6.0% below list) — sets the bar for market timing.
- Cap rate 7.4% vs local median 4.4% in New Britain — top-decile yield for the area; either an underpriced asset or a hidden risk that comps aren't pricing in. Stress-test before assuming the spread holds.
Location & tenants
- Location reads 74/100 on livability (#67 in CT, #4,936 nationally) — a middle-class / working-renter tenant base. Strengths: health & safety A+, cost of living A, housing A; Watch: crime D, employment D, schools F.
- New Britain School District (suburban): math 6% / reading 17% proficiency, ranked #153 of 153 in CT (top 100%) — low school quality limits family demand, transient renter base, plan for 1-2y turnover; 71% free/reduced lunch — lower-income household profile, screen leases tightly.
- Market conditions: Rents soft (-0.6%/yr); 63 active listings in the ZIP; 40 comparable units currently listed for rent nearby; rentals at typical pace (median 24d on market — plan ~3-4 weeks tenant-placement turnaround); 1,867 units permitted in Capitol Planning Region in 2024 (1,399 in 5+ unit buildings).
- This rent runs 40% of the median local income ($51k/yr) — at the standard rent-burdened threshold; future hikes will face affordability resistance.
Forward outlook
- In year one you build about $18k of equity ($1k loan paydown + $17k appreciation (10.0% local appreciation)).
- At projected returns (10.0% appreciation + 0.0% rent growth), your $48k cash investment doubles in ~3 years — after that, you're playing with house money.
- By year 3, paydown + projected appreciation supports a ~$46k cash-out refi (75% LTV) — recoverable capital for the next deal without selling this one.
Negotiation context
- It's been on market 82 days — a 6% lower offer ($161k) is reasonable based on typical stale-listing flexibility.
- 2 sale attempts since 26y ago with the ask held roughly flat each time — persistent listings suggest the price (not the market) is what's stuck; bring a comps-based counter.
Risks & watch-outs
- Watch-outs: built in 1919 — expect roof / HVAC / electrical / plumbing capex.
- Climate carrying-cost: major wind risk, 27% chance of damaging wind over 30y; extreme-heat days projected 7→15/yr by 2055 (HVAC capex compounding) — expect insurance premiums to compound above CPI over the hold.
Questions for the listing agent
- It's been on market 82 days. Have you received any prior offers? Is the seller open to a 6% concession, seller financing, or rate buy-down credit?
- Built in 1919 — when were the roof, HVAC, electrical panel, plumbing, and water heater last replaced?
- Why hasn't it sold? Are there any deal-killer items the seller is aware of (foundation, flood, title, zoning, code violations)?
- Is there a deadline driving the sale (1031 exchange, divorce, estate, relocation)? That informs how much negotiation room exists.
- Schools are F-rated, which usually means shorter tenancies and higher turnover. Who's the typical renter profile here, and what's been the actual vacancy rate?
- Crime grade is D in this area — have there been break-ins, vandalism, or insurance claims at this property in the last 3 years? What carrier currently insures it and at what premium?
- What's the average days-on-market for RENTAL listings here right now (not sales)? A rising rental-DOM trend means longer vacancies and softer asking-rent achievability than the comps imply.
- What's the recent tenant-quality profile in this submarket — average credit score on applications, eviction rate, late-payment / NSF rate, and stable-employment percentage? A property-management company in the area should have these aggregated.
- How much new for-sale + rental construction is in the pipeline within 1–3 miles? Heavy new supply typically softens prices + rents 12–24 months out; constrained supply supports both.
Investment metrics
- 1% rule
- 0.99% ✗
- Cap rate
- 7.38%
- Cash-on-cash
- 3.90%
- DSCR
- 1.17
- GRM
- 8.4
CMA / ARV
No comps found within radius.
Projected returns pro-forma
10.0% appreciation · 0.0% rent growth · sell at horizon
- IRR
- 26.0%
- Equity multiple
- 3.05×
- Total profit
- $98,445
- Equity at exit
- $154,591
- IRR
- 22.1%
- Equity multiple
- 6.69×
- Total profit
- $273,225
- Equity at exit
- $333,381
Cash invested: $48,048 (down + closing). Projections, not guarantees.
Landlord ↔ Tenant lean methodology
- Overall (STATE)
- 27 Tenant-Leaning
- State Connecticut
- 27 Tenant-Leaning · D+7
- County
- — inherits STATE
- City
- — inherits STATE
ZIP-level market 06051
- Home prices YoY
- 9.0%
- Rents YoY
- -0.6%
- Active inventory
- 63
- Price-to-rent
- 8.4×
Monthly cashflow live
- Estimated rent
- $1,699 high interval (Pro) →
- Mortgage (P&I)
- −$900
- Tax est. 1.5%
- −$214 /mo · $2,574/yr
- Insurance
- −$72
- HOA
- −$0
- Vacancy / Maint / Mgmt
- −$357
- Net cashflow
- $156
Break-even live
UW: 25.0% down · 7.5% · 30yr · 1.5% tax · 5.0% vac · 8.0% maint · 8.0% mgmt
Financing live
Cash to close
- Down payment
- $42,900
- Closing costs
- $5,148
- Reserves months
- —
- Total cash needed
- —
Loan-product check · same deal, 3 products live
Conventional
25% down · 7.5% · 30yr
- Down + closing
- —
- Monthly P&I
- —
- Monthly cashflow
- —
- DSCR
- —
- Eligible?
- —
Personal DTI + credit; lowest rate.
DSCR
20% down · 8.5% · 30yr
- Down + closing
- —
- Monthly P&I
- —
- Monthly cashflow
- —
- DSCR
- —
- Eligible?
- —
No personal income docs; deal must DSCR.
Hard money
10% down · 12.0% · 12mo
- Down + closing
- —
- Monthly P&I
- —
- Monthly cashflow
- —
- DSCR
- —
- Eligible?
- —
Short-term bridge; refi at stabilization.
Rent comps 40 comps
| Address | Beds | Baths | Sqft | Rent | $/sqft | DOM | Units | Dist |
|---|---|---|---|---|---|---|---|---|
| 182 Washington St Unit 182-A New Britain, CT | 3.0 | 1.0 | 1300 | $1,700 | $1.31 | 23d | 1 | 0.07mi |
| 182 Washington St Unit 3S New Britain, CT | 3.0 | 1.0 | 1300 | $1,650 | $1.27 | 23d | 1 | 0.07mi |
| 100 Broad St Unit 3E New Britain, CT | 3.0 | 1.0 | 915 | $1,750 | $1.91 | 43d | 1 | 0.18mi |
| 109 Grove St Unit 3S New Britain, CT | 2.0 | 1.0 | 724 | $1,650 | $2.28 | 43d | 1 | 0.18mi |
| 102 Grove St New Britain, CT | 2.0 | 1.0 | 950 | $1,300 | $1.37 | 43d | 1 | 0.20mi |
| 28 Sexton St Unit 3N New Britain, CT | 2.0 | 1.0 | 1000 | $1,775 | $1.77 | 21d | 1 | 0.22mi |
| 10 Union St Unit 2L New Britain, CT | 2.0 | 1.0 | 988 | $1,600 | $1.62 | 43d | 1 | 0.26mi |
| 10 Union St Unit 3R New Britain, CT | 2.0 | 1.0 | 988 | $1,600 | $1.62 | 11d | 1 | 0.26mi |
| 70 Sexton St Unit 2S New Britain, CT | 2.0 | 1.0 | 1300 | $1,375 | $1.06 | 2d | 1 | 0.29mi |
| 99 W Main St New Britain, CT | 2.0 | 1.0 | 850 | $1,500 | $1.76 | 16d | 1 | 0.31mi |
| 174 Broad St New Britain, CT | 2.0 | 1.0 | 915 | $1,350 | $1.48 | 43d | 1 | 0.32mi |
| 144 Clark St New Britain, CT | 3.0 | 1.0 | 957 | $1,700 | $1.78 | 43d | 1 | 0.32mi |
| 144 Clark St New Britain, CT | 3.0 | 1.0 | 1000 | $1,700 | $1.70 | 19d | 1 | 0.32mi |
| 13 Bartlett St Unit 2nd Floor New Britain, CT | 4.0 | 1.0 | 1100 | $2,500 | $2.27 | 19d | 1 | 0.34mi |
| 49 Lawlor St Unit 1N New Britain, CT | 2.0 | 1.0 | 1000 | $1,600 | $1.60 | 23d | 1 | 0.36mi |
| 49 Lawlor St Unit 3N New Britain, CT | 2.0 | 1.0 | 850 | $1,549 | $1.82 | 23d | 1 | 0.36mi |
| 335 High St New Britain, CT | 2.0 | 1.0 | 825 | $1,550 | $1.88 | 16d | 2 | 0.37mi |
| 335 High St Unit 2N New Britain, CT | 2.0 | 1.0 | 800 | $1,550 | $1.94 | 23d | 1 | 0.37mi |
| 26 Cedar St Unit 1st Floor New Britain, CT | 2.0 | 1.0 | 1000 | $1,650 | $1.65 | 43d | 1 | 0.39mi |
| 88 Silver St Unit 3N New Britain, CT | 2.0 | 1.0 | 900 | $1,700 | $1.89 | 19d | 1 | 0.40mi |
| 160 Main St New Britain, CT | 1.0–2.0 | 1.0 | 850 | $1,950 | $2.29 | 1d | 2 | 0.41mi |
| 60 Booth St Unit 3S New Britain, CT | 2.0 | 1.0 | 1000 | $1,400 | $1.40 | 23d | 1 | 0.43mi |
| 93 Tremont St New Britain, CT | 3.0 | 1.0 | 961 | $1,900 | $1.98 | 19d | 1 | 0.44mi |
| 24 Oak St Unit 2 New Britain, CT | 3.0 | 1.0 | 1300 | $1,607 | $1.24 | 16d | 1 | 0.49mi |
| 19 Oak St Unit 2 New Britain, CT | 2.0 | 1.0 | 1020 | $1,300 | $1.27 | 43d | 1 | 0.51mi |
| 45 Curtin St Fl 2 New Britain, CT | 2.0 | 1.0 | 1100 | $1,550 | $1.41 | 3d | 1 | 0.51mi |
| 164 Curtis St Unit 2F New Britain, CT | 2.0 | 1.0 | 800 | $1,700 | $2.12 | 16d | 1 | 0.51mi |
| 145 Smith St Unit 1 New Britain, CT | 2.0 | 1.0 | 1114 | $1,900 | $1.71 | 43d | 1 | 0.53mi |
| 22 Wilcox St Unit 3N New Britain, CT | 2.0 | 1.0 | 1000 | $1,600 | $1.60 | 23d | 1 | 0.53mi |
| 22 Wilcox St Unit 3N New Britain, CT | 2.0 | 1.0 | 725 | $1,700 | $2.34 | 43d | 1 | 0.53mi |
| 14 Crown St Unit 2W New Britain, CT | 2.0 | 1.0 | 1150 | $1,650 | $1.43 | 23d | 1 | 0.54mi |
| 24 Miller St Unit 2 New Britain, CT | 2.0 | 1.0 | 1100 | $1,850 | $1.68 | 14d | 1 | 0.54mi |
| 329 Broad St Unit 1 New Britain, CT | 2.0 | 1.0 | 948 | $1,600 | $1.69 | 43d | 1 | 0.61mi |
| 116 Miller St New Britain, CT | 2.0 | 1.0 | 950 | $1,600 | $1.68 | 43d | 1 | 0.62mi |
| 152 Oak St Unit 3S New Britain, CT | 3.0 | 1.0 | 878 | $1,700 | $1.94 | 21d | 1 | 0.62mi |
| 152 Oak St Unit 1S New Britain, CT | 2.0 | 1.0 | 745 | $1,600 | $2.15 | 21d | 1 | 0.62mi |
| 94 Glen St New Britain, CT | 3.0 | 1.0 | 1200 | $1,595 | $1.33 | 14d | 1 | 0.68mi |
| 61 Albany Ave Unit 3 New Britain, CT | 2.0 | 1.0 | 1100 | $1,550 | $1.41 | 3d | 1 | 0.69mi |
| 23 Alden St New Britain, CT | 2.0 | 1.0 | 1092 | $1,650 | $1.51 | 2d | 1 | 0.71mi |
| 371 Broad St Unit 1st Floor New Britain, CT | 3.0 | 1.0 | 1128 | $1,900 | $1.68 | 43d | 1 | 0.72mi |
Listing history 20 events
-
2026-06-15status $171,600 Under Contract 82 DOM
-
2026-06-15days on market $171,600 Under Contract - Continue to Show 82 DOM
-
2026-06-13days on market $171,600 Under Contract - Continue to Show 80 DOM
-
2026-06-13days on market $171,600 Under Contract - Continue to Show 79 DOM
-
2026-06-10days on market $171,600 Under Contract - Continue to Show 77 DOM
-
2026-06-09days on market $171,600 Under Contract - Continue to Show 76 DOM
-
2026-06-08days on market $171,600 Under Contract - Continue to Show 75 DOM
-
2026-06-07days on market $171,600 Under Contract - Continue to Show 74 DOM
-
2026-06-05days on market $171,600 Under Contract - Continue to Show 71 DOM
-
2026-06-03days on market $171,600 Under Contract - Continue to Show 70 DOM
-
2026-06-02days on market $171,600 Under Contract - Continue to Show 69 DOM
-
2026-06-01days on market $171,600 Under Contract - Continue to Show 68 DOM
-
2026-05-31days on market $171,600 Under Contract - Continue to Show 67 DOM
-
2026-04-20historical Under Contract - Continue to Show
-
2026-03-25$171,600 Active
-
2005-02-10soldstatus $207,000
-
2005-02-10soldstatus $207,000
-
2002-10-07soldstatus $49,000
-
2001-02-01soldstatus $62,500 190-char remark
Show marketing remark (190 chars)
This property consists of a large three family with two three bedroom units andone two bedroom unit a single family house and a brick store front that is occupied by a church great cash flow
-
2000-10-11$69,900 190-char remark
Show marketing remark (190 chars)
This property consists of a large three family with two three bedroom units andone two bedroom unit a single family house and a brick store front that is occupied by a church great cash flow
ⓘ Source: listings_history table (triggers on properties + properties_extension) + one-shot
backfill from property_details.listing_events for pre-trigger history.
Climate risk First Street
- Flood 1/10 Low FEMA zone X (unshaded) · 0% chance over 30 yrs
- Wildfire 1/10 Low
- Heat 5/10 Major 7 d/yr ≥97°F today · 15 d/yr by 30 yrs out
- Wind 6/10 Major 27% chance of damaging wind over 30 yrs
- Air quality 3/10 Moderate 2 unhealthy d/yr today · 3 by 30 yrs out
Nearby sold comps map
Loading sold comps map…
Walkable amenities ~0.75 mi
Loading nearby amenities…
Taxation est. · year 1
- Rental income
- $20,384
- − Mortgage interest
- −$9,612
- − Property taxes
- −$2,574
- − Insurance
- −$858
- − Repairs & maintenance
- −$1,631
- − Management
- −$1,631
- − Depreciation
- −$4,992
- Taxable loss
- −$914
- Est. tax savings @ 24.0%
- +$219
- After-tax cash flow
- $2,092/yr
For passive investors: Depreciation is non-cash, so a rental often shows a tax loss while cash-flowing — sheltering income. Rental losses are passive: they offset passive income freely, and up to $25,000/yr can offset ordinary (W-2) income if you actively participate and your MAGI is under $100k (phasing out to $0 by $150k); unused losses carry forward. On sale, claimed depreciation is recaptured at up to 25%, and gains may owe capital-gains tax (a 1031 exchange can defer both). Figures are a year-1 estimate at your 24.0% rate — not tax advice; consult a CPA.
Schools (NCES district)
- District
- New Britain School District
- NCES district ID
- 0902670
- Math proficiency
- 6% ▼ -6.00%
- Reading proficiency
- 17% ▼ -5.00%
- Median HH income
- $40,827
- Composite
- 9.95/100
- National rank
- #9816
- State rank
- #153 of 153 in CT
Livability — New Britain
- Score
- 74/100
- State rank
- #67
- US rank
- #4936
Category grades
Schools grade is shown separately in the Schools card above.
Census & demographics
- Census place
- New Britain, CT
- County
- Hartford County · 754,208 people
- City population
- 66,322
- Metro
- Hartford-East Hartford-Middletown, CT
- Population (ZIP)
- 29,548
- Household income
- $51,022
- Rent vs Own
- Severe rent burden
- 2100.0
Population outlook (Capitol County) Hauer SSP2
- By 2040
- 1,063,519
Race, ethnicity, and origin ACS 2023
- Neighborhood character
- Diverse neighborhood (Simpson 0.63)
- Race & ethnicity
- Hispanic / Latino 52% White 30% Two or more races 17% Black 11% Asian 2%
- Hispanic origin (detail)
- Mexican 2% Puerto Rican 40% Dominican 4%
- Common ancestry
- Romanian 7% Lithuanian 6% Slovak 1%
- Foreign-born
- 15% · Canada, Jamaica
- Languages at home
- 51% English-only · Spanish 39% Russian/Polish/Slavic 6% Arabic 3%
Political lean MEDSL · Capitol
- 2024 margin
- Strong D (+21.9) · D 60.1% · R 38.2% · Other 1.7%
- All cycles
- 2024: D+21.9
Not yet ingested
- Civics
- —
Market trends
- HPI YoY
- ▲ 31.52%
- Current HPI
- 382.7816
- Rent YoY
- ▼ -0.58%
- Metro
- Hartford-East Hartford-Middletown, CT
- State GDP YoY
- ▲ 1.06%
- F500 in state
- 38
Industry mix (Fortune 500 HQ in CT)
| Industry | F500 HQs | Revenue |
|---|---|---|
| Industrial Machinery | 4 | $38B |
|
||
| Insurance | 3 | $71B |
|
||
| Financial Services | 2 | $25B |
|
||
| Transportation / Logistics | 2 | $18B |
|
||
| Healthcare | 1 | $247B |
|
||
| Telecommunications | 1 | $55B |
|
||
Price history
+145.5% since first listed7 events — show timeline
- 2026-04-20 Contingent — Smart MLS
- 2026-03-25 Listed $171,600 Smart MLS
- 2005-02-10 Sold (Public Records) $207,000 Public Records
- 2005-02-10 Sold (Public Records) $207,000 Public Records
- 2002-10-07 Sold (Public Records) $49,000 Public Records
- 2001-02-01 Sold (MLS) $62,500 Smart MLS
- 2000-10-11 Listed $69,900 Smart MLS
Property tax history
+3.4%/yrLatest (2025): $9,723 · +2.4% YoY. Source: county tax records.
Cash-flow waterfall
monthlySold comps — $/sqft
last 12 mo · ≤1 miLoading sold comps…