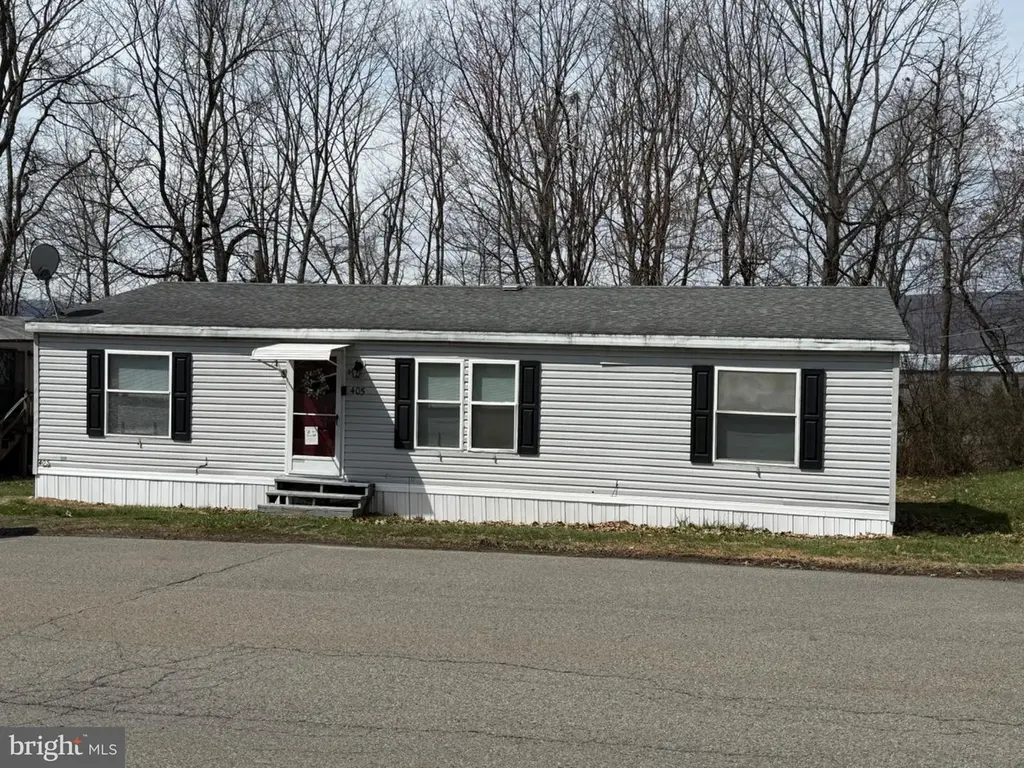
405 West Dr · Jenkins, PA
Flood risk 4/10 · Minor
- FEMA flood zone
- X (unshaded)
- Chance of flooding over 30 yrs
- 0.13%
- Est. flood insurance / yr
- $507 – $1,088
Fire risk 2/10 · Minimal
- Est. fire insurance / yr
- $511 – $949
Heat risk 4/10 · Minor
- Hot days now (above 96°F)
- 7 days/yr
- Hot days in 30 yrs
- 16 days/yr
Wind risk 2/10 · Minimal
- Chance of severe wind over 30 yrs
- 3.0%
Air-quality risk 2/10 · Minimal
- Unhealthy air days now
- 1 days/yr
- Unhealthy air days in 30 yrs
- 2 days/yr
Risk factors via First Street. Map © Google.
Why this score? — see what drove the B- grade
The composite is a weighted blend of 9 inputs, each scored 0–100. Each bar is that input's sub-score; the figure is the points it added to the 100-point composite (weight × sub-score).
- Cash flow +30.0/30.0
- 1% rule +10.0/10.0
- DSCR +10.0/10.0
- ARV discount +7.5/15.0
- Schools +3.0/10.0
- Rent growth +2.5/5.0
- Livability +2.5/5.0
- Condition / age +2.5/5.0
- Appreciation +0.0/10.0
$65,500
🖨 Deal sheet 📄 Offer letter ✓ Due diligence
Listing remarks MLS
This mobile home is seeking its new owners! Situated in Heather Highlands Mobile Home Park, conveniently located between Wilkes-Barre and Scranton, residents can enjoy tranquility while conveniently accessing a wide range of amenities. This property boasts two bedrooms, a full bathroom, and an interior square footage of 1,134. Constructed in 2000, this mobile home offers a comfortable and spacious living environment. Heather Highlands Mobile Home Park provides residents with an array of recreational facilities, including a swimming pool, basketball court, community center, dog park, playground, and regular community events. Lot rent ranges from $600 to $700 and encompass water, sewer, and trash services. The property is currently occupied but will be delivered vacant.
Key facts
- Dog park
- Community center
- Swimming pool
Tags
Neighborhood map
What this means for you Summary
Snapshot
- This is a 2-bed/1.0-bath manufactured listed at $66k.
Deal economics
- At list price, monthly cash flow is $808 ($10k/yr) — positive.
- The deal already cash-flows at list — no discount required.
- Meets the 1% rule at list price ($2k rent vs $66k).
- Recommended offer: $62k (6.0% below list) — sets the bar for market timing.
Location & tenants
- Location reads: area grade B — affects rentability + tenant quality, not the cash-flow math above.
- Pittston Area SD (suburban): math 30% / reading 40% proficiency, ranked #418 of 539 in PA (top 78%) — families likely to look elsewhere, expect single-tenant / working-renter base with shorter leases.
- Market conditions: 103 active listings in the ZIP; 4 comparable units currently listed for rent nearby; rentals at typical pace (median 21d on market — plan ~3-4 weeks tenant-placement turnaround); 349 units permitted in Luzerne County in 2024 (16 in 5+ unit buildings).
Forward outlook
- Local home prices are declining (-3.0%/yr); year-one equity from $453 of loan paydown is wiped out by about $2k of value loss. Plan a longer hold.
- Luzerne County population projected at +4% by 2050 — modest demand growth; plan on rents tracking national, not racing it.
- At projected returns (-3.0% appreciation + 3.0% rent growth), your $18k cash investment doubles in ~3 years — after that, you're playing with house money.
Negotiation context
- It's been on market 76 days — a 6% lower offer ($62k) is reasonable based on typical stale-listing flexibility.
Questions for the listing agent
- It's been on market 76 days. Have you received any prior offers? Is the seller open to a 6% concession, seller financing, or rate buy-down credit?
- Why hasn't it sold? Are there any deal-killer items the seller is aware of (foundation, flood, title, zoning, code violations)?
- Is there a deadline driving the sale (1031 exchange, divorce, estate, relocation)? That informs how much negotiation room exists.
- What's the average days-on-market for RENTAL listings here right now (not sales)? A rising rental-DOM trend means longer vacancies and softer asking-rent achievability than the comps imply.
- What's the recent tenant-quality profile in this submarket — average credit score on applications, eviction rate, late-payment / NSF rate, and stable-employment percentage? A property-management company in the area should have these aggregated.
- How much new for-sale + rental construction is in the pipeline within 1–3 miles? Heavy new supply typically softens prices + rents 12–24 months out; constrained supply supports both.
Investment metrics
- 1% rule
- 2.45% ✓
- Cap rate
- 21.10%
- Cash-on-cash
- 52.89%
- DSCR
- 3.35
- GRM
- 3.4
CMA / ARV
- ARV (median comp)
- $166,373
- List price
- $65,500
- Delta
- -60.63%
- Verdict
- UNDERPRICED
- Comps
- 20 within 1.0 mi
Projected returns pro-forma
-3.0% appreciation · 3.0% rent growth · sell at horizon
- IRR
- 50.9%
- Equity multiple
- 3.23×
- Total profit
- $40,897
- Equity at exit
- $9,766
- IRR
- 56.3%
- Equity multiple
- 6.56×
- Total profit
- $102,020
- Equity at exit
- $5,663
Cash invested: $18,340 (down + closing). Projections, not guarantees.
Landlord ↔ Tenant lean methodology
- Overall (STATE)
- 62 Landlord-Friendly
- State Pennsylvania
- 62 Landlord-Friendly · EVEN
- County
- — inherits STATE
- City
- — inherits STATE
ZIP-level market 18640
- Home prices YoY
- -34.9%
- Active inventory
- 103
- Price-to-rent
- 3.4×
Monthly cashflow live
- Estimated rent
- $1,605 medium interval (Pro) →
- Mortgage (P&I)
- −$343
- Tax from tax record
- −$89 /mo · $1,065/yr
- Insurance
- −$27
- HOA
- −$0
- Vacancy / Maint / Mgmt
- −$337
- Net cashflow
- $808
Break-even live
UW: 25.0% down · 7.5% · 30yr · 1.5% tax · 5.0% vac · 8.0% maint · 8.0% mgmt
Financing live
Cash to close
- Down payment
- $16,375
- Closing costs
- $1,965
- Reserves months
- —
- Total cash needed
- —
Loan-product check · same deal, 3 products live
Conventional
25% down · 7.5% · 30yr
- Down + closing
- —
- Monthly P&I
- —
- Monthly cashflow
- —
- DSCR
- —
- Eligible?
- —
Personal DTI + credit; lowest rate.
DSCR
20% down · 8.5% · 30yr
- Down + closing
- —
- Monthly P&I
- —
- Monthly cashflow
- —
- DSCR
- —
- Eligible?
- —
No personal income docs; deal must DSCR.
Hard money
10% down · 12.0% · 12mo
- Down + closing
- —
- Monthly P&I
- —
- Monthly cashflow
- —
- DSCR
- —
- Eligible?
- —
Short-term bridge; refi at stabilization.
Rent comps 4 comps
| Address | Beds | Baths | Sqft | Rent | $/sqft | DOM | Units | Dist |
|---|---|---|---|---|---|---|---|---|
| 422 E Saylor Ave Wilkes Barre, PA | 3.0 | 1.0 | 1300 | $1,550 | $1.19 | 44d | 1 | 0.99mi |
| 296 Wyoming Ave Wyoming, PA | 2.0 | 1.0 | 1500 | $1,599 | $1.07 | 13d | 1 | 1.36mi |
| 187 Wyoming Ave Wyoming, PA | 2.0 | 1.0 | 700 | $1,300 | $1.86 | 21d | 1 | 1.44mi |
| 111 W Pettebone St Wyoming, PA | 3.0 | 1.0 | 1246 | $1,900 | $1.52 | 13d | 1 | 1.47mi |
Listing history 15 events
-
2026-06-18days on market $65,500 Active 76 DOM
-
2026-06-17days on market $65,500 Active 75 DOM
-
2026-06-16days on market $65,500 Active 74 DOM
-
2026-06-15days on market $65,500 Active 73 DOM
-
2026-06-14days on market $65,500 Active 71 DOM
-
2026-06-13days on market $65,500 Active 70 DOM
-
2026-06-10days on market $65,500 Active 68 DOM
-
2026-06-09days on market $65,500 Active 67 DOM
-
2026-06-08days on market $65,500 Active 66 DOM
-
2026-06-07days on market $65,500 Active 65 DOM
-
2026-06-02days on market $65,500 Active 60 DOM
-
2026-06-01days on market $65,500 Active 59 DOM
-
2026-05-31days on market $65,500 Active 58 DOM
-
2026-05-30days on market $65,500 Active 57 DOM
-
2026-04-03$65,500 Active 778-char remark
Show marketing remark (778 chars)
This mobile home is seeking its new owners! Situated in Heather Highlands Mobile Home Park, conveniently located between Wilkes-Barre and Scranton, residents can enjoy tranquility while conveniently accessing a wide range of amenities. This property boasts two bedrooms, a full bathroom, and an interior square footage of 1,134. Constructed in 2000, this mobile home offers a comfortable and spacious living environment. Heather Highlands Mobile Home Park provides residents with an array of recreational facilities, including a swimming pool, basketball court, community center, dog park, playground, and regular community events. Lot rent ranges from $600 to $700 and encompass water, sewer, and trash services. The property is currently occupied but will be delivered vacant.
ⓘ Source: listings_history table (triggers on properties + properties_extension) + one-shot
backfill from property_details.listing_events for pre-trigger history.
Tax reassessment forecast PA · Partial reset (capped growth)
- Current annual tax
- $1,065 · $89/mo
- Projected year-2 tax
- $1,065 · $89/mo
- Expected delta
- $0/yr ($0/mo · 0.0%)
ⓘ Screening estimate from a state-policy table — verify with the county assessor before closing.
Climate risk First Street
- Flood 4/10 Moderate FEMA zone X (unshaded) · 13% chance over 30 yrs
- Wildfire 2/10 Low
- Heat 4/10 Moderate 7 d/yr ≥96°F today · 16 d/yr by 30 yrs out
- Wind 2/10 Low 3% chance of damaging wind over 30 yrs
- Air quality 2/10 Low 1 unhealthy d/yr today · 2 by 30 yrs out
Nearby sold comps map
Loading sold comps map…
Walkable amenities ~0.75 mi
Loading nearby amenities…
Taxation est. · year 1
- Rental income
- $19,258
- − Mortgage interest
- −$3,669
- − Property taxes
- −$1,065
- − Insurance
- −$328
- − Repairs & maintenance
- −$1,541
- − Management
- −$1,541
- − Depreciation
- −$1,905
- Taxable income
- $9,210
- Est. tax owed @ 24.0%
- −$2,210
- After-tax cash flow
- $7,489/yr
For passive investors: Depreciation is non-cash, so a rental often shows a tax loss while cash-flowing — sheltering income. Rental losses are passive: they offset passive income freely, and up to $25,000/yr can offset ordinary (W-2) income if you actively participate and your MAGI is under $100k (phasing out to $0 by $150k); unused losses carry forward. On sale, claimed depreciation is recaptured at up to 25%, and gains may owe capital-gains tax (a 1031 exchange can defer both). Figures are a year-1 estimate at your 24.0% rate — not tax advice; consult a CPA.
Schools (NCES district)
- District
- Pittston Area SD
- NCES district ID
- 4219200
- Math proficiency
- 30% ▼ -12.00%
- Reading proficiency
- 40% ▼ -19.00%
- Median HH income
- $45,316
- Composite
- 29.86/100
- National rank
- #6409
- State rank
- #418 of 539 in PA
Livability — Jenkins
No livability data for this city. (Only ~50 U.S. cities are tracked.)
Census & demographics
- Census place
- Inkerman, PA
- Population (ZIP)
- 16,418
Population outlook (Luzerne County) Hauer SSP2
- Today (2025)
- 319,505 people
- By 2030
- 319,943 · +0.1%
- By 2040
- 322,643 · +1.0%
- By 2050
- 330,817 · +3.5%
- By 2075
- 379,145 · +18.7%
- By 2100
- 431,908 · +35.2%
Race, ethnicity, and origin ACS 2023
- Neighborhood character
- Predominantly White (85%)
- Race & ethnicity
- White 85% Hispanic / Latino 6% Two or more races 5% Black 4%
- Hispanic origin (detail)
- Puerto Rican 4%
- Common ancestry
- Romanian 19% Scotch-Irish 2% Iranian 1%
- Foreign-born
- 3% · Canada, Jamaica
- Languages at home
- 93% English-only · Spanish 4% Other Indo-European 1% Chinese 1%
Political lean MEDSL · Luzerne
- 2024 margin
- R (+19.2) · D 40.0% · R 59.2%
- 2008→2024 swing
- -27.6pp toward R · 2008: 8.4pp · 2024: -19.2pp
- All cycles
- 2024: R+19.2 2020: R+14.4 2016: R+19.6 2012: D+4.8 2008: D+8.4
Not yet ingested
- Civics
- —
Market trends
- HPI YoY
- ▼ -102.89%
- Current HPI
- 191.973
- Rent YoY
- —
- Metro
- —
- State GDP YoY
- ▲ 1.68%
- F500 in state
- 34
Industry mix (Fortune 500 HQ in PA)
| Industry | F500 HQs | Revenue |
|---|---|---|
| Healthcare | 2 | $309B |
|
||
| Insurance | 2 | $27B |
|
||
| Telecommunications / Media | 1 | $124B |
|
||
| Industrial Distribution | 1 | $22B |
|
||
| Financial Services | 1 | $20B |
|
||
| Chemicals / Materials | 1 | $18B |
|
||
Price history
1 event — show timeline
- 2026-04-03 Listed $65,500 BRIGHT MLS
Property tax history
+1.7%/yrLatest (2026): $1,065 · +2.5% YoY. Source: county tax records.
Cash-flow waterfall
monthlySold comps — $/sqft
last 12 mo · ≤1 miLoading sold comps…