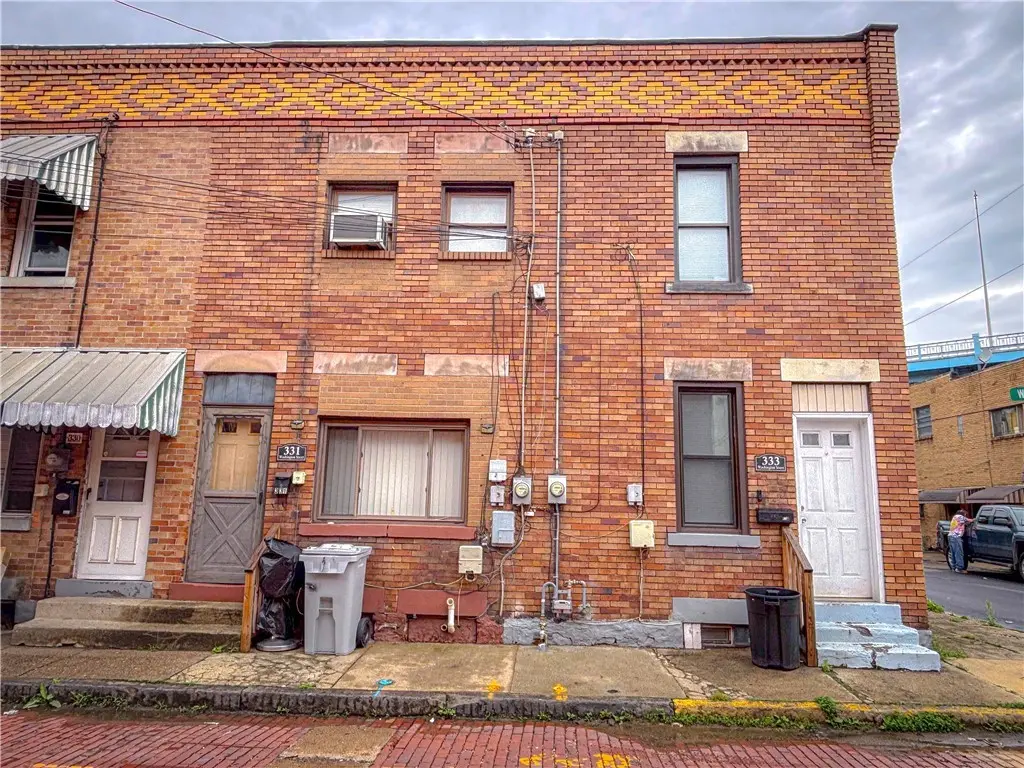
331 Washington St · McKees Rocks, PA
Flood risk 10/10 · Severe
- FEMA flood zone
- X (shaded)
- Chance of flooding over 30 yrs
- 0.99%
- Est. flood insurance / yr
- $473 – $860
Fire risk 1/10 · Minimal
- Est. fire insurance / yr
- $511 – $949
Heat risk 4/10 · Minor
- Hot days now (above 98°F)
- 7 days/yr
- Hot days in 30 yrs
- 19 days/yr
Wind risk 2/10 · Minimal
- Chance of severe wind over 30 yrs
- —
Air-quality risk 3/10 · Minor
- Unhealthy air days now
- 3 days/yr
- Unhealthy air days in 30 yrs
- 3 days/yr
Risk factors via First Street. Map © Google.
Why this score? — see what drove the B- grade
The composite is a weighted blend of 9 inputs, each scored 0–100. Each bar is that input's sub-score; the figure is the points it added to the 100-point composite (weight × sub-score).
- Cash flow +30.0/30.0
- 1% rule +10.0/10.0
- DSCR +10.0/10.0
- ARV discount +7.5/15.0
- Rent growth +5.0/5.0
- Livability +4.1/5.0
- Condition / age +2.5/5.0
- Schools +0.9/10.0
- Appreciation +0.0/10.0
$45,000
🖨 Deal sheet (PDF) 📄 Offer letter ✓ Due diligence
Listing remarks MLS
Attention Investors! McKees Rocks is growing fast! This small but mighty money maker has been raking in the dough from the same tenant for the last 26 years! With only 4 rooms, a full basement and bath, there really isn’t much to care for, so its perfect for 1st time investors. The tenant treats this special place as if it was his own. He recently added beautiful light fixtures to the living rm. The spacious kitchen offers plenty of maintenance free cabinetry and counterspace along with enough room for a good sized table and chairs. Off the kitchen is a private, covered porch where the tenant loves to entertain. Upstairs are two bedrooms and a bath. After 26 years of living life large in this wonderful home, the basement has become quite full of the tenants treasures, but there is still room for his washer and dryer and a 2nd bath. Tenant pays $6300 a year plus utilities. Updates include: Water Tank (2019) High Efficency Furnace (circa 2017).
Key facts
- All-brick row home
- Laundry hookups
- Covered rear porch
Tags
Property features AI
Exterior
- Parking: On-street parking
- Utilities: Public water; Public sewer
- Home design: 2-story brick property; Resale condition
- Construction: Brick construction
- Exterior features: Small urban lot
Interior
- Flooring: Carpet; Vinyl
- Bathrooms: 1 full bathroom
- Heating & cooling: Gas forced-air heating; Wall/window cooling unit(s)
- Interior features: Carpet flooring; Vinyl flooring; Interior entry basement; Public transportation nearby
Neighborhood map
What this means for you Summary
Snapshot
- This is a 2-bed/1.0-bath townhouse listed at $45k.
Deal economics
- At list price, monthly cash flow is $539 ($6k/yr) — positive.
- The deal already cash-flows at list — no discount required.
- Meets the 1% rule at list price ($1k rent vs $45k).
- Recommended offer: $44k (1.5% below list) — sets the bar for market timing.
- Cap rate 22.1% vs local median 10.0% in McKees Rocks — top-decile yield for the area; either an underpriced asset or a hidden risk that comps aren't pricing in. Stress-test before assuming the spread holds.
Location & tenants
- Location reads 82/100 on livability (#143 in PA, #1,154 nationally) — a professional / high-income tenant draw. Strengths: amenities A+, commute A+, cost of living A+; Watch: employment F.
- Sto-Rox SD (suburban): math 4% / reading 18% proficiency, ranked #532 of 539 in PA (top 99%) — low school quality limits family demand, transient renter base, plan for 1-2y turnover; 77% free/reduced lunch — lower-income household profile, screen leases tightly.
- Zoned schools: Sto-Rox Primary Ctr (math 8% / reading 27%, grade F, #1,295 of 1,518 statewide, top 86%, 328 students, 100% FRL); Sto-Rox Upper El Sch (math 3% / reading 20%, grade F, #492 of 512 statewide, top 96%, 218 students, 100% FRL); Sto-Rox Jshs (math 2% / reading 2%, grade F, #437 of 437 statewide, top 100%, 517 students, 92% FRL) — zoned schools average 98% FRL vs 77% district-wide (20 pts higher); higher-poverty schools than district average — tighter screening recommended.
- Market conditions: Rents rising fast (+13.1%/yr); 126 active listings in the ZIP; 25 comparable units currently listed for rent nearby; rentals at typical pace (median 26d on market — plan ~3-4 weeks tenant-placement turnaround); 44% of comp listings sitting > 30 days — soft ceiling on asking rent; 2,996 units permitted in Allegheny County in 2024 (1,588 in 5+ unit buildings).
Forward outlook
- Local home prices are declining (-3.0%/yr); year-one equity from $311 of loan paydown is wiped out by about $1k of value loss. Plan a longer hold.
- At projected returns (-3.0% appreciation + 8.0% rent growth), your $13k cash investment doubles in ~3 years — after that, you're playing with house money.
Negotiation context
- It's been on market 17 days — a 2% lower offer ($44k) is reasonable based on typical stale-listing flexibility.
- 4 sale attempts since 16y ago with the ask held roughly flat each time — persistent listings suggest the price (not the market) is what's stuck; bring a comps-based counter.
- Current owner paid $30k; list at $45k implies a 50% gain — meaningful room to come down on a strong offer.
Risks & watch-outs
- Watch-outs: flood insurance adds $56/mo; built in 1929 — expect roof / HVAC / electrical / plumbing capex.
- Climate carrying-cost: severe flood risk — expect insurance premiums to compound above CPI over the hold.
Questions for the listing agent
- Built in 1929 — when were the roof, HVAC, electrical panel, plumbing, and water heater last replaced?
- What's the actual annual flood-insurance premium (NFIP or private), and is the property in a SFHA with mandatory coverage?
- Is there a deadline driving the sale (1031 exchange, divorce, estate, relocation)? That informs how much negotiation room exists.
- Schools are F-rated, which usually means shorter tenancies and higher turnover. Who's the typical renter profile here, and what's been the actual vacancy rate?
- What's the average days-on-market for RENTAL listings here right now (not sales)? A rising rental-DOM trend means longer vacancies and softer asking-rent achievability than the comps imply.
- What's the recent tenant-quality profile in this submarket — average credit score on applications, eviction rate, late-payment / NSF rate, and stable-employment percentage? A property-management company in the area should have these aggregated.
- How much new for-sale + rental construction is in the pipeline within 1–3 miles? Heavy new supply typically softens prices + rents 12–24 months out; constrained supply supports both.
Investment metrics
- 1% rule
- 2.60% ✓
- Cap rate
- 22.14%
- Cash-on-cash
- 56.61%
- DSCR
- 3.52
- GRM
- 3.2
CMA / ARV
No comps found within radius.
Projected returns pro-forma
-3.0% appreciation · 8.0% rent growth · sell at horizon
- IRR
- 55.3%
- Equity multiple
- 3.64×
- Total profit
- $33,277
- Equity at exit
- $6,710
- IRR
- 62.4%
- Equity multiple
- 9.06×
- Total profit
- $101,586
- Equity at exit
- $3,891
Cash invested: $12,600 (down + closing). Projections, not guarantees.
Landlord ↔ Tenant lean methodology
- Overall (STATE)
- 62 Landlord-Friendly
- State Pennsylvania
- 62 Landlord-Friendly · EVEN
- County
- — inherits STATE
- City
- — inherits STATE
ZIP-level market 15136
- Home prices YoY
- -30.4%
- Rents YoY
- 13.1%
- Active inventory
- 126
- Price-to-rent
- 3.2×
Monthly cashflow live
- Estimated rent
- $1,171 high interval (Pro) →
- Mortgage (P&I)
- −$236
- Tax from tax record
- −$76 /mo · $909/yr
- Insurance
- −$19
- Flood insurance flood zone
- −$56 /mo · $666/yr
- HOA
- −$0
- Vacancy / Maint / Mgmt
- −$246
- Net cashflow
- $539
Break-even live
Sensitivity live
| Price | -10% $564 | -5% $552 | +0% $539 | +5% $526 | +10% $513 |
|---|---|---|---|---|---|
| Rent | -10% $446 | -5% $493 | +0% $539 | +5% $585 | +10% $631 |
| Rate | -1.0pp $561 | -0.5pp $550 | base $539 | +0.5pp $527 | +1.0pp $515 |
UW: 25.0% down · 7.5% · 30yr · 1.5% tax · 5.0% vac · 8.0% maint · 8.0% mgmt
Financing live
Cash to close
- Down payment
- $11,250
- Closing costs
- $1,350
- Reserves months
- —
- Total cash needed
- —
Loan-product check · same deal, 3 products live
Conventional
25% down · 7.5% · 30yr
- Down + closing
- —
- Monthly P&I
- —
- Monthly cashflow
- —
- DSCR
- —
- Eligible?
- —
Personal DTI + credit; lowest rate.
DSCR
20% down · 8.5% · 30yr
- Down + closing
- —
- Monthly P&I
- —
- Monthly cashflow
- —
- DSCR
- —
- Eligible?
- —
No personal income docs; deal must DSCR.
Hard money
10% down · 12.0% · 12mo
- Down + closing
- —
- Monthly P&I
- —
- Monthly cashflow
- —
- DSCR
- —
- Eligible?
- —
Short-term bridge; refi at stabilization.
Rent comps 25 comps
| Address | Beds | Baths | Sqft | Rent | $/sqft | DOM | Units | Dist |
|---|---|---|---|---|---|---|---|---|
| 214 Erwin Pl Mc Kees Rocks, PA | 3.0 | 1.0 | 1026 | $1,685 | $1.64 | 45d | 1 | 0.64mi |
| 33 Greenough Ave Pittsburgh, PA | 2.0 | 1.0 | 900 | $1,300 | $1.44 | 45d | 1 | 0.72mi |
| 614 Woodward Ave McKees Rocks, PA | 2.0 | 1.0 | 1000 | $950 | $0.95 | 9d | 1 | 0.84mi |
| 219 Woodlawn Ave Pittsburgh, PA | 2.0 | 1.0 | 925 | $1,075 | $1.16 | 45d | 1 | 0.89mi |
| 907 Chartiers Ave Unit 2 McKees Rocks, PA | 2.0 | 1.0 | 900 | $1,100 | $1.22 | 25d | 1 | 0.89mi |
| 117 Crawford Ave Unit 2 Pittsburgh, PA | 1.0 | 1.0 | 700 | $900 | $1.29 | 45d | 1 | 0.89mi |
| 149 S Euclid Ave Unit 1 Pittsburgh, PA | 1.0 | 1.0 | 800 | $1,200 | $1.50 | 19d | 1 | 0.97mi |
| 705 Russellwood Ave Apt 1 McKees Rocks, PA | 2.0 | 1.0 | 800 | $1,549 | $1.94 | 25d | 1 | 1.01mi |
| 145 Washington Ave Pittsburgh, PA | 1.0 | 1.0 | 650 | $950 | $1.46 | 45d | 1 | 1.02mi |
| 214 Wright St Unit Na McKees Rocks, PA | 2.0 | 1.0 | 954 | $1,175 | $1.23 | 16d | 1 | 1.08mi |
| 25 Grant Ave #1 Bellevue, PA | 1.0 | 1.0 | 950 | $1,095 | $1.15 | 3d | 1 | 1.13mi |
| 933 Woodward Ave Unit NA McKees Rocks, PA | 2.0 | 1.0 | 1100 | $1,400 | $1.27 | 22d | 1 | 1.13mi |
| 933 Woodward Ave Unit MC McKees Rocks, PA | 2.0 | 1.0 | 1100 | $1,400 | $1.27 | 25d | 1 | 1.13mi |
| 136 Sheridan Ave Pittsburgh, PA | 1.0 | 1.0 | 625 | $890 | $1.42 | 25d | 1 | 1.17mi |
| 60 Sumner Ave Bellevue, PA | 1.0 | 1.0 | 600 | $1,004 | $1.67 | 18d | 2 | 1.20mi |
| 114 Singer Ave McKees Rocks, PA | 1.0 | 1.0 | 650 | $800 | $1.23 | 46d | 1 | 1.21mi |
| 71-73 Sheridan Ave Unit 73 Pittsburgh, PA | 2.0 | 1.0 | 900 | $1,100 | $1.22 | 45d | 1 | 1.22mi |
| 802 13th St Unit 2 McKees Rocks, PA | 2.0 | 1.0 | 1100 | $920 | $0.84 | 45d | 1 | 1.22mi |
| 118 Arch Ave Pittsburgh, PA | 2.0 | 1.0 | 850 | $1,100 | $1.29 | 25d | 1 | 1.24mi |
| 27 Rudolph St Mc Kees Rocks, PA | 3.0 | 1.0 | 1084 | $1,100 | $1.01 | 3d | 1 | 1.25mi |
| 16 N Fremont Ave Pittsburgh, PA | 2.0 | 1.0 | 1000 | $1,100 | $1.10 | 45d | 1 | 1.31mi |
| 220 S Home Ave Pittsburgh, PA | 1.0 | 1.0 | 840 | $1,299 | $1.55 | 45d | 1 | 1.40mi |
| 25 S Starr Ave Unit 14 Bellevue, PA | 1.0 | 1.0 | 600 | $899 | $1.50 | 12d | 1 | 1.46mi |
| 464 Teece Ave Unit 4 Pittsburgh, PA | 1.0 | 1.0 | 950 | $1,200 | $1.26 | 19d | 1 | 1.46mi |
| 478 Teece Ave Pittsburgh, PA | 2.0 | 2.0 | 950 | $1,325 | $1.39 | 45d | 1 | 1.48mi |
Listing history 11 events
-
2026-06-21days on market $45,000 Active 17 DOM
-
2026-06-18days on market $45,000 Active 14 DOM
-
2026-06-17days on market $45,000 Active 13 DOM
-
2026-06-16days on market $45,000 Active 12 DOM
-
2026-06-15days on market $45,000 Active 11 DOM
-
2026-06-13days on market $45,000 Active 9 DOM
-
2026-06-09days on market $45,000 Active 5 DOM
-
2026-06-08days on market $45,000 Active 4 DOM
-
2026-06-07days on market $45,000 Active 3 DOM
-
2026-06-05remarks 590-char remark
-
2026-06-05$45,000 Active 1 DOM
ⓘ Source: listings_history table (triggers on properties + properties_extension) + one-shot
backfill from property_details.listing_events for pre-trigger history.
Tax reassessment forecast PA · Partial reset (capped growth)
- Current annual tax
- $909 · $76/mo
- Projected year-2 tax
- $909 · $76/mo
- Expected delta
- $0/yr ($0/mo · 0.0%)
ⓘ Screening estimate from a state-policy table — verify with the county assessor before closing.
Climate risk First Street
- Flood 10/10 Extreme FEMA zone X (shaded) · 99% chance over 30 yrs
- Wildfire 1/10 Low
- Heat 4/10 Moderate 7 d/yr ≥98°F today · 19 d/yr by 30 yrs out
- Wind 2/10 Low
- Air quality 3/10 Moderate 3 unhealthy d/yr today · 3 by 30 yrs out
Nearby sold comps map
Loading sold comps map…
Walkable amenities ~0.75 mi
Loading nearby amenities…
Taxation est. · year 1
- Rental income
- $14,049
- − Mortgage interest
- −$2,521
- − Property taxes
- −$909
- − Insurance
- −$891
- − Repairs & maintenance
- −$1,124
- − Management
- −$1,124
- − Depreciation
- −$1,309
- Taxable income
- $6,170
- Est. tax owed @ 24.0%
- −$1,481
- After-tax cash flow
- $4,985/yr
For passive investors: Depreciation is non-cash, so a rental often shows a tax loss while cash-flowing — sheltering income. Rental losses are passive: they offset passive income freely, and up to $25,000/yr can offset ordinary (W-2) income if you actively participate and your MAGI is under $100k (phasing out to $0 by $150k); unused losses carry forward. On sale, claimed depreciation is recaptured at up to 25%, and gains may owe capital-gains tax (a 1031 exchange can defer both). Figures are a year-1 estimate at your 24.0% rate — not tax advice; consult a CPA.
Schools (NCES district)
- District
- Sto-Rox SD
- NCES district ID
- 4222830
- Math proficiency
- 4% ▼ -5.00%
- Reading proficiency
- 18% ▼ -4.00%
- Median HH income
- $30,268
- Composite
- 8.51/100
- National rank
- #9904
- State rank
- #532 of 539 in PA
Livability — McKees Rocks
- Score
- 82/100
- State rank
- #143
- US rank
- #1154
Category grades
Schools grade is shown separately in the Schools card above.
Census & demographics
- Census place
- McKees Rocks, PA
- County
- Allegheny County · 1,022,028 people
- City population
- 22,623
- Metro
- Pittsburgh, PA
- Population (ZIP)
- 22,623
- Household income
- $69,099
- Rent vs Own
- Severe rent burden
- 768.0
Population outlook (Allegheny County) Hauer SSP2
- Today (2025)
- 1,250,282 people
- By 2030
- 1,256,482 · +0.5%
- By 2040
- 1,256,318 · +0.5%
- By 2050
- 1,244,169 · -0.5%
- By 2075
- 1,197,693 · -4.2%
- By 2100
- 1,093,187 · -12.6%
Race, ethnicity, and origin ACS 2023
- Neighborhood character
- Predominantly White (75%)
- Race & ethnicity
- White 75% Black 18% Two or more races 4% Hispanic / Latino 2%
- Common ancestry
- Romanian 10% Subsaharan African 3% Scotch-Irish 2%
- Foreign-born
- 3% · Canada
- Languages at home
- 96% English-only · Spanish 1% Other Indo-European 1%
Political lean MEDSL · Allegheny
- 2024 margin
- Strong D (+20.3) · D 59.7% · R 39.4%
- 2008→2024 swing
- +4.8pp toward D · 2008: 15.5pp · 2024: 20.3pp
- All cycles
- 2024: D+20.3 2020: D+20.4 2016: D+16.4 2012: D+14.4 2008: D+15.5
Not yet ingested
- Civics
- —
Market trends
- HPI YoY
- ▼ -107.07%
- Current HPI
- 244.6934
- Rent YoY
- ▲ 13.12%
- Metro
- Pittsburgh, PA
- State GDP YoY
- ▲ 1.68%
- F500 in state
- 34
Industry mix (Fortune 500 HQ in PA)
| Industry | F500 HQs | Revenue |
|---|---|---|
| Healthcare | 2 | $309B |
|
||
| Insurance | 2 | $27B |
|
||
| Telecommunications / Media | 1 | $124B |
|
||
| Industrial Distribution | 1 | $22B |
|
||
| Financial Services | 1 | $20B |
|
||
| Chemicals / Materials | 1 | $18B |
|
||
Price history
+244.4% since first listed11 events — show timeline
- 2026-06-03 Listed $45,000 West Penn MLS
- 2022-10-31 Sold (Public Records) $30,000 Public Records
- 2022-10-26 Sold (MLS) $30,000 West Penn MLS
- 2022-08-16 Pending — West Penn MLS
- 2022-08-10 Price Changed $40,000 West Penn MLS
- 2022-05-04 Listed $50,000 West Penn MLS
- 2021-07-21 Listed $65,000 West Penn MLS
- 2011-04-13 Sold (Public Records) $52,530 Public Records
- 2011-04-01 Sold (MLS) $13,065 West Penn MLS
- 2011-04-01 Price Changed $23,500 West Penn MLS
- 2010-11-23 Listed $13,065 West Penn MLS
Property tax history
+4.7%/yrLatest (2026): $909 · +4.1% YoY. Source: county tax records.
Cash-flow waterfall
monthlySold comps — $/sqft
last 12 mo · ≤1 miLoading sold comps…