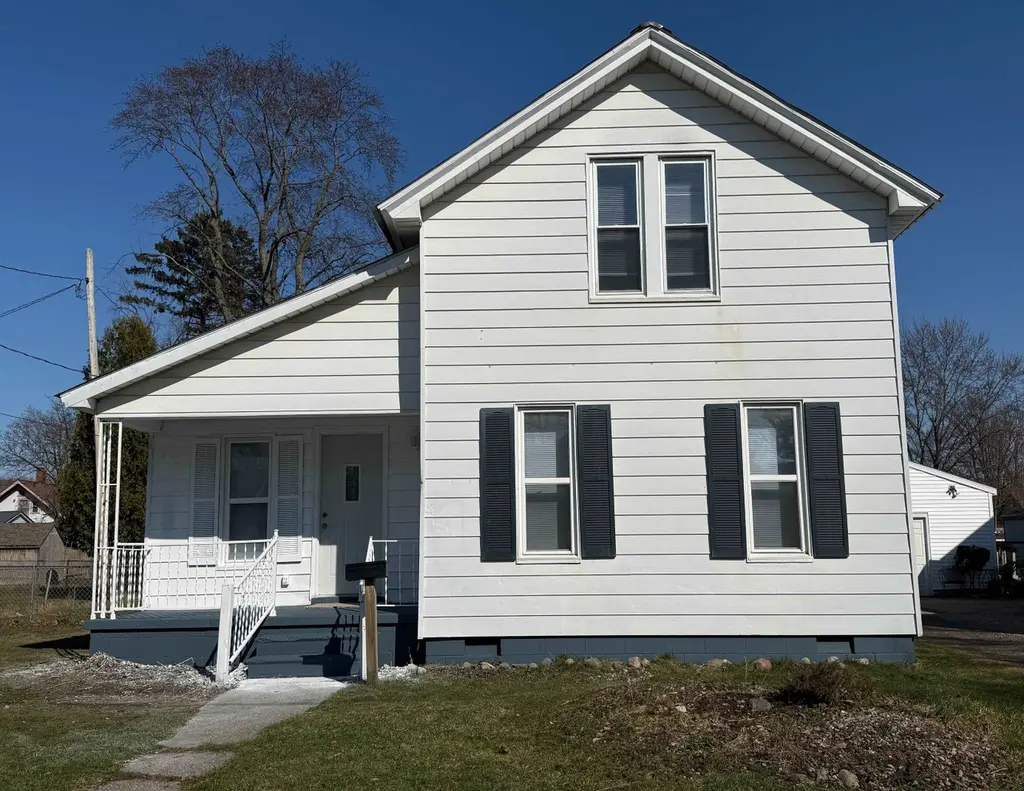
407 S KIESEL St · Bay City, MI
Flood risk 1/10 · Minimal
- FEMA flood zone
- X (unshaded)
- Chance of flooding over 30 yrs
- 0.0%
- Est. flood insurance / yr
- $473 – $860
Fire risk 1/10 · Minimal
- Est. fire insurance / yr
- $784 – $1,456
Heat risk 3/10 · Minor
- Hot days now (above 97°F)
- 7 days/yr
- Hot days in 30 yrs
- 14 days/yr
Wind risk 1/10 · Minimal
- Chance of severe wind over 30 yrs
- —
Air-quality risk 2/10 · Minimal
- Unhealthy air days now
- 1 days/yr
- Unhealthy air days in 30 yrs
- 2 days/yr
Risk factors via First Street. Map © Google.
Why this score? — see what drove the B grade
The composite is a weighted blend of 9 inputs, each scored 0–100. Each bar is that input's sub-score; the figure is the points it added to the 100-point composite (weight × sub-score).
- Cash flow +30.0/30.0
- ARV discount +12.4/15.0
- 1% rule +10.0/10.0
- DSCR +10.0/10.0
- Livability +3.4/5.0
- Schools +2.8/10.0
- Rent growth +2.5/5.0
- Condition / age +2.5/5.0
- Appreciation +0.0/10.0
$84,900
🖨 Deal sheet 📄 Offer letter ✓ Due diligence
Listing remarks MLS
Check out this solid 1 1/2 story, 3 bedroom, 1 bath home conveniently located on Bay City's westside. Enjoy the freshly painted & the newer carpeted interior along with the cozy galley style applianced kitchen. 1st floor laundry & utility room. Long lasting & low maintenance metal roof, aluminum siding & vinyl windows. Step outside to the fenced yard perfect of kids, pets or entertaining. A great value for the price, so don't hesitate!
Key facts
- Vinyl windows
- Metal roof
- Fenced yard
Tags
Neighborhood map
What this means for you Summary
Snapshot
- This is a 2-bed/1.0-bath single-family listed at $85k.
Deal economics
- At list price, monthly cash flow is $591 ($7k/yr) — positive.
- The deal already cash-flows at list — no discount required.
- Meets the 1% rule at list price ($1k rent vs $85k).
- Recommended offer: $84k (1.5% below list) — sets the bar for market timing.
- Cap rate 14.6% vs local median 5.5% in Bay City — top-decile yield for the area; either an underpriced asset or a hidden risk that comps aren't pricing in. Stress-test before assuming the spread holds.
Location & tenants
- Location reads 68/100 on livability (#360 in MI) — a middle-class / working-renter tenant base. Strengths: cost of living A+, housing A+, health & safety A+; Watch: schools D+, amenities D, crime F.
- Bay City School District (urban): math 27% / reading 40% proficiency, ranked #317 of 540 in MI (top 59%) — families likely to look elsewhere, expect single-tenant / working-renter base with shorter leases.
- Market conditions: 246 active listings in the ZIP; 4 comparable units currently listed for rent nearby; rentals lingering (median 44d on market — plan ~5-8 weeks vacancy on turnover, expect pricing pressure); 100% of comp listings sitting > 30 days — soft ceiling on asking rent; 39 units permitted in Bay County in 2024 (0 in 5+ unit buildings).
Forward outlook
- Local home prices are declining (-3.0%/yr); year-one equity from $587 of loan paydown is wiped out by about $3k of value loss. Plan a longer hold.
- Bay County population projected at -21% by 2050 — secular population decline; favor cash flow + early exit over multi-decade hold.
- At projected returns (-3.0% appreciation + 3.0% rent growth), your $24k cash investment doubles in ~5 years — after that, you're playing with house money.
Negotiation context
- It's been on market 30 days — a 2% lower offer ($84k) is reasonable based on typical stale-listing flexibility.
- 2 sale attempts with the ask held roughly flat each time — persistent listings suggest the price (not the market) is what's stuck; bring a comps-based counter.
Risks & watch-outs
- Watch-outs: built in 1940 — expect roof / HVAC / electrical / plumbing capex.
Questions for the listing agent
- Built in 1940 — when were the roof, HVAC, electrical panel, plumbing, and water heater last replaced?
- Is there a deadline driving the sale (1031 exchange, divorce, estate, relocation)? That informs how much negotiation room exists.
- Schools are D-rated, which usually means shorter tenancies and higher turnover. Who's the typical renter profile here, and what's been the actual vacancy rate?
- Crime grade is F in this area — have there been break-ins, vandalism, or insurance claims at this property in the last 3 years? What carrier currently insures it and at what premium?
- What's the average days-on-market for RENTAL listings here right now (not sales)? A rising rental-DOM trend means longer vacancies and softer asking-rent achievability than the comps imply.
- What's the recent tenant-quality profile in this submarket — average credit score on applications, eviction rate, late-payment / NSF rate, and stable-employment percentage? A property-management company in the area should have these aggregated.
- How much new for-sale + rental construction is in the pipeline within 1–3 miles? Heavy new supply typically softens prices + rents 12–24 months out; constrained supply supports both.
Investment metrics
- 1% rule
- 1.75% ✓
- Cap rate
- 14.64%
- Cash-on-cash
- 29.83%
- DSCR
- 2.33
- GRM
- 4.8
CMA / ARV
- ARV (median comp)
- $95,248
- List price
- $84,900
- Delta
- -10.86%
- Verdict
- UNDERPRICED
- Comps
- 20 within 1.0 mi
Show comp detail 12 sales within ~0.75 mi
| Address | Dist | Beds/Ba | Sqft | Sold | Price | $/sf | Match |
|---|---|---|---|---|---|---|---|
| 707 Raymond St | 0.28mi | 2/1.5 | 888 (+1%) | 1mo | $150,000 | $169 | 82 |
| 605 S Barclay St | 0.23mi | 3/1.0 (+1) | 850 (-3%) | 1mo | $100,000 | $118 | 78 |
| 707 W Jenny St | 0.11mi | 2/1.0 | 792 (-10%) | 8mo | $75,000 | $95 | 72 |
| 313 S Alp St | 0.08mi | 2/2.0 | 981 (+12%) | 1mo | $165,000 | $168 | 72 |
| 201 N Warner St | 0.35mi | 3/1.0 (+1) | 902 (+3%) | 4mo | $95,000 | $105 | 71 |
| 207 E Thomas St | 0.37mi | 2/1.0 | 920 (+5%) | 9mo | $56,400 | $61 | 67 |
| 304 Main St | 0.62mi | 2/1.0 | 891 (+2%) | 2mo | $135,250 | $152 | 67 |
| 608 S Williams St | 0.41mi | 2/1.0 | 943 (+7%) | 5mo | $47,000 | $50 | 65 |
| 613 S Wenona Ave | 0.35mi | 2/1.0 | 992 (+13%) | 0mo | $92,000 | $93 | 62 |
| 604 S Barclay St | 0.25mi | 3/1.0 (+1) | 1,003 (+14%) | 1mo | $127,000 | $127 | 59 |
| 1303 S Warner St | 0.73mi | 2/1.0 | 922 (+5%) | 5mo | $74,500 | $81 | 53 |
| 607 N Warner St | 0.64mi | 3/1.5 (+1) | 925 (+5%) | 9mo | $93,000 | $101 | 47 |
Match score weights: distance 35% · size 25% · config 20% · recency 20%. Top-matched comps best support the ARV.
Projected returns pro-forma
-3.0% appreciation · 3.0% rent growth · sell at horizon
- IRR
- 24.4%
- Equity multiple
- 2.01×
- Total profit
- $23,895
- Equity at exit
- $12,659
- IRR
- 32.2%
- Equity multiple
- 3.92×
- Total profit
- $69,347
- Equity at exit
- $7,341
Cash invested: $23,772 (down + closing). Projections, not guarantees.
Landlord ↔ Tenant lean methodology
- Overall (STATE)
- 62 Landlord-Friendly
- State Michigan
- 62 Landlord-Friendly · EVEN
- County
- — inherits STATE
- City
- — inherits STATE
ZIP-level market 48706
- Active inventory
- 246
- Price-to-rent
- 4.8×
Monthly cashflow live
- Estimated rent
- $1,486 medium interval (Pro) →
- Mortgage (P&I)
- −$445
- Tax from tax record
- −$102 /mo · $1,228/yr
- Insurance
- −$35
- HOA
- −$0
- Vacancy / Maint / Mgmt
- −$312
- Net cashflow
- $591
Break-even live
Sensitivity live
| Price | -10% $639 | -5% $615 | +0% $591 | +5% $567 | +10% $543 |
|---|---|---|---|---|---|
| Rent | -10% $473 | -5% $532 | +0% $591 | +5% $650 | +10% $708 |
| Rate | -1.0pp $634 | -0.5pp $612 | base $591 | +0.5pp $569 | +1.0pp $546 |
UW: 25.0% down · 7.5% · 30yr · 1.5% tax · 5.0% vac · 8.0% maint · 8.0% mgmt
Financing live
Cash to close
- Down payment
- $21,225
- Closing costs
- $2,547
- Reserves months
- —
- Total cash needed
- —
Loan-product check · same deal, 3 products live
Conventional
25% down · 7.5% · 30yr
- Down + closing
- —
- Monthly P&I
- —
- Monthly cashflow
- —
- DSCR
- —
- Eligible?
- —
Personal DTI + credit; lowest rate.
DSCR
20% down · 8.5% · 30yr
- Down + closing
- —
- Monthly P&I
- —
- Monthly cashflow
- —
- DSCR
- —
- Eligible?
- —
No personal income docs; deal must DSCR.
Hard money
10% down · 12.0% · 12mo
- Down + closing
- —
- Monthly P&I
- —
- Monthly cashflow
- —
- DSCR
- —
- Eligible?
- —
Short-term bridge; refi at stabilization.
Rent comps 4 comps
| Address | Beds | Baths | Sqft | Rent | $/sqft | DOM | Units | Dist |
|---|---|---|---|---|---|---|---|---|
| 605 E Jane St Bay City, MI | 1.0 | 1.0 | 754 | $1,650 | $2.19 | 44d | 1 | 0.59mi |
| 1305 Washington Ave Bay City, MI | 2.0 | 1.0 | 635 | $1,675 | $2.64 | 44d | 1 | 1.24mi |
| 800 McKinley St Bay City, MI | 2.0 | 1.0 | 796 | $925 | $1.16 | 44d | 1 | 1.45mi |
| 600 18th St Bay City, MI | 2.0 | 1.0 | 1000 | $950 | $0.95 | 44d | 1 | 1.46mi |
Listing history 4 events
-
2026-05-13status Pending 464-char remark
Show marketing remark (464 chars)
Check out this solid 1 1/2 story, 3 bedroom, 1 bath home conveniently located on Bay City's westside. Enjoy the freshly painted & the newer carpeted interior along with the cozy galley style applianced kitchen. 1st floor laundry & utility room. Long lasting & low maintenance metal roof, aluminum siding & vinyl windows. Step outside to the fenced yard perfect of kids, pets or entertaining. A great value for the price, so don't hesitate!
-
2026-04-17status Active 464-char remark
Show marketing remark (464 chars)
Check out this solid 1 1/2 story, 3 bedroom, 1 bath home conveniently located on Bay City's westside. Enjoy the freshly painted & the newer carpeted interior along with the cozy galley style applianced kitchen. 1st floor laundry & utility room. Long lasting & low maintenance metal roof, aluminum siding & vinyl windows. Step outside to the fenced yard perfect of kids, pets or entertaining. A great value for the price, so don't hesitate!
-
2026-04-15status Pending 464-char remark
Show marketing remark (464 chars)
Check out this solid 1 1/2 story, 3 bedroom, 1 bath home conveniently located on Bay City's westside. Enjoy the freshly painted & the newer carpeted interior along with the cozy galley style applianced kitchen. 1st floor laundry & utility room. Long lasting & low maintenance metal roof, aluminum siding & vinyl windows. Step outside to the fenced yard perfect of kids, pets or entertaining. A great value for the price, so don't hesitate!
-
2026-04-09$84,900 Active 464-char remark
Show marketing remark (464 chars)
Check out this solid 1 1/2 story, 3 bedroom, 1 bath home conveniently located on Bay City's westside. Enjoy the freshly painted & the newer carpeted interior along with the cozy galley style applianced kitchen. 1st floor laundry & utility room. Long lasting & low maintenance metal roof, aluminum siding & vinyl windows. Step outside to the fenced yard perfect of kids, pets or entertaining. A great value for the price, so don't hesitate!
ⓘ Source: listings_history table (triggers on properties + properties_extension) + one-shot
backfill from property_details.listing_events for pre-trigger history.
Tax reassessment forecast MI · Partial reset (capped growth)
- Current annual tax
- $1,228 · $102/mo
- Projected year-2 tax
- $1,268 · $106/mo
- Expected delta
- +$40/yr (+$3/mo · 3.2%)
ⓘ Screening estimate from a state-policy table — verify with the county assessor before closing.
Climate risk First Street
- Flood 1/10 Low FEMA zone X (unshaded) · 0% chance over 30 yrs
- Wildfire 1/10 Low
- Heat 3/10 Moderate 7 d/yr ≥97°F today · 14 d/yr by 30 yrs out
- Wind 1/10 Low
- Air quality 2/10 Low 1 unhealthy d/yr today · 2 by 30 yrs out
Nearby sold comps map
Loading sold comps map…
Walkable amenities ~0.75 mi
Loading nearby amenities…
Taxation est. · year 1
- Rental income
- $17,830
- − Mortgage interest
- −$4,756
- − Property taxes
- −$1,228
- − Insurance
- −$424
- − Repairs & maintenance
- −$1,426
- − Management
- −$1,426
- − Depreciation
- −$2,470
- Taxable income
- $6,099
- Est. tax owed @ 24.0%
- −$1,464
- After-tax cash flow
- $5,627/yr
For passive investors: Depreciation is non-cash, so a rental often shows a tax loss while cash-flowing — sheltering income. Rental losses are passive: they offset passive income freely, and up to $25,000/yr can offset ordinary (W-2) income if you actively participate and your MAGI is under $100k (phasing out to $0 by $150k); unused losses carry forward. On sale, claimed depreciation is recaptured at up to 25%, and gains may owe capital-gains tax (a 1031 exchange can defer both). Figures are a year-1 estimate at your 24.0% rate — not tax advice; consult a CPA.
Schools (NCES district)
- District
- Bay City School District
- NCES district ID
- 2604260
- Math proficiency
- 27% ▼ -8.00%
- Reading proficiency
- 40% ▼ -4.00%
- Median HH income
- $43,833
- Composite
- 28.47/100
- National rank
- #6743
- State rank
- #317 of 540 in MI
Livability — Bay City
- Score
- 68/100
- State rank
- #360
- US rank
- #8912
Category grades
Schools grade is shown separately in the Schools card above.
Census & demographics
- Census place
- Bay City, MI
- City population
- 25,635
- Population (ZIP)
- 38,756
Population outlook (Bay County) Hauer SSP2
- Today (2025)
- 101,476 people
- By 2030
- 98,152 · -3.3%
- By 2040
- 89,711 · -11.6%
- By 2050
- 80,614 · -20.6%
- By 2075
- 60,544 · -40.3%
- By 2100
- 41,603 · -59.0%
Race, ethnicity, and origin ACS 2023
- Neighborhood character
- Predominantly White (90%)
- Race & ethnicity
- White 90% Hispanic / Latino 5% Two or more races 4%
- Common ancestry
- Romanian 16% Lithuanian 9% Slovak 2%
- Foreign-born
- 1%
- Languages at home
- 98% English-only · Spanish 1%
Political lean MEDSL · Bay
- 2024 margin
- R (+14.7) · D 42.0% · R 56.7% · Other 1.3%
- 2008→2024 swing
- -30.0pp toward R · 2008: 15.3pp · 2024: -14.7pp
- All cycles
- 2024: R+14.7 2020: R+11.6 2016: R+12.6 2012: D+6.0 2008: D+15.3
Not yet ingested
- Civics
- —
Market trends
- HPI YoY
- ▼ -133.29%
- Current HPI
- 203.6444
- Rent YoY
- —
- Metro
- —
- State GDP YoY
- ▲ 1.37%
- F500 in state
- 28
Industry mix (Fortune 500 HQ in MI)
| Industry | F500 HQs | Revenue |
|---|---|---|
| Automotive Parts | 3 | $48B |
|
||
| Automotive | 2 | $372B |
|
||
| Chemicals | 1 | $45B |
|
||
| Automotive Retail | 1 | $29B |
|
||
| Healthcare / Medical Devices | 1 | $23B |
|
||
| Automotive Technology | 1 | $20B |
|
||
Price history
4 events — show timeline
- 2026-05-13 Pending — MiRealSource-MiMLS
- 2026-04-17 Relisted — MiRealSource-MiMLS
- 2026-04-15 Pending — MiRealSource-MiMLS
- 2026-04-09 Listed $84,900 MiRealSource-MiMLS
Property tax history
+3.3%/yrLatest (2025): $1,228 · -10.1% YoY. Source: county tax records.
Cash-flow waterfall
monthlySold comps — $/sqft
last 12 mo · ≤1 miLoading sold comps…