777 S Federal Hwy Unit 218g · Pompano Beach, FL
Flood risk 5/10 · Moderate
- FEMA flood zone
- AE
- Chance of flooding over 30 yrs
- 0.44%
- Est. flood insurance / yr
- $1,737 – $8,500
Fire risk 1/10 · Minimal
- Est. fire insurance / yr
- $947 – $1,759
Heat risk 10/10 · Severe
- Hot days now (above 106°F)
- 7 days/yr
- Hot days in 30 yrs
- 26 days/yr
Wind risk 10/10 · Severe
- Chance of severe wind over 30 yrs
- 99.0%
Air-quality risk 2/10 · Minimal
- Unhealthy air days now
- 1 days/yr
- Unhealthy air days in 30 yrs
- 2 days/yr
Risk factors via First Street. Map © Google.
Why this score? — see what drove the C+ grade
The composite is a weighted blend of 9 inputs, each scored 0–100. Each bar is that input's sub-score; the figure is the points it added to the 100-point composite (weight × sub-score).
- Cash flow +23.2/30.0
- 1% rule +10.0/10.0
- DSCR +7.5/10.0
- ARV discount +7.5/15.0
- Schools +4.1/10.0
- Livability +3.7/5.0
- Condition / age +2.5/5.0
- Rent growth +2.4/5.0
- Appreciation +0.0/10.0
$198,000
🖨 Deal sheet (PDF) 📄 Offer letter ✓ Due diligence
Listing remarks
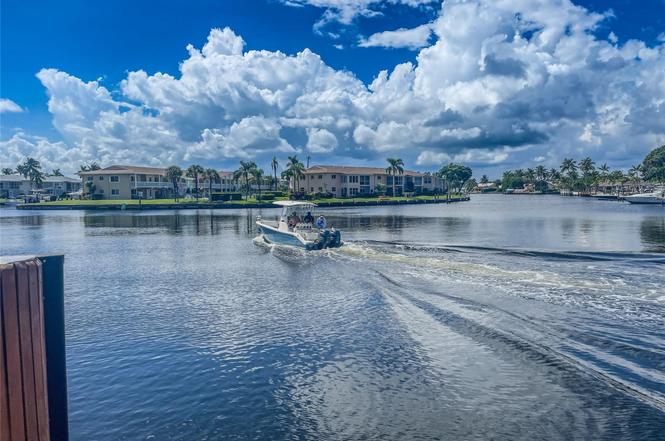
Discover unparalleled waterfront living at 777 S Federal Hwy, Pompano Beach! This stunning 2-bedroom, 2-bath condo offers a coveted split bedroom layout and features breathtaking water views from the primary bedroom, living area and Balcony. 2025 NEW AC. Relax on your private balcony and soak in the million-dollar vistas. The community is revitalizing with a new roof, repainted buildings, and vibrant landscaping. Enjoy top-notch amenities including a 24-hour manned guard gate, 2 heated pools, sauna, hot tub, courtesy bus, fitness center, Storage. Conveniently located near top restaurants, shopping, and beaches.
Key facts
- Heated pools
- Fitness center
- Private balcony
Tags
Property features AI
Finance
- HOA & community: Monthly HOA with amenities including clubhouse, pool, spa/hot tub, trash chute, and courtesy bus; HOA covers water, sewer, trash, elevator, roof repairs, and grounds maintenance
Exterior
- Parking: Assigned parking; Garage (1 space), covered
- Security: Security guard; Key card entry; Security fence; Smoke detectors
- Utilities: Cable available
- Home design: Condominium; Resale property; 3-story building; Waterfront property on the Intracoastal
- Construction: CBS construction
- Exterior features: Deck; Fenced
Interior
- Kitchen: Disposal; Dishwasher
- Bedrooms: One main-level bedroom
- Flooring: Carpet; Tile
- Bathrooms: Two full bathrooms; One bathroom on the main level
- Heating & cooling: Central heating; Central air conditioning
- Interior features: Walk-in closets; Split bedroom layout; Blinds on windows
Neighborhood map
What this means for you Summary
Snapshot
- This is a 2-bed/2.0-bath condo listed at $198k.
Deal economics
- At list price, monthly cash flow is $-68 ($-818/yr) — negative.
- To cash-flow at today's rent, offer at most $186k (6.1% below list).
- Meets the 1% rule at list price ($3k rent vs $198k).
- Recommended offer: $186k (6.1% below list) — sets the bar for cash-flow.
- Cap rate 8.5% vs local median 3.1% in Pompano Beach — top-decile yield for the area; either an underpriced asset or a hidden risk that comps aren't pricing in. Stress-test before assuming the spread holds.
Location & tenants
- Location reads 74/100 on livability (#284 in FL, #4,541 nationally) — a middle-class / working-renter tenant base. Strengths: commute A+, housing A+, cost of living B+; Watch: employment D+, amenities F.
- Broward (suburban): math 42% / reading 53% proficiency, ranked #46 of 73 in FL (top 63%) — families likely to look elsewhere, expect single-tenant / working-renter base with shorter leases.
- Zoned schools: Nova Blanche Forman Elementary (math 35% / reading 55%, grade D-, #1,271 of 2,144 statewide, top 60%, 769 students, 72% FRL); Nova Middle School (math 44% / reading 53%, grade C-, #274 of 571 statewide, top 50%, 1,284 students, 68% FRL); Nova High School (math 22% / reading 56%, grade F, #312 of 667 statewide, top 48%, 2,227 students, 59% FRL) — zoned schools average 66% FRL vs 51% district-wide (15 pts higher); higher-poverty schools than district average — tighter screening recommended.
- Market conditions: Rents soft (-0.4%/yr); 851 active listings in the ZIP; 40 comparable units currently listed for rent nearby; rentals at typical pace (median 26d on market — plan ~3-4 weeks tenant-placement turnaround); solid renter incomes; 2,111 units permitted in Broward County in 2024 (1,265 in 5+ unit buildings).
- This rent runs 43% of the median local income ($84k/yr) — at the standard rent-burdened threshold; future hikes will face affordability resistance.
Forward outlook
- Local home prices are declining (-3.0%/yr); year-one equity from $1k of loan paydown is wiped out by about $6k of value loss. Plan a longer hold.
- Broward County population projected at +34% by 2050 — long-run rental-demand tailwind backs the buy-and-hold thesis.
Negotiation context
- It's been on market 65 days — a 6% lower offer ($186k) is reasonable based on typical stale-listing flexibility.
- Current owner paid $90k; list at $198k implies a 120% gain — meaningful room to come down on a strong offer.
Risks & watch-outs
- Watch-outs: flood insurance adds $427/mo; HOA is 23% of rent.
- Climate carrying-cost: in FEMA flood zone AE (mandatory federal flood insurance); severe wind risk, 99% chance of damaging wind over 30y; extreme-heat days projected 7→26/yr by 2055 (HVAC capex compounding) — expect insurance premiums to compound above CPI over the hold.
Questions for the listing agent
- What do current leases actually rent for vs. the listed asking? Can we see a recent rent roll and the last 12 months of T-12 income?
- It's been on market 65 days. Have you received any prior offers? Is the seller open to a 6% concession, seller financing, or rate buy-down credit?
- Built in 1971 — when were the roof, HVAC, electrical panel, plumbing, and water heater last replaced?
- What's the actual annual flood-insurance premium (NFIP or private), and is the property in a SFHA with mandatory coverage?
- What does the HOA fee cover, when was the last increase, and are there any pending special assessments or reserve-fund shortfalls?
- Any open or pending special assessments — roof, HVAC, plumbing, elevator, façade? What's the per-unit balance and payoff schedule, and is the seller paying it off at close or rolling it to the buyer?
- Why hasn't it sold? Are there any deal-killer items the seller is aware of (foundation, flood, title, zoning, code violations)?
- Is there a deadline driving the sale (1031 exchange, divorce, estate, relocation)? That informs how much negotiation room exists.
- Schools are D-rated, which usually means shorter tenancies and higher turnover. Who's the typical renter profile here, and what's been the actual vacancy rate?
- What's the average days-on-market for RENTAL listings here right now (not sales)? A rising rental-DOM trend means longer vacancies and softer asking-rent achievability than the comps imply.
- What's the recent tenant-quality profile in this submarket — average credit score on applications, eviction rate, late-payment / NSF rate, and stable-employment percentage? A property-management company in the area should have these aggregated.
- How much new apartment / multifamily construction is in the pipeline within 1–3 miles? Heavy new supply (>2% of stock underway) typically softens rents 12–24 months out; light construction supports rent growth.
Investment metrics
- 1% rule
- 1.51% ✓
- Cap rate
- 8.46%
- Cash-on-cash
- 7.76%
- DSCR
- 1.35
- GRM
- 5.5
CMA / ARV
No comps found within radius.
Projected returns pro-forma
-3.0% appreciation · 0.0% rent growth · sell at horizon
- IRR
- -24.7%
- Equity multiple
- 0.20×
- Total profit
- $-44,504
- Equity at exit
- $29,522
- IRR
- -54.9%
- Equity multiple
- -0.36×
- Total profit
- $-75,420
- Equity at exit
- $17,119
Cash invested: $55,440 (down + closing). Projections, not guarantees.
Landlord ↔ Tenant lean methodology
- Overall (STATE)
- 87 Strongly Landlord-Friendly
- State Florida
- 87 Strongly Landlord-Friendly · R+3
- County
- — inherits STATE
- City
- — inherits STATE
ZIP-level market 33062
- Rents YoY
- -0.4%
- Active inventory
- 851
- Price-to-rent
- 5.5×
Monthly cashflow live
- Estimated rent
- $2,995 high interval (Pro) →
- Mortgage (P&I)
- −$1,038
- Tax from tax record
- −$195 /mo · $2,336/yr
- Insurance
- −$82
- Flood insurance flood zone
- −$427 /mo · $5,118/yr
- HOA
- −$692
- Vacancy / Maint / Mgmt
- −$629
- Net cashflow
- $-68
Break-even live
Sensitivity live
| Price | -10% $44 | -5% $-12 | +0% $-68 | +5% $-124 | +10% $-180 |
|---|---|---|---|---|---|
| Rent | -10% $-305 | -5% $-186 | +0% $-68 | +5% $50 | +10% $168 |
| Rate | -1.0pp $32 | -0.5pp $-18 | base $-68 | +0.5pp $-120 | +1.0pp $-172 |
UW: 25.0% down · 7.5% · 30yr · 1.5% tax · 5.0% vac · 8.0% maint · 8.0% mgmt
Financing live
Cash to close
- Down payment
- $49,500
- Closing costs
- $5,940
- Reserves months
- —
- Total cash needed
- —
Loan-product check · same deal, 3 products live
Conventional
25% down · 7.5% · 30yr
- Down + closing
- —
- Monthly P&I
- —
- Monthly cashflow
- —
- DSCR
- —
- Eligible?
- —
Personal DTI + credit; lowest rate.
DSCR
20% down · 8.5% · 30yr
- Down + closing
- —
- Monthly P&I
- —
- Monthly cashflow
- —
- DSCR
- —
- Eligible?
- —
No personal income docs; deal must DSCR.
Hard money
10% down · 12.0% · 12mo
- Down + closing
- —
- Monthly P&I
- —
- Monthly cashflow
- —
- DSCR
- —
- Eligible?
- —
Short-term bridge; refi at stabilization.
Rent comps 40 comps
| Address | Beds | Baths | Sqft | Rent | $/sqft | DOM | Units | Dist |
|---|---|---|---|---|---|---|---|---|
| 1100 SE 5th Ct #57 Pompano Beach, FL | 2.0 | 2.0 | 1168 | $3,400 | $2.91 | 26d | 1 | 0.09mi |
| 801 S Federal Hwy #21 Pompano Beach, FL | 2.0 | 2.0 | 1070 | $3,100 | $2.90 | 5d | 1 | 0.10mi |
| 777 S Federal Hwy Pompano Beach, FL | 2.0 | 2.0 | 1166 | $2,825 | $2.42 | 5d | 3 | 0.11mi |
| 777 S Federal Hwy Pompano Beach, FL | 1.0–2.0 | 1.0–2.0 | 947 | $3,200 | $3.38 | 17d | 6 | 0.11mi |
| 777 S Federal Hwy Pompano Beach, FL | 1.0–2.0 | 1.0–2.0 | 947 | $3,500 | $3.69 | 26d | 6 | 0.11mi |
| 1850 SE 7th St Unit B Pompano Beach, FL | 2.0 | 2.0 | 900 | $4,000 | $4.44 | 26d | 1 | 0.18mi |
| 1891 SE 5th Ct Pompano Beach, FL | 2.0 | 2.0 | 1102 | $3,000 | $2.72 | 18d | 1 | 0.38mi |
| 490 SE 19th Ave #107 Pompano Beach, FL | 2.0 | 2.0 | 960 | $1,650 | $1.72 | 17d | 1 | 0.39mi |
| 391 SE 15th Ave Pompano Beach, FL | 3.0 | 2.0 | 1332 | $5,000 | $3.75 | 26d | 1 | 0.39mi |
| 1971 SE 5th Ct Unit 303E Pompano Beach, FL | 2.0 | 2.0 | 960 | $2,400 | $2.50 | 24d | 1 | 0.40mi |
| 1971 SE 5th Ct Pompano Beach, FL | 2.0 | 2.0 | 960 | $2,050 | $2.14 | 26d | 2 | 0.41mi |
| 431 SE 19th Ave Unit 2 Pompano Beach, FL | 1.0 | 1.0 | 700 | $1,600 | $2.29 | 26d | 1 | 0.41mi |
| 690 SE 23rd Ave #1 Pompano Beach, FL | 2.0 | 2.5 | 1055 | $2,995 | $2.84 | 17d | 1 | 0.41mi |
| 1839 SE 4th St Pompano Beach, FL | 2.0 | 2.5 | 1222 | $3,800 | $3.11 | 9d | 1 | 0.45mi |
| 2333 SE 5th St #2333 Pompano Beach, FL | 3.0 | 2.5 | 1440 | $3,200 | $2.22 | 26d | 1 | 0.48mi |
| 1100 Pine Dr #102 Pompano Beach, FL | 2.0 | 2.0 | 950 | $2,100 | $2.21 | 26d | 1 | 0.49mi |
| 320 SE 11th Ave Pompano Beach, FL | 3.0 | 2.0 | 1350 | $2,250 | $1.67 | 26d | 1 | 0.56mi |
| 160 SE 15th Ave Pompano Beach, FL | 3.0 | 2.0 | 1500 | $3,900 | $2.60 | 22d | 1 | 0.59mi |
| 160 SE 15th Ave Pompano Beach, FL | 2.0 | 1.0 | 1200 | $2,800 | $2.33 | 20d | 1 | 0.59mi |
| 160 SE 15th Ave Pompano Beach, FL | 2.0 | 1.0 | 1200 | $2,800 | $2.33 | 1d | 1 | 0.59mi |
| 912 Pine Dr #211 Pompano Beach, FL | 2.0 | 2.0 | 949 | $1,900 | $2.00 | 26d | 1 | 0.62mi |
| 320 SE 10th Ave Unit D Pompano Beach, FL | 2.0 | 2.0 | 1000 | $2,300 | $2.30 | 26d | 1 | 0.62mi |
| 511 SE 5th St Pompano Beach, FL | 2.0 | 2.0 | 1276 | $4,200 | $3.29 | 24d | 1 | 0.62mi |
| 511 SE 5th St Pompano Beach, FL | 2.0 | 2.0 | 1276 | $4,200 | $3.29 | 26d | 1 | 0.62mi |
| 305 SE 11th Ave Unit D Pompano Beach, FL | 3.0 | 2.0 | 1000 | $2,400 | $2.40 | 18d | 1 | 0.64mi |
| 8 SE 19th Ave #11 Pompano Beach, FL | 2.0 | 1.0 | 842 | $1,795 | $2.13 | 26d | 1 | 0.64mi |
| 840 Pine Dr #103 Pompano Beach, FL | 2.0 | 2.0 | 904 | $2,800 | $3.10 | 26d | 1 | 0.67mi |
| 1201 S Riverside Dr #307 Pompano Beach, FL | 1.0 | 1.0 | 772 | $2,400 | $3.11 | 9d | 1 | 0.69mi |
| 1201 S Riverside Dr #106 Pompano Beach, FL | 1.0 | 1.0 | 772 | $2,400 | $3.11 | 26d | 1 | 0.69mi |
| 2321 SE 15th St Unit 2321 Pompano Beach, FL | 3.0 | 2.0 | 1313 | $6,100 | $4.65 | 26d | 1 | 0.71mi |
| 2548 SE 14th St Pompano Beach, FL | 2.0 | 2.0 | 1400 | $12,000 | $8.57 | 3d | 1 | 0.71mi |
| 2548 SE 14th St Pompano Beach, FL | 2.0 | 2.0 | 1400 | $12,000 | $8.57 | 26d | 1 | 0.71mi |
| 1001 SE 5th Ave Pompano Beach, FL | 3.0 | 2.0 | 1492 | $4,500 | $3.02 | 26d | 1 | 0.72mi |
| 241 SE 9th Ave Pompano Beach, FL | 2.0 | 2.0 | 725 | $1,800 | $2.48 | 13d | 2 | 0.74mi |
| 1001 S Riverside Dr #105 Pompano Beach, FL | 1.0 | 1.0 | 700 | $2,250 | $3.21 | 26d | 1 | 0.74mi |
| 3201 SE 12th St Unit B4 Pompano Beach, FL | 2.0 | 2.0 | 1000 | $2,400 | $2.40 | 26d | 1 | 0.75mi |
| 23 NE 19th Ave Pompano Beach, FL | 1.0 | 1.0 | 900 | $2,500 | $2.78 | 9d | 1 | 0.75mi |
| 797 S Riverside Dr Pompano Beach, FL | 2.0 | 2.5 | 1328 | $3,750 | $2.82 | 1d | 1 | 0.77mi |
| 751 Pine Dr #101 Pompano Beach, FL | 3.0 | 2.0 | 1200 | $2,600 | $2.17 | 26d | 1 | 0.77mi |
| 751 Pine Dr #104 Pompano Beach, FL | 3.0 | 2.0 | 1200 | $2,400 | $2.00 | 7d | 1 | 0.77mi |
HOA detail condo
- Monthly dues
- $692 · $8,304/yr
- Likely covers
- waterlandscapingpoolgym
- Assessments
- None detected in remarks — confirm with the listing agent.
Listing history 7 events
-
2026-05-15status Pending
-
2026-04-15price $198,000
-
2026-04-04price $215,000
-
2025-10-30$229,000 Active
-
1999-10-13soldstatus $90,000
-
1981-04-01soldstatus $71,000
-
1979-02-01soldstatus $57,000
ⓘ Source: listings_history table (triggers on properties + properties_extension) + one-shot
backfill from property_details.listing_events for pre-trigger history.
Tax reassessment forecast FL · Resets to sale price
- Current annual tax
- $2,336 · $195/mo
- Projected year-2 tax
- $2,336 · $195/mo
- Expected delta
- $0/yr ($0/mo · 0.0%)
ⓘ Screening estimate from a state-policy table — verify with the county assessor before closing.
Climate risk First Street
- Flood 5/10 Major FEMA zone AE · 44% chance over 30 yrs
- Wildfire 1/10 Low
- Heat 10/10 Extreme 7 d/yr ≥106°F today · 26 d/yr by 30 yrs out
- Wind 10/10 Extreme 99% chance of damaging wind over 30 yrs
- Air quality 2/10 Low 1 unhealthy d/yr today · 2 by 30 yrs out
Nearby sold comps map
Loading sold comps map…
Walkable amenities ~0.75 mi
Loading nearby amenities…
Taxation est. · year 1
- Rental income
- $35,937
- − Mortgage interest
- −$11,091
- − Property taxes
- −$2,336
- − Insurance
- −$6,108
- − Repairs & maintenance
- −$2,875
- − Management
- −$2,875
- − HOA
- −$8,304
- − Depreciation
- −$5,760
- Taxable loss
- −$3,413
- Est. tax savings @ 24.0%
- +$819
- After-tax cash flow
- $1/yr
For passive investors: Depreciation is non-cash, so a rental often shows a tax loss while cash-flowing — sheltering income. Rental losses are passive: they offset passive income freely, and up to $25,000/yr can offset ordinary (W-2) income if you actively participate and your MAGI is under $100k (phasing out to $0 by $150k); unused losses carry forward. On sale, claimed depreciation is recaptured at up to 25%, and gains may owe capital-gains tax (a 1031 exchange can defer both). Figures are a year-1 estimate at your 24.0% rate — not tax advice; consult a CPA.
Schools (NCES district)
- District
- Broward
- NCES district ID
- 1200180
- Math proficiency
- 42% ▼ -18.00%
- Reading proficiency
- 53% ▼ -5.00%
- Median HH income
- $52,139
- Composite
- 40.88/100
- National rank
- #3621
- State rank
- #46 of 73 in FL
Livability — Pompano Beach
- Score
- 74/100
- State rank
- #284
- US rank
- #4541
Category grades
Schools grade is shown separately in the Schools card above.
Census & demographics
- Census place
- Pompano Beach, FL
- County
- Broward County · 1,963,430 people
- City population
- 155,861
- Metro
- Miami-Fort Lauderdale-Pompano Beach, FL
- Population (ZIP)
- 24,920
- Household income
- $83,582
- Rent vs Own
- Severe rent burden
- 1298.0
Population outlook (Broward County) Hauer SSP2
- Today (2025)
- 2,207,033 people
- By 2030
- 2,360,704 · +7.0%
- By 2040
- 2,661,208 · +20.6%
- By 2050
- 2,946,698 · +33.5%
- By 2075
- 3,602,273 · +63.2%
- By 2100
- 3,970,984 · +79.9%
Race, ethnicity, and origin ACS 2023
- Neighborhood character
- Predominantly White (76%)
- Race & ethnicity
- White 76% Hispanic / Latino 16% Two or more races 12% Black 3%
- Hispanic origin (detail)
- Puerto Rican 4% Cuban 3%
- Common ancestry
- Romanian 4% Italian 3% Scotch-Irish 2%
- Foreign-born
- 22% · Canada, Jamaica, Dominican Republic
- Languages at home
- 74% English-only · Spanish 14% Other Indo-European 4% Russian/Polish/Slavic 2%
Political lean MEDSL · Broward
- 2024 margin
- D (+17.0) · D 58.0% · R 41.0%
- 2008→2024 swing
- -17.8pp toward R · 2008: 34.7pp · 2024: 17.0pp
- All cycles
- 2024: D+17.0 2020: D+29.8 2016: D+35.0 2012: D+34.9 2008: D+34.7
Not yet ingested
- Civics
- —
Market trends
- HPI YoY
- ▼ -427.01%
- Current HPI
- 342.9461
- Rent YoY
- ▼ -0.36%
- Metro
- Miami-Fort Lauderdale-Pompano Beach, FL
- State GDP YoY
- ▲ 3.28%
- F500 in state
- 36
Industry mix (Fortune 500 HQ in FL)
| Industry | F500 HQs | Revenue |
|---|---|---|
| Industrial Technology | 2 | $29B |
|
||
| Insurance | 2 | $17B |
|
||
| Retail | 1 | $60B |
|
||
| Technology Distribution | 1 | $58B |
|
||
| Homebuilding | 1 | $35B |
|
||
| Technology Manufacturing | 1 | $35B |
|
||
Price history
+247.4% since first listed7 events — show timeline
- 2026-05-15 Pending — Beaches MLS
- 2026-04-15 Price Changed $198,000 Beaches MLS
- 2026-04-04 Price Changed $215,000 Beaches MLS
- 2025-10-30 Listed $229,000 Beaches MLS
- 1999-10-13 Sold (Public Records) $90,000 Public Records
- 1981-04-01 Sold (Public Records) $71,000 Public Records
- 1979-02-01 Sold (Public Records) $57,000 Public Records
Property tax history
+2.4%/yrLatest (2025): $2,336 · +4.0% YoY. Source: county tax records.
Cash-flow waterfall
monthlySold comps — $/sqft
last 12 mo · ≤1 miLoading sold comps…