 🏷️ Likely Rental
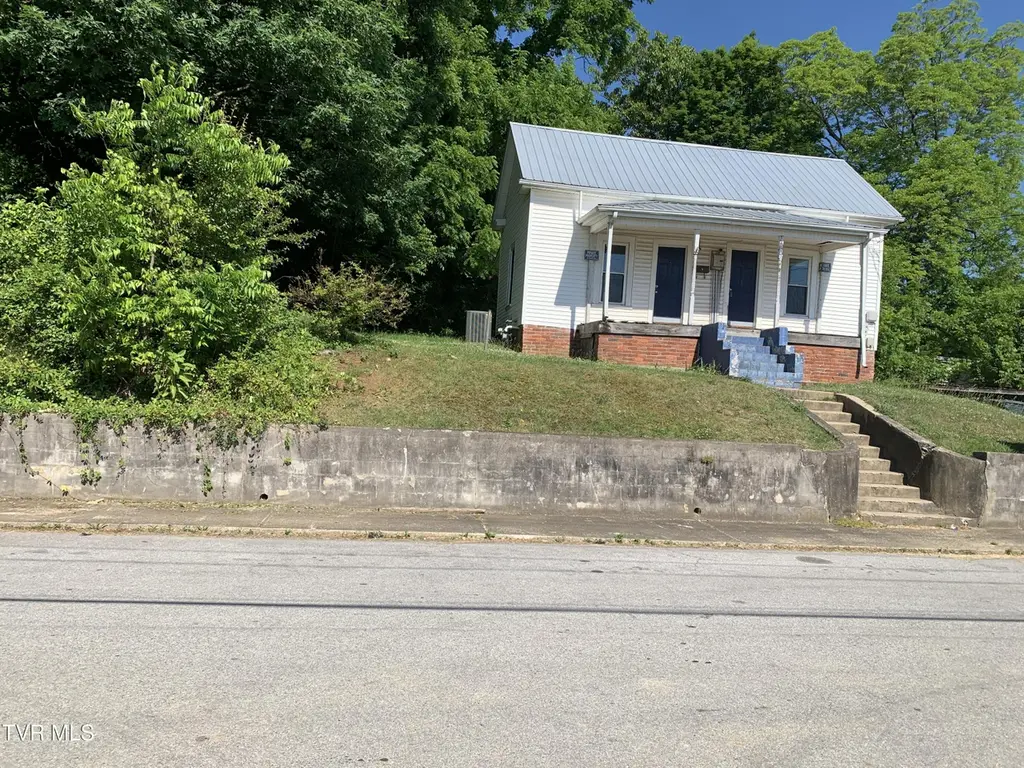
306 Davis St · Greeneville, TN
Flood risk 1/10 · Minimal
- FEMA flood zone
- X (unshaded)
- Chance of flooding over 30 yrs
- 0.0%
- Est. flood insurance / yr
- $507 – $1,088
Fire risk 4/10 · Minor
- Est. fire insurance / yr
- $949 – $1,763
Heat risk 5/10 · Moderate
- Hot days now (above 101°F)
- 7 days/yr
- Hot days in 30 yrs
- 21 days/yr
Wind risk 2/10 · Minimal
- Chance of severe wind over 30 yrs
- —
Air-quality risk 2/10 · Minimal
- Unhealthy air days now
- 1 days/yr
- Unhealthy air days in 30 yrs
- 1 days/yr
Risk factors via First Street. Map © Google.
Why this score? — see what drove the C+ grade
The composite is a weighted blend of 9 inputs, each scored 0–100. Each bar is that input's sub-score; the figure is the points it added to the 100-point composite (weight × sub-score).
- Cash flow +22.9/30.0
- ARV discount +15.0/15.0
- DSCR +7.3/10.0
- 1% rule +4.9/10.0
- Livability +3.3/5.0
- Schools +2.7/10.0
- Rent growth +2.5/5.0
- Condition / age +2.5/5.0
- Appreciation +0.0/10.0
$107,900
🖨 Deal sheet 📄 Offer letter ✓ Due diligence
Listing remarks
Investors looking to Invest! Great in-town location. Zoned B4 Just off the main entrance to Greeneville. Newer roof proximity 4 years old. Previous rental property. Rents for $500 per month. The home is being painted. More pictures to come! buyer's agent or buyers to verify Information!
Key facts
- 8,276 sq ft lot
- Built 1935
- Listed 31 days
Property features AI
Finance
- Other: Lot dimensions approximately 56 x 150 (0.19 acre)
- Financial info: No financial or investor-specific details listed
- HOA & community: No HOA information listed
Exterior
- Parking: Gravel parking; no garage
- Security: No security features listed
- Utilities: Public water; Public sewer; Natural gas available and connected; Cable available and connected
- Home design: Single-family house; One level; B4 zoning
- Construction: Vinyl siding; Metal roof; Crawl space foundation; Built as a house (year not provided)
- Exterior features: Front porch; Level to sloped topography
Interior
- Kitchen: Other appliances (details not specified)
- Bedrooms: Total of 6 rooms (bedroom breakdown not specified)
- Flooring: Carpet; Vinyl
- Bathrooms: 1 full bathroom
- Heating & cooling: Natural gas heating; No cooling (no central air listed)
- Interior features: Other interior features (see remarks); Two fireplaces (details/remarks)
- Laundry & utility: No specific laundry details listed
Neighborhood map
What this means for you Summary
Snapshot
- This is a 2-bed/1.0-bath single-family listed at $108k.
Deal economics
- At list price, monthly cash flow is $189 ($2k/yr) — positive.
- The deal already cash-flows at list — no discount required.
- To meet the 1% rule (rent ≥ 1% of price), the offer needs to be $106k (1.5% below list).
- Recommended offer: $105k (3.0% below list) — sets the bar for market timing.
- Cap rate 8.4% vs local median 2.7% in Greeneville — top-decile yield for the area; either an underpriced asset or a hidden risk that comps aren't pricing in. Stress-test before assuming the spread holds.
Location & tenants
- Location reads 66/100 on livability (#125 in TN) — a middle-class / working-renter tenant base. Strengths: cost of living A+, housing A+, health & safety A+; Watch: amenities F, commute F, employment F.
- Greeneville (town): math 31% / reading 34% proficiency, ranked #45 of 139 in TN (top 32%) — families likely to look elsewhere, expect single-tenant / working-renter base with shorter leases.
- Zoned schools: Highland Elementary (math 12% / reading 22%, grade F, #709 of 952 statewide, top 77%, 159 students, 0% FRL); Greeneville Middle School (math 28% / reading 26%, grade F, #128 of 333 statewide, top 40%, 571 students, 0% FRL); Greeneville High School (math 42% / reading 55%, grade D, #13 of 332 statewide, top 4%, 958 students, 0% FRL) — zoned schools average 0% FRL vs 42% district-wide (42 pts lower); this property's tenant base skews higher-income than the district average.
- Market conditions: 252 active listings in the ZIP; 333 units permitted in Greene County in 2024 (72 in 5+ unit buildings).
Forward outlook
- Local home prices are declining (-3.0%/yr); year-one equity from $746 of loan paydown is wiped out by about $3k of value loss. Plan a longer hold.
- Greene County population projected to shrink 8% by 2050 — rents likely to lag national; underwrite the cash flow, not the appreciation.
Negotiation context
- It's been on market 32 days — a 3% lower offer ($105k) is reasonable based on typical stale-listing flexibility.
- Current owner paid $8k; list at $108k implies a 1339% gain — meaningful room to come down on a strong offer.
Risks & watch-outs
- Watch-outs: built in 1935 — expect roof / HVAC / electrical / plumbing capex.
- Climate carrying-cost: extreme-heat days projected 7→21/yr by 2055 (HVAC capex compounding) — expect insurance premiums to compound above CPI over the hold.
Questions for the listing agent
- It's been on market 32 days. Have you received any prior offers? Is the seller open to a 3% concession, seller financing, or rate buy-down credit?
- Built in 1935 — when were the roof, HVAC, electrical panel, plumbing, and water heater last replaced?
- Is there a deadline driving the sale (1031 exchange, divorce, estate, relocation)? That informs how much negotiation room exists.
- Schools are D-rated, which usually means shorter tenancies and higher turnover. Who's the typical renter profile here, and what's been the actual vacancy rate?
- What's the average days-on-market for RENTAL listings here right now (not sales)? A rising rental-DOM trend means longer vacancies and softer asking-rent achievability than the comps imply.
- What's the recent tenant-quality profile in this submarket — average credit score on applications, eviction rate, late-payment / NSF rate, and stable-employment percentage? A property-management company in the area should have these aggregated.
- How much new for-sale + rental construction is in the pipeline within 1–3 miles? Heavy new supply typically softens prices + rents 12–24 months out; constrained supply supports both.
Investment metrics
- 1% rule
- 0.99% ✗
- Cap rate
- 8.39%
- Cash-on-cash
- 7.49%
- DSCR
- 1.33
- GRM
- 8.5
CMA / ARV
- ARV (on-the-fly)
- $145,512
- Comps found
- 11
Show comp detail 11 sales within ~0.75 mi
| Address | Dist | Beds/Ba | Sqft | Sold | Price | $/sf | Match |
|---|---|---|---|---|---|---|---|
| 714 Floral St | 0.26mi | 2/1.0 | 843 (-0%) | 8mo | $145,000 | $172 | 80 |
| 304 Highland Ave | 0.45mi | 2/1.0 | 905 (+7%) | 2mo | $62,000 | $69 | 66 |
| 327 Floral St | 0.13mi | 3/1.0 (+1) | 924 (+9%) | 20mo | $35,000 | $38 | 57 |
| 816 Carson St | 0.63mi | 2/1.0 | 800 (-5%) | 7mo | $152,000 | $190 | 56 |
| 320 Highland Ave | 0.52mi | 3/1.0 (+1) | 903 (+7%) | 6mo | $55,000 | $61 | 54 |
| 104 Clem St | 0.17mi | 2/1.0 | 750 (-11%) | 22mo | $128,000 | $171 | 54 |
| 330 Church St | 0.69mi | 3/2.0 (+1) | 860 (+2%) | 3mo | $210,000 | $244 | 54 |
| 700 Church St | 0.43mi | 2/2.0 | 872 (+3%) | 21mo | $168,750 | $194 | 54 |
| 211 Home St | 0.40mi | 2/1.0 | 912 (+8%) | 23mo | $170,000 | $186 | 49 |
| 822 Carson St | 0.64mi | 2/1.0 | 825 (-2%) | 24mo | $194,000 | $235 | 46 |
| 128 Unaka Aly | 0.74mi | 2/1.0 | 910 (+8%) | 17mo | $152,000 | $167 | 38 |
Match score weights: distance 35% · size 25% · config 20% · recency 20%. Top-matched comps best support the ARV.
Projected returns pro-forma
-3.0% appreciation · 3.0% rent growth · sell at horizon
- IRR
- -4.9%
- Equity multiple
- 0.82×
- Total profit
- $-5,511
- Equity at exit
- $16,088
- IRR
- 4.7%
- Equity multiple
- 1.35×
- Total profit
- $10,501
- Equity at exit
- $9,329
Cash invested: $30,212 (down + closing). Projections, not guarantees.
Landlord ↔ Tenant lean methodology
- Overall (STATE)
- 87 Strongly Landlord-Friendly
- State Tennessee
- 87 Strongly Landlord-Friendly · R+13
- County
- — inherits STATE
- City
- — inherits STATE
ZIP-level market 37743
- Home prices YoY
- -8.5%
- Active inventory
- 252
- Price-to-rent
- 8.5×
Monthly cashflow live
- Estimated rent
- $1,063 medium interval (Pro) →
- Mortgage (P&I)
- −$566
- Tax from tax record
- −$40 /mo · $483/yr
- Insurance
- −$45
- HOA
- −$0
- Vacancy / Maint / Mgmt
- −$223
- Net cashflow
- $189
Break-even live
UW: 25.0% down · 7.5% · 30yr · 1.5% tax · 5.0% vac · 8.0% maint · 8.0% mgmt
Financing live
Cash to close
- Down payment
- $26,975
- Closing costs
- $3,237
- Reserves months
- —
- Total cash needed
- —
Loan-product check · same deal, 3 products live
Conventional
25% down · 7.5% · 30yr
- Down + closing
- —
- Monthly P&I
- —
- Monthly cashflow
- —
- DSCR
- —
- Eligible?
- —
Personal DTI + credit; lowest rate.
DSCR
20% down · 8.5% · 30yr
- Down + closing
- —
- Monthly P&I
- —
- Monthly cashflow
- —
- DSCR
- —
- Eligible?
- —
No personal income docs; deal must DSCR.
Hard money
10% down · 12.0% · 12mo
- Down + closing
- —
- Monthly P&I
- —
- Monthly cashflow
- —
- DSCR
- —
- Eligible?
- —
Short-term bridge; refi at stabilization.
Listing history 17 events
-
2026-06-19days on market $107,900 Active 32 DOM
-
2026-06-18days on market $107,900 Active 31 DOM
-
2026-06-17days on market $107,900 Active 30 DOM
-
2026-06-16days on market $107,900 Active 29 DOM
-
2026-06-15days on market $107,900 Active 28 DOM
-
2026-06-14days on market $107,900 Active 26 DOM
-
2026-06-12days on market $107,900 Active 25 DOM
-
2026-06-09days on market $107,900 Active 22 DOM
-
2026-06-08days on market $107,900 Active 21 DOM
-
2026-06-07days on market $107,900 Active 20 DOM
-
2026-06-03days on market $107,900 Active 16 DOM
-
2026-06-02days on market $107,900 Active 15 DOM
-
2026-06-01days on market $107,900 Active 14 DOM
-
2026-05-31days on market $107,900 Active 13 DOM
-
2026-05-30days on market $107,900 Active 12 DOM
-
2026-05-18$107,900 Active
-
2005-11-14soldstatus $7,500
ⓘ Source: listings_history table (triggers on properties + properties_extension) + one-shot
backfill from property_details.listing_events for pre-trigger history.
Tax reassessment forecast TN · Resets to sale price
- Current annual tax
- $483 · $40/mo
- Projected year-2 tax
- $766 · $64/mo
- Expected delta
- +$283/yr (+$24/mo · 58.6%)
ⓘ Screening estimate from a state-policy table — verify with the county assessor before closing.
Climate risk First Street
- Flood 1/10 Low FEMA zone X (unshaded) · 0% chance over 30 yrs
- Wildfire 4/10 Moderate
- Heat 5/10 Major 7 d/yr ≥101°F today · 21 d/yr by 30 yrs out
- Wind 2/10 Low
- Air quality 2/10 Low 1 unhealthy d/yr today · 1 by 30 yrs out
Nearby sold comps map
Loading sold comps map…
Walkable amenities ~0.75 mi
Loading nearby amenities…
Taxation est. · year 1
- Rental income
- $12,755
- − Mortgage interest
- −$6,044
- − Property taxes
- −$483
- − Insurance
- −$540
- − Repairs & maintenance
- −$1,020
- − Management
- −$1,020
- − Depreciation
- −$3,139
- Taxable income
- $509
- Est. tax owed @ 24.0%
- −$122
- After-tax cash flow
- $2,142/yr
For passive investors: Depreciation is non-cash, so a rental often shows a tax loss while cash-flowing — sheltering income. Rental losses are passive: they offset passive income freely, and up to $25,000/yr can offset ordinary (W-2) income if you actively participate and your MAGI is under $100k (phasing out to $0 by $150k); unused losses carry forward. On sale, claimed depreciation is recaptured at up to 25%, and gains may owe capital-gains tax (a 1031 exchange can defer both). Figures are a year-1 estimate at your 24.0% rate — not tax advice; consult a CPA.
Schools (NCES district)
- District
- Greeneville
- NCES district ID
- 4701500
- Math proficiency
- 31% ▼ -15.00%
- Reading proficiency
- 34% ▼ -7.00%
- Median HH income
- $32,683
- Composite
- 26.62/100
- National rank
- #7176
- State rank
- #45 of 139 in TN
Livability — Greeneville
- Score
- 66/100
- State rank
- #125
- US rank
- #11825
Category grades
Schools grade is shown separately in the Schools card above.
Census & demographics
- Census place
- Greeneville, TN
- County
- Greene County · 45,638 people
- City population
- 45,638
- Metro
- Greeneville, TN
- Population (ZIP)
- 24,548
- Household income
- $54,566
- Rent vs Own
- Severe rent burden
- 390.0
Population outlook (Greene County) Hauer SSP2
- Today (2025)
- 68,624 people
- By 2030
- 68,114 · -0.7%
- By 2040
- 66,167 · -3.6%
- By 2050
- 63,038 · -8.1%
- By 2075
- 55,274 · -19.5%
- By 2100
- 45,527 · -33.7%
Race, ethnicity, and origin ACS 2023
- Neighborhood character
- Predominantly White (91%)
- Race & ethnicity
- White 91% Two or more races 5% Hispanic / Latino 2% Black 2%
- Common ancestry
- Serbian 3% Italian 2% Romanian 2%
- Foreign-born
- 2% · Canada
- Languages at home
- 97% English-only · Spanish 2%
Political lean MEDSL · Greene
- 2024 margin
- Solid R (+65.7) · D 16.6% · R 82.3% · Other 1.2%
- 2008→2024 swing
- -25.0pp toward R · 2008: -40.7pp · 2024: -65.7pp
- All cycles
- 2024: R+65.7 2020: R+60.7 2016: R+61.0 2012: R+46.0 2008: R+40.7
Not yet ingested
- Civics
- —
Market trends
- HPI YoY
- ▼ -28.08%
- Current HPI
- 303.4589
- Rent YoY
- —
- Metro
- Greeneville, TN
- State GDP YoY
- ▲ 2.78%
- F500 in state
- 22
Industry mix (Fortune 500 HQ in TN)
| Industry | F500 HQs | Revenue |
|---|---|---|
| Healthcare | 3 | $91B |
|
||
| Retail | 3 | $72B |
|
||
| Transportation / Logistics | 1 | $88B |
|
||
| Paper / Packaging | 1 | $19B |
|
||
| Insurance | 1 | $13B |
|
||
| Energy | 1 | $12B |
|
||
Price history
+1338.7% since first listed2 events — show timeline
- 2026-05-18 Listed $107,900 TVRMLS
- 2005-11-14 Sold (Public Records) $7,500 Public Records
Property tax history
+6.1%/yrLatest (2025): $483 · +0.0% YoY. Source: county tax records.
Cash-flow waterfall
monthlySold comps — $/sqft
last 12 mo · ≤1 miLoading sold comps…